

Abstract
Background
Clinical and research advancements in the field of fetal alcohol spectrum disorders (FASD) require accurate and valid identification of FASD clinical subgroups.
Objectives
A comprehensive neuropsychological battery, coupled with magnetic resonance imaging, (MRI), MR spectroscopy (MRS), and functional MRI (fMRI) were administered to children with fetal alcohol spectrum disorders (FASD) to determine if global and/or focal abnormalities could be identified across the spectrum, and distinguish diagnostic subclassifications within the spectrum. The neuropsychological outcomes of the comprehensive neuroimaging study are presented here.
Methods
The study groups included: 1) FAS/Partial FAS; 2) Static Encephalopathy/Alcohol Exposed (SE/AE); 3) Neurobehavioral Disorder/Alcohol Exposed (ND/AE) as diagnosed by an interdisciplinary team using the FASD 4-Digit Code; and 4) healthy peers with no prenatal alcohol. A standardized neuropsychological battery was administered to each child and their primary caregiver by a psychologist.
Results
Use of the 4-Digit Code produced three clinically and statistically distinct FASD clinical subgroups. The three subgroups (ND/AE, SE/AE and FAS/PFAS) reflected a linear continuum of increasing neuropsychological impairment and physical abnormality, representing the full continuum of FASD. Behavioral and psychiatric disorders were comparably prevalent across the three FASD groups, and significantly more prevalent than among the Controls. All three FASD subgroups had comparably high levels of prenatal alcohol exposure.
Conclusions
Although ND/AE, SE/AE, and FAS/PFAS are distinct FASD subgroups, these groups are not distinguishable solely by their neuropsychological profiles. While all children within a group shared the same magnitude of neuropsychological impairment, the patterns of impairment showed considerable individual variability. MRI, MRS and fMRI further distinguished these FASD subgroups.
Keywords: Fetal alcohol spectrum disorder (FASD), magnetic resonance (MR), FASD 4-Digit Diagnostic Code, neuropsychological
While the focus of this report is to assess the neuropsychological, behavioral, and physical features that distinguish three FASD clinical subgroups, these data are the product of a larger, recently completed magnetic resonance imaging (MRI) (submitted for publication), MR spectroscopy (MRS)1 , and functional MRI (fMRI)2 study of children with FASD. The key objective of the neuroimaging study was to determine if brain abnormalities could be detected between clinical subgroups along the full continuum of FASD. To conduct such a study, one must be able to establish distinct FASD clinical subgroups, empirically confirm they are distinct, and specifically describe how they are distinct. To establish these groups, the FASD 4-Digit Diagnostic Code2 was employed. Thus, the primary question, and focus of this report—Were three distinct FASD subgroups successfully established, and how are they distinct? The establishment of these distinct groups was integral to the design and interpretation of the separately reported MRI, MRS, and fMRI components of this study. Presented below is the clinical rationale for the larger neuroimaging study and the essential role of this neuropsychological component.
Fetal alcohol syndrome (FAS) is a permanent birth defect syndrome caused by maternal alcohol consumption during pregnancy. FAS is defined by growth deficiency, a unique cluster of minor facial anomalies, and central nervous system (CNS) dysfunction and/or structural brain abnormalities.4 Not all individuals with prenatal alcohol exposure present with CNS abnormalities, and not all who present with CNS abnormalities have FAS. Recently, the term FASD was coined to depict the full spectrum of outcomes observed among individuals with prenatal alcohol exposure. FASD is not a medical diagnosis. Rather, medical diagnoses like FAS, Partial FAS, Static Encephalopathy/Alcohol Exposed (SE/AE), Neurobehavioral Disorder/Alcohol Exposed (ND/AE), Alcohol Related Neurodevelopmental Disorder (ARND)3,5,6 fall under the umbrella of FASD.
The degree of brain damage among individuals with prenatal alcohol exposure may vary from microcellular and neurochemical aberrations to gross structural anomalies. Similarly, neuropsychological/behavioral dysfunction varies along the full continuum from mild developmental delay or learning disabilities to global developmental disability.
The neuropsychological/behavioral problems in this condition stem from the prenatal brain damage. The specificity of the FAS facial phenotype to prenatal alcohol exposure lends credence to the clinical judgment that the neuropsychological and behavioral dysfunction observed in individuals with FAS is due, at least in part, to brain damage caused by prenatal alcohol exposure.7–9 Unfortunately without the unique facial phenotype of FAS or at least a severe or clinically obvious expression of brain damage, the neurodevelopmental disabilities of an individual with prenatal alcohol exposure often go unrecognized and inappropriately served.10
Many individuals with prenatal alcohol exposure exhibit cognitive difficulties and significant maladaptation that prevent them from leading productive, independent lives.11,12 Prior literature finds that regardless of overall intellectual level, most individuals show a range of identifiable cognitive deficits—at a rate greater than that expected given their IQ.13 Executive functioning deficits have consistently been identified.14–17 Deficiencies in attention are often viewed as hallmark features of prenatal alcohol exposure.18 Deficits in complex visual-spatial skills, learning and memory, and a high prevalence and wide variety of speech/language deficits have been documented.19 Difficulties in adaptive behavior have consistently been noted10, 20–22 and risk of increased psychiatric disorders.12 The profile of cognitive dysfunction among these individuals is highly variable, though there are some commonalities in functional compromise among subgroups, and conceptual models of overarching deficits have been proposed.23 However, no single behavioral phenotype specific to alcohol teratogenicity has been described. Without a specific behavioral phenotype, attributing an alcohol-exposed child’s dysfunction to brain damage is often questionable at a clinical level.9 If indisputable evidence of brain damage (e.g., alterations in neurostructure, neurometabolites, and/or neuroactivation) could be found in alcohol-exposed individuals who present with neuropsychological deficits, but no physical features of FAS, the “disability” of these individuals would be more clearly established, and could help them qualify for needed services.
MRI, MRS, and fMRI offer non-invasive methods for in vivo assessment of neuroabnormalities. An extensive FASD MRI research literature exists.24–27 A few FASD studies utilizing fMRI and MRS have also been published.28–30 In general, many of these FASD neuroimaging studies have found evidence of brain alterations among individuals with full FAS, regardless of FASD diagnostic system used, but have not always found clear evidence of brain alterations among nondysmorphic FASD subgroups. The majority of FASD neuroimaging studies have enrolled study groups diagnosed or classified as FAS, Fetal Alcohol Effects (FAE), Alcohol Related Neurodevelopmental Disorders (ARND), or Prenatal Alcohol Exposed (PEA) prior to the establishment of comprehensive, case-defined FASD diagnostic guidelines that are quickly becoming best practice.3,5,6 The specific diagnostic criteria used to establish the FASD study groups (e.g., level of growth deficiency; type, number and severity of facial anomalies; breadth and magnitude of neuropsychological deficit; type of neurostructural anomaly present), were typically not reported. Absence of rigorous diagnostic methods can lead to diagnostic misclassification and obscure distinctions between FASD subgroups. Astley and Clarren31 and Hoyme et al32 have both confirmed, using two large clinical datasets, that the majority of individuals diagnosed with FAS by a gestalt approach lose that diagnostic classification when more rigorous diagnostic guidelines are applied. Misclassification error impacts study validity and reduces the power of a study to detect clinically meaningful differences between FASD subgroups.33 If specific diagnostic features that define the FASD study groups are not reported, this limits the ability to compare outcomes across studies.
The recently completed MRI (submitted for publication), MRS1, and fMRI2 study was designed to overcome these limitations by using a comprehensive, case-defined diagnostic system. For this study, the FASD 4-Digit Diagnostic Code was used to establish three distinct FASD clinical subgroups (FAS/PFAS, SE/AE, and ND/AE). The focus of this report is to confirm and describe how these three FASD subgroups are clinically distinct. In describing these three clinically distinct groups, their complex neuropsychological, behavioral, and psychiatric profiles are revealed. This information is integral to the design and interpretation of the separately reported MRI, MRS1, and fMRI2 components of this study.
METHODS
Subjects and Study Groups
The protocol was approved by the University of Washington Human Subjects Review Board. The three FASD groups were selected from among 1,200 patients previously diagnosed by an interdisciplinary team in the WA State FAS Diagnostic & Prevention Network (FAS DPN) of clinics using a practical, comprehensive diagnostic system called the FASD 4-Digit Code.3 Briefly, the 4 digits of the FASD 4-Digit Code3,31 reflect the magnitude of expression of the 4 key diagnostic features of FASD, in the following order:
growth deficiency,
FAS facial phenotype,
CNS structural/functional abnormalities, and
prenatal alcohol exposure (Figure 1).
FIG. 1.

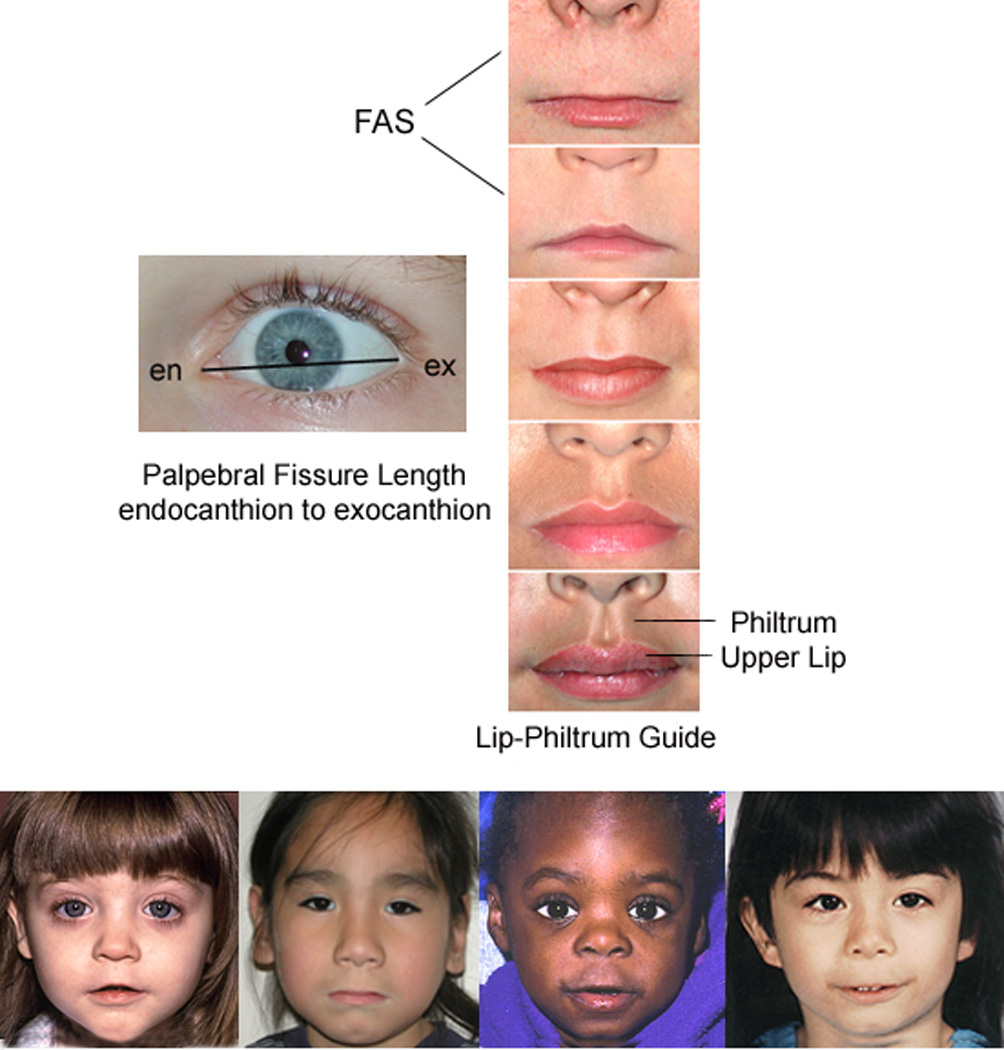
A) FASD 4-Digit Diagnostic Code grid. FASD is defined by growth deficiency, specific FAS facial features, evidence of CNS damage and prenatal alcohol exposure. The 4-Digit Code ranks each of these areas on 4-point, case-defined, Likert scales. The 4-Digit Code (3444) inserted in the grid is 1 of 12 codes that meet the diagnostic criteria for FAS.3 B) FASD 4-Digit Code FAS facial phenotype (view image). The Rank 4 FAS facial phenotype determined with the 4-Digit Diagnostic Code requires the presence of all 3 of the following anomalies: (1) palpebral fissure length 2 or more standard deviations below the norm; (2) smooth philtrum (Rank 4 or 5 on the Lip-Philtrum Guide), an (3) thin upper lip (Rank 4 or 5 on the Lip-Philtrum Guide). Examples of the full Rank 4 FAS facial phenotype for Caucasian, Native American, African American and Asian American children are shown.
The magnitude of expression of each feature is ranked independently on a 4-point Likert scale, with 1 reflecting complete absence of the FASD feature and 4 reflecting a strong “classic” presence of the FASD feature. Each Likert rank is specifically case defined. There are 256 possible 4-digit diagnostic codes, ranging from 1111 to 4444. Each 4-digit diagnostic code falls into 1 of 22 unique clinical diagnostic categories (labeled A through V). Seven of the 22 diagnostic categories (4-Digit Categories A–C and E–H) fall broadly under the designation of FASD (A. FAS/Alcohol Exposed, B. FAS/Alcohol Exposure Unknown, C. Partial FAS/Alcohol Exposed, E-F. Static Encephalopathy/Alcohol Exposed, and G-H. Neurobehavioral Disorder/Alcohol Exposed). The three FASD study groups in this neuroimaging study represent these FASD diagnostic categories. This diagnostic system is currently being used by a wide variety of diagnostic teams in the USA and other countries.
The control population for this study was selected primarily from a large cohort of children enrolled at birth in a University of Washington study of typical development conducted through the Department of Speech and Hearing Sciences. This registry has been maintained over the years to serve as a source of healthy controls for studies throughout the University. With the enrollment of each child in the FAS/PFAS group, a child matched on age (within 6 months), gender, and race was randomly identified and invited to enroll from the eligible SE/AE, ND/AE and Control populations. The enrollment goal was 80 subjects (20 per group).
The study enrollment procedure produced a sample of 81 children of diverse ethnicity, though with 60% Caucasian (Table 1). The age range (8 to 15.9 years) included the broadest age range of children that could be administered a comparable psychometric assessment battery and be reasonably capable of participating in the MR scanning. Each of the four study groups had 16–24 subjects successfully balanced on age, gender, and race. The 61 children with FASD were highly representative of the entire clinic sample of 1,200 from which they were drawn.
TABLE 1.
Sociodemographic and 4-Digit Diagnostic Code profiles of the four study groups
| Characteristic | Groups | Statistics | |||||||||||
|---|---|---|---|---|---|---|---|---|---|---|---|---|---|
| 1. FAS/PFASAB |
2. SE/AE |
3. ND/AE |
4. Control |
ANOVA | Chi2 | ||||||||
| Overall | Post Hoc |
A Priori LT |
|||||||||||
| N= 20 | N= 24 | N = 21 | N = 16 | F (p)C | Duncan | F (p)D | Chi (p) | ||||||
| Gender: n (%) | |||||||||||||
| female | 10 | (50.0) | 8 | (33.3) | 10 | (47.6) | 8 | (50.0) | 1.7 (.63) | ||||
| Age at enrollment | |||||||||||||
| years: mean (SD) | 12.7 | (2.4) | 12.2 | (2.0) | 12.4 | (2.3) | 12.4 | (2.7) | 0.1 (.96) | 0.1 (.79) | |||
| Race: n (%) | |||||||||||||
| Caucasian | 12 | (60.0) | 11 | (45.8) | 12 | (57.1) | 13 | (81.3) | E 5.0 (.17) | ||||
| African American | 6 | (30.0) | 4 | (16.7) | 6 | (28.6) | 2 | (12.6) | |||||
| Native American | 2 | (10.0) | 7 | (29.2) | 2 | (9.5) | 0 | (0.0) | |||||
| Other | 0 | (0.0) | 2 | (8.3) | 1 | (4.8) | 1 | (6.3) | |||||
| Growth | |||||||||||||
| Growth Rank: 4-Digit Code: n (%) |
|||||||||||||
| 1 none | 10 | (50.0) | 15 | (62.5) | 13 | (61.8) | 15 | (93.7) | F 10.3 (.02) | ||||
| 2 mild | 2 | (10.0) | 2 | (8.3) | 6 | (28.6) | 1 | (6.3) | |||||
| 3 moderate | 5 | (25.0) | 3 | (12.5) | 1 | (4.8) | 0 | (0.0) | |||||
| 4 severe | 3 | (15.0) | 4 | (16.7) | 1 | (4.8) | 0 | (0.0) | |||||
| Current height percentile: mean (SD) |
33.5 | (31.6) | 40.7 | (30.4) | 34.7 | (30.9) | 60.6 | (34.2) | 2.7 (.05) | 132,24 | 5.2 (.03) | ||
| Current weight percentile: mean (SD) |
51.7 | (33.4) | 50.4 | (34.2) | 46.6 | (31.2) | 67.6 | (24.5) | 1.5 (.22) | 1.7 (.19) | |||
| Face | |||||||||||||
| Face Rank: 4-Digit Code: n (%)C |
|||||||||||||
| 1 none | 0 | (0.0) | 4 | (16.7) | 7 | (33.3) | 10 | (62.5) | |||||
| 2 mild | 0 | (0.0) | 20 | (83.3) | 14 | (66.7) | 6 | (37.5) | |||||
| 3 moderateG | 4 | (20.0) | 0 | (0.0) | 0 | (0.0) | 0 | (0.0) | |||||
| 4 severeH | 16 | (80.0) | 0 | (0.0) | 0 | (0.0) | 0 | (0.0) | |||||
| Facial D-ScoreI: mean (SD) | 1.2 | (0.9) | −0.4 | (0.9) | −0.8 | (0.7) | −1.5 | (0.9) | 31.6 (.000) | 1,23,4 | 84.4 (.000) | ||
| Mean R and L PFL z-score: mean (SD) |
−3.0 | (0.8) | −2.8 | (1.2) | −2.1 | (1.1) | −1.7 | (0.7) | 6.8 (.000) | 12,34 | 19.4 (.000) | ||
| Philtrum ABC-Score: n (%) | |||||||||||||
| A. Ranks 1–2: deep | 0 | (0) | 9 | (37) | 7 | (33) | 8 | (50) | 37 (.000) | ||||
| B. Rank 3: normal | 2 | (105) | 11 | (46) | 12 | (57) | 8 | (50) | |||||
| C. Ranks 4–5: smooth | 18 | (90) | 4 | (17) | 2 | (10) | 0 | (0) | |||||
| Lip ABC-Score: n(%) | |||||||||||||
| A. Ranks 1,2: thick | 0 | (0) | 15 | (63) | 13 | (62) | 7 | (44) | 52 (.000) | ||||
| B. Rank 3: normal | 2 | (10) | 7 | (29) | 7 | (33) | 7 | (44) | |||||
| C. Ranks 4,5: thin | 18 | (90) | 2 | (8) | 1 | (5) | 2 | (12) | |||||
| CNS | |||||||||||||
| CNS Ranks 1–3: 4-Digit Code | |||||||||||||
| Functional impairment level: n (%) |
|||||||||||||
| 1. none | 0 | (0.0) | 0 | (0.0) | 0 | (0.0) | 16 | (100) | |||||
| 2. moderate | 0 | (0.0) | J 3 | (12.5) | 21 | (100) | 0 | (0.0) | |||||
| 3. severe | 20 | (100) | 21 | (87.5) | 0 | (0.0) | 0 | (0.0) | |||||
| CNS Rank 4: 4-Digit Code | |||||||||||||
| Structural / Neurologic Abnormality Present: n (%) |
13 | (65.0) | 6 | (25.0) | 0 | (0.0) | 0 | (0.0) | K 31 (.000) | ||||
| Current OFC percentile: mean (SD) |
28.1 | (36.7) | 46.6 | (32.5) | 54.1 | (17.3) | 82.7 | (18.1) | 11.5 (.000) | 1,23,4 | 33.6 (.000) | ||
| Microcephaly (OFC ≤ - 2 SD): n (%) |
10 | (50.0) | 2 | (8.3) | 0 | (0.0) | 0 | (0.0) | L 26 (.000) | ||||
| Alcohol | |||||||||||||
| Alcohol Rank: 4-Digit Code: n (%) |
|||||||||||||
| 1. Noexposure | 0 | (0.0) | 0 | (0.0) | 0 | (0.0) | 16 | (100) | |||||
| 2. Unknown exposure | M1 | (5.0) | 0 | (0.0) | 0 | (0.0) | 0 | (0.0) | |||||
| 3. Confirmed exposure: Level moderate or unk. |
7 | (35.0) | 12 | (50.0) | 11 | (52.4) | 0 | (0.0) | |||||
| 4 Confirmed exposure: Level high |
12 | (60.0) | 12 | (50.0) | 10 | (47.6) | 0 | (0.0) | |||||
| Alcohol use beforepregnancy | |||||||||||||
| Days/week: mean (SD), range |
5.4 (1.7) | 2–7 | 4.0 (2.2) | 1–7 | 5.3 (2.1) | 1–7 | 0.9 (1.0) | 0–3 | 19.8 (.000) | 123,4 | 31.0 (.000) | ||
| Most drinks/occasion: mean (SD), range |
23.1 (24.8) | 8–78 | 19.8 (26.3) | 2–496 | 12.7 (7.7) | 4–24 | 1.7 (1.5) | 0–5 | 3.8 (.018) | 123,4 | 8.7 (.005) | ||
| Alcohol use during pregnancy | |||||||||||||
| Days/week: mean (SD), range |
5.5 (1.7) | 3–7 | 3.9 (2.1) | 1–7 | 5.3 (2.1) | 1–7 | 0 (0) | 0–0 | 35.9 (.000) | 123,4 | 35.8 (.000) | ||
| Most drinks/occasion: mean (SD), range |
11.6 (7.1) | 5–24 | 14.1 (8.9) | 3–26 | 11.7 (7.3) | 4–24 | 0 (0) | 0–0 | 14.2 (.000) | 123,4 | 17.8 (.000) | ||
| Drank all 3 trimesters: n (valid %) |
13 | (77) | 13 | (59) | 7 | (50) | 0 | (0) | 21 (.000) | ||||
| Diagnosis | |||||||||||||
| 4 – Digit CodeN Code (n) | 1433 | (3) | 1134 | (3) | 1123 | (4) | 1111 | (5) | |||||
| 1434 | (3) | 1233 | (5) | 1124 | (2) | 1121 | (5) | ||||||
| 1443 | (1) | 1234 | (5) | 1223 | (3) | 1211 | (1) | ||||||
| 1444 | (3) | 1243 | (1) | 1224 | (4) | 1221 | (4) | ||||||
| 2444 | (2) | 1244 | (1) | 2124 | (1) | 2221 | (1) | ||||||
| 3343 | (1) | 2233 | (1) | 2223 | (2) | ||||||||
| 3344 | (2) | 2244 | (1) | 2224 | (3) | ||||||||
| 3443 | (1) | 3133 | (1) | 3223 | (1) | ||||||||
| 3444 | (1) | 3233 | (1) | 4223 | (1) | ||||||||
| 4343 | (1) | 3243 | (1) | ||||||||||
| 4432 | (1) | 4233 | (1) | ||||||||||
| 4444 | (1) | 4234 | (1) | ||||||||||
| 4243 | (1) | ||||||||||||
| 4244 | (1) | ||||||||||||
| Other Factors | |||||||||||||
| Current caregiver: birthparent n (%) | 3 | (15.0) | 3 | (12.5) | 3 | (14.2) | 15 | (93.8) | 39 (.000) | ||||
| Number of home placements: mean (SD) |
4.7 | (5.6) | 4.1 | (3.3) | 4.1 | (2.3) | 1.1 | (0.3) | 3.6 (.017) | 123,4 | 8.5 (.005) | ||
| Annual household income: ≤$50,000 USD n(%) |
10 | (50.0) | 7 | (29.2) | 6 | (28.6) | 1 | (6.3) | 8 (.042) | ||||
| Illicit drug use in pregnancy: n (%) |
11 | (55.0) | 14 | (58.3) | 14 | (66.7) | 0 | (0.0) | 19 (.000) | ||||
| Cigarette use in pregnancy: n (%) |
14 | (70.0) | 20 | (83.3) | 14 | (66.7) | 0 | (0.0) | 31 (.000) | ||||
Abbreviations: Chi2: chi-square test across the four study groups, unless otherwise specified. Duncan: The Duncan multiple comparison range test is reported if the overall ANOVA is statistically significant; commas separate groups with homogeneous means at p < 0.05. F: F statistic. FAS/PFAS: FAS/partial FAS. L: left. LT: ANOVA unweighted linear trend. ND/AE: Neurodevelopmental Disorder/Alcohol Exposed. OFC: occipital frontal circumference. Overall: Overall assessment of between-group means using ANOVA. p: p-value. PFL: palpebral fissure length. R: right. SD: standard deviation. SE/AE: Static Encephalopathy/Alcohol Exposed. Unk: unknown. Z-score: number of standard deviations above/below the population-based mean. $: United States dollars.
Notations: A. Six of the 20 subjects in the FAS/PFAS group had full FAS using the 4-Digit Code. Ten of the 14 PFAS had Rank 4 Faces, but received a diagnosis of PFAS because they had no growth deficiency (Growth Rank 1). B. Two subjects had agenesis (PFAS) or hypogenesis (FAS) of the corpus callosum. C. Between groups degrees of freedom = 3; within groups df = total sample size minus 4. D. Between groups linear term degrees of freedom = 1; within groups df = total sample size minus 4. E. Caucasian versus not Caucasian. F. No growth deficiency versus mild to severe growth deficiency. G. All 4 subjects with Rank 3 faces had palpebral fissure lengths more than 2 SDs below the norm. The philtrum-lip Ranks for each subject were 3–4, 3–4, 5–3, and 4–3. H. Definition of Rank 4 FAS Face: palpebral fissure lengths 2 or more SDs below the norm, and lip and philtrum are Rank 4 or 5 on Lip-Philtrum Guide3. I. No child had hypo-or hypertelorism that could impact the validity of the D-score. J. All 3 children with moderate functional impairment had structural evidence of brain abnormality (microcephaly). K. Chi-square for FAS/PFAS versus SE/AE (7.1, p = .008). L. Chi-square for FAS/PFAS versus SE/AE (9.6, p = .002). M. The one child with unknown prenatal alcohol exposure had full FAS. N. The 4 digits represent the rank for growth, face, brain and alcohol, in that order3.
The diagnostic features specific to each group were as follows:
Children in Group 1 had a 4-Digit diagnosis of FAS or Partial FAS (FAS/PFAS) (e.g., 4-Digit Diagnostic Categories A,B,C: with Growth Ranks 1–4, Face Ranks 3–4, CNS Ranks 3 and/or 4, Alcohol Ranks 2–4) (Figure 1). Alcohol Rank 2 (unknown exposure) could only be present if the child had a diagnosis of full FAS because the Rank 4 FAS facial features are so specific to prenatal alcohol exposure.8,34 Since the only clinical difference between FAS and PFAS in this study was the presence of growth deficiency in the former, the two groups were combined. In summary, children in Group 1 had severe cognitive/behavioral dysfunction and the FAS facial phenotype.
Children in Group 2 had a 4-Digit diagnosis of Static Encephalopathy / Alcohol Exposed (SE/AE) (e.g., 4-Digit Diagnostic Categories E,F: with Growth Ranks 1–4, Face Ranks 1–2, CNS Ranks 3 and/or 4, Alcohol Ranks 3–4). In summary, children in Group 2 had severe cognitive/behavioral dysfunction, comparable to Group 1, but did not have the FAS facial phenotype.
Children in Group 3 had a 4-Digit diagnosis of Neurobehavioral Disorder / Alcohol Exposed (ND/AE) (e.g. 4-Digit Diagnostic Categories G, H: with Growth Ranks 1–4, Face Ranks 1–2, CNS Rank 2, Alcohol Ranks 3–4). In summary, children in Group 3 had prenatal alcohol exposure comparable to Groups 1 and 2, but in comparison to Groups 1 and 2 had only mild to moderate cognitive/behavioral dysfunction, and did not have the FAS facial phenotype.
Children in Group 4 (Healthy Controls / No Alcohol Exposure) were selected based on parental report that the child was healthy, had no academic concerns, and no prenatal alcohol exposure (e.g., 4-Digit Diagnostic Category V: with Growth Ranks 1–2, FAS Face Ranks (no restrictions), CNS Rank 1, Alcohol Rank 1). In summary, these were non-exposed, healthy, average to high-functioning controls.
Using the FASD terminology introduced by the Stratton et al11, the SE/AE group most closely reflects ‘severe ARND’ and the ND/AE group most closely reflects ‘mild ARND’.
Study Participation
Participation in the study involved five visits over a 4 to 6 week study period. The neuropsychological and sociodemographic data were collected during visits 1 and 2. The neuroimaging data were collected during visits 3 and 4. The outcomes of the neuropsychological assessments were shared with the caregivers on visit 5, and submitted to the child’s medical record with caregiver consent.
Sociodemographic and Clinical Assessment
A comprehensive sociodemographic and health/medication history of each child was obtained by parent interview and record review. Information included birth data, growth, and all prenatal and lifetime exposures and adverse events. For subjects with FASD, most information was obtained at the time of their FASD diagnostic evaluation. The following measures of maternal alcohol consumption were collected retrospectively, with a focus on two time points (just before pregnancy and during pregnancy): a) average and maximum number of drinks per drinking occasion, b) average number of drinking days per week, c) type of alcohol consumed (beer, wine, liquor), and d) trimester(s) during which drinking occurred. Although presence or absence of prenatal alcohol exposure was reliably documented for all subjects; more detailed information such as quantity, frequency, and duration of use was only available on 53 of the 65 alcohol-exposed subjects. This is not atypical, as accurate, detailed alcohol histories are frequently unavailable on patients presenting to a FASD diagnostic clinic. All controls had a reported absence of prenatal alcohol exposure per birth mother report.
All children had a standardized digital facial photograph taken at the time of enrollment. The facial photographs were analyzed using the FAS Facial Analysis Software35 to generate two measures of the magnitude of expression of the FAS facial phenotype: 1) the ordinal 4-Digit Code Facial Rank (1 to 4) and 2) the continuous FAS facial D-score.7 The D-score documents the severity of the FAS facial phenotype on a continuous scale. The higher the D-score, the more FAS-like the facial features. A D-score ≥ 0.8 is equivalent to a Rank 4 FAS facial phenotype.7
Neuropsychological / Psychiatric Assessments
A comprehensive, standardized assessment battery was administered to each child and their primary caregiver by a psychologist masked to group assignment (Table 2). Based on an extensive review of the prior literature, the assessment battery was designed to capture the domains of potential neuropsychological deficit seen as the result of the typically diffuse brain damage arising from alcohol teratogenesis.5,6,23,36–39
TABLE 2.
Assessment battery administered to the four study groups
| Soft Neurological Signs |
| Quick Neurological Screening Test II (QNST-II)52 |
| General Intellectual Function |
| Wechsler Intelligence Scale for Children-Third Edition (WISC-III)54 |
| Academic Achievement |
| Wechsler Individual Achievement Test (WIAT) Basic Reading subtest54 |
| KeyMath Revised/NU: A Diagnostic Inventory of Essential Mathematics55 |
| Visuospatial Skills, Visual Memory, and Organization |
| Beery Buktenica Developmental Test of Visual-Motor Integration (VMI)56 |
| Rey Complex Figure Test (RCFT)57 |
| Executive Function |
| Delis-Kaplan Executive Function System (D-KEFS) Trail Making Test58 |
| Delis-Kaplan Executive Function System (D-KEFS) Tower Test58 |
| Delis-Kaplan Executive Function System (D-KEFS) Color-Word Interference Test58 |
| Delis-Kaplan Executive Function System (D-KEFS) Verbal Fluency Test: Standard Form58 |
| Wisconsin Card Sorting Test: Computer Version 3 (WCST) Research Edition59 |
| Verbal Memory |
| California Verbal Learning Test-Children’s Version (CVLT-C)60 |
| Attention |
| Integrated Visual and Auditory Continuous Performance Test (IVA CPT)61 |
| Receptive and Expressive Language |
| Test of Language Development-Intermediate: Third Edition (TOLD-I:3) • Sentence Combining subtest (subjects aged 8 to 10 years) |
| Test of Language Competence-Expanded Edition (TLC- 1-Expanded) Level 1 • Oral Expression: Recreating Speech Arts subtest (subjects aged 8 to 9 years) |
| Test of Language Competence-Expanded Edition (TLC-2-Expanded) Level 263 • Oral Expression: Recreating Sentences subtest (subjects aged 10 to 15.9 years) |
| Test of Word Knowledge (TOWK)64 • Conjunctions and Transition Words subtest (subjects aged 11 to 15.9 years) |
| Adaptive Behavior |
| Vineland Adaptive Behavior Scales (VABS) Interview Edition, Survey Form65 |
| Behavior Problems and Social Competence |
| Child Behavior Checklist for Ages 6–18 (CBCL/6–18)66 |
| Caregiver Report of Behaviors Related to Executive Function |
| Behavior Rating Inventory of Executive Function (BRIEF)67 |
| Psychiatric Conditions |
| Computerized Diagnostic Interview Schedule for Children: Parent Form (C-DISC)68 |
Magnetic Resonance Evaluation
The MRI, MRS, and fMRI components of this study are reported separately.1,2 Briefly, all scans were acquired using a General Electric 1.5 Tesla scanner in the Diagnostic Imaging Sciences Center (DISC) at the University of Washington. MRI was used to measure the size of the following structures: total brain, frontal lobe, caudate, hippocampus, putamen; corpus callosum, and cerebellar vermis.
MRS1 was used to measure the concentrations of neurometabolites including:
choline, a marker of cell membrane stability and myelination,
N-acetyl aspartate, a neuronal or axonal marker, and
creatine, a marker of metabolic activity;
in three brain regions (frontal/parietal white matter, hippocampus, and an axial slice at the level of the thalamus).
fMRI2 was used to assess neuroactivation in seven brain regions (anterior cingulate; anterior and posterior parietal lobe; and the dorsolateral prefrontal, inferior frontal, middle frontal, and precentral regions of the frontal lobe) during performance of N-back working memory tasks. A brief summary of findings from the MRI, MRS and fMRI portions of the study is presented in the Discussion section, with citations for readers interested in further detail.
Predicted FASD Subgroup Contrasts
The following clinical distinctions should exist between the subgroups enrolled in this study based on: 1) the use of the FASD 4-Digit Code3 to classify each alcohol-exposed child into one of three FASD clinical subgroups (FAS/PFAS, SE/AE, and ND/AE), and 2) prior studies assessing the performance of the 4-Digit Code.7,31
Growth: The FAS/PFAS group should have the highest prevalence of growth deficiency.
Face: The magnitude of expression of the FAS facial phenotype should be greatest in the FAS/PFAS group, but will also increase linearly as one progresses from Controls to FAS/PFAS.
CNS: Structural Abnormality. Head circumference should be smallest in the FAS/PFAS group, but will also decrease linearly as one progresses from the Control group to the FAS/PFAS group.
CNS: Magnitude of Neuropsychological Impairment. The FAS/PFAS and SE/AE groups should be comparably impaired, and significantly more impaired than the ND/AE and Control groups. The ND/AE group should be significantly less impaired than the FAS/PFAS and SE/AE groups and significantly more impaired than the Control group.
It is important to point out that the 4-Digit Code criteria used to rank brain dysfunction (CNS Rank 1: no dysfunction; Rank 2: moderate dysfunction; Rank 3: severe dysfunction) focus strictly on magnitude of dysfunction, not pattern of dysfunction. For example, a Rank 3 classification is defined by the presence of three or more domains of brain function, two or more standard deviations below the population mean. The diagnostic criteria do not specify which domains of function must be impaired. It is also important to note that the diagnostic criteria for FAS/PFAS, SE/AE, and ND/AE do not specify how much prenatal alcohol exposure must be reported. This follows a basic epidemiologic tenet; exposures and outcomes should be documented independently to validly assess the relationship(s) between the two. Thus the pattern of neuropsychological dysfunction and level of prenatal alcohol exposure will vary independent of the diagnostic criteria imposed on the FASD subgroups.
Statistical Analyses
Descriptive statistics (means, SDs, proportions) were used to summarize the sociodemographic and clinical profiles of the four study groups (Tables 1, 3, 4). For comparisons between groups, chi-square was used for categorical variables and ANOVA was used for continuous variables. When ANOVA was employed, the overall f- statistic was used to test if differences existed among the four group means. When the overall f-statistic was statistically significant, the Duncan post hoc range test was used to identify which group means differed. The Duncan test makes pairwise comparisons using a stepwise procedure. Means are ordered from highest to lowest, and extreme differences are tested first. The Duncan test sets a protection level for the error rate for the collection of tests. The Duncan test identifies homogeneous subsets of means that are not different from one another. An a priori test for linear trend was included in the ANOVA to determine if performance on the neuropsychological assessments (mean standardized score) became increasingly more impaired progressing across the four study groups from Control, to ND/AE, to SE/AE, to FAS/PFAS. This trend would be anticipated based on the 4-Digit Code diagnostic criteria. Two-tailed p-values of 0.05 were used throughout the analyses. Due to multiple comparison, p-values should be interpreted accordingly.40,41 This study had 80% power or greater to detect the following effect sizes at a two-tailed alpha level of 0.05; 1) A difference in means equal to or greater than the standard deviation of the mean difference; 2) A 35-point or greater difference in proportions between two groups.
TABLE 3.
Neuropsychological behavioral and psychiatric outcomes across the four study groups
| Functional Domain Psychological Test |
Groups | Statistics | |||||||||||||
|---|---|---|---|---|---|---|---|---|---|---|---|---|---|---|---|
| 1. FAS/PFAS |
2. SE/AE |
3. ND/AE |
4. Control |
ANOVA | |||||||||||
| N = 20 | N = 24 | N = 21 | N= 16 | Overall | Post Hoc | A Priori LT | |||||||||
| N | Mean | (SD) | N | Mean | (SD) | N | Mean | (SD) | N | Mean | (SD) | F (p)A | DuncanB | F (p)C | |
| Soft Neurologic Signs | |||||||||||||||
| QNST-II: Total Score (raw) | 20 | 32.4 | (17.5) | 24 | 28.5 | (9.9) | 21 | 21.7 | (11.0) | 16 | 11.8 | (6.3) | 10.1 (.000) | 12,23,4 | 29.6 (.000) |
| General Intellectual Function | |||||||||||||||
| WISC III Full Scale IQ (ss) | 20 | 77.5 | (14.4) | 24 | 79.3 | (10.5) | 21 | 99.2 | (11.3) | 16 | 123.9 | (6.5) | 67.6 (.000) | 12,3,4 | 183.4 (.000) |
| WISC III Verbal IQ (ss) | 20 | 76.0 | (12.1) | 24 | 78.8 | (12.5) | 21 | 96.3 | (12.5) | 16 | 120.8 | (10.1) | 53.2 (.000) | 12,3,4 | 146.2 (.000) |
| WISC III Performance IQ (ss) | 20 | 82.8 | (16.6) | 24 | 82.6 | (11.3) | 21 | 103.0 | (11.7) | 16 | 122.9 | (7.3) | 45.0 (.000) | 12,3,4 | 118.9 (.000) |
| WISC III Freedom from Distractibility (ss) |
20 | 78.9 | (17.1) | 24 | 79.0 | (10.1) | 21 | 92.9 | (11.3) | 16 | 120.9 | (12.7) | 41.3 (.000) | 12,3,4 | 106.0 (.000) |
| WISC III Processing Speed (ss) | 20 | 85.1 | (13.9) | 24 | 82.9 | (13.5) | 21 | 101.0 | (14.6) | 16 | 117.1 | (10.0) | 26.5 (.000) | 12,3,4 | 66.9 (.000) |
| Academic Achievement | |||||||||||||||
| WIAT Basic Reading (ss) | 20 | 86.5 | (15.8) | 24 | 83.8 | (14.9) | 21 | 102.4 | (14.9) | 16 | 115.8 | (8.3) | 20.9 (.000) | 12,3,4 | 51.9 (.000) |
| KeyMath Total (ss) | 20 | 78.3 | (14.6) | 24 | 78.7 | (9.5) | 21 | 96.7 | (11.3) | 16 | 118.4 | (11.7) | 51.9 (.000) | 12,3,4 | 125.0 (.000) |
|
Visuospatial Skills, Visual Memory, Organization |
|||||||||||||||
| VMI: Total (ss) | 18 | 76.2 | (12.7) | 24 | 81.4 | (9.2) | 20 | 90.9 | (11.8) | 16 | 102.7 | (12.9) | 17.8 (.000) | 12,3,4 | 51.6 (.000) |
| RCFT: Copy (raw)D | 20 | 17.4 | (7.7) | 24 | 20.5 | (7.9) | 21 | 25.6 | (7.4) | 16 | 31.8 | (4.1) | 14.3 (.000) | 12,3,4 | 42.3 (.000) |
| RCFT: Immediate Recall (T) | 20 | 30.1 | (10.3) | 22 | 28.7 | (10.4) | 21 | 40.7 | (10.2) | 16 | 49.8 | (13.9) | 14.5 (.000) | 12,3,4 | 37.0 (.000) |
| RCFT: Delayed Recall (T) | 20 | 28.9 | (9.4) | 21 | 29.5 | (9.7) | 21 | 38.2 | (11.0) | 16 | 53.2 | (11.6) | 20.8 (.000) | 12,3,4 | 55.9 (.000) |
| Executive Function | |||||||||||||||
| D-KEFS: Trails, Number/Letter Switch Complete Time (ss) |
20 | 5.3 | (3.9) | 24 | 5.3 | (3.4) | 21 | 9.7 | (2.7) | 16 | 12.8 | (1.7) | 26.1 (.000) | 12,3,4 | 68.5 (.000) |
| D-KEFS: Tower, Total Achievement (scaled) |
20 | 7.6 | (2.3) | 24 | 8.3 | (2.5) | 21 | 9.6 | (2.1) | 16 | 10.8 | (2.1) | 7.0 (.000) | 12,23,34 | 20.5 (.000) |
| D-KEFS: Tower, Total Rule Violation (Cumulative %tile Rank) |
20 | 20.1 | (23.4) | 24 | 28.8 | (28.8) | 21 | 68.8 | (33.8) | 16 | 85.9 | (23.3) | 23.9 (.000) | 12,34 | 65.1 (.000) |
| D-KEFS: Color Word Inhibit/Switch Completion Time (scaled) | 20 | 6.4 | (4.0) | 23 | 6.6 | (3.5) | 21 | 9.3 | (2.5) | 16 | 10.6 | (2.1) | 8.1 (.000) | 12,34 | 21.4 (.000) |
| D-KEFS: Verbal Fluency Conds1–3% Switch Accuracy (scaled) | 20 | 8.9 | (3.6) | 24 | 8.8 | (4.0) | 21 | 10.8 | (1.5) | 16 | 11.1 | (1.3) | 3.4 (.02) | 12,34 | 7.8 (.007) |
| WCST: Total Errors (ss) | 18 | 91.2 | (17.0) | 24 | 90.0 | (15.7) | 21 | 107.7 | (14.2) | 16 | 112.8 | (15.7) | 10.4 (.000) | 12,34 | 24.1 (.000) |
| Verbal Memory | |||||||||||||||
| CVLT-C: List A, Total Trials # Correct (T) |
20 | 38.6 | (13.1) | 24 | 38.8 | (9.8) | 21 | 50.1 | (11.4) | 16 | 61.2 | (6.5) | 18.9 (.000) | 12,3,4 | 50.5 (.000) |
| CVLT-C: List A, Trial 1, Free Recall (T) |
20 | −0.9 | (1.1) | 24 | −0.9 | (0.8) | 21 | −0.1 | (1.1) | 16 | 0.8 | (1.6) | 8.2 (.000) | 123,4 | 21.7 (.000) |
| Attention | |||||||||||||||
| IVA: Full Response Control Quotient (ss) |
20 | 57.7 | (19.4) | 23 | 69.5 | (20.9) | 21 | 82.9 | (25.1) | 16 | 96.0 | (16.8) | 11.3 (.000) | 12,23,34 | 33.7 (.000) |
|
Receptive and Expressive Language |
|||||||||||||||
| TOLD-1:3: Sentence Combining: 8–10 yrs (ss) | 6 | 7.5 | (2.4) | 6 | 5.5 | (1.0) | 7 | 11.0 | (3.4) | 5 | 16.0 | (2.5) | 17.9 (.000) | 12,34 | 41.3 (.000) |
| TLC-1: Recreating Speech Acts: 8–9 yrs (ss) | 3 | 6.0 | (3.5) | 6 | 5.7 | (1.9) | 5 | 10.4 | (3.8) | 5 | 12.2 | (2.3) | 6.4 (.000) | 213,34 | 13.2 (.002) |
| TOWK: Conjunctions & Transitions: 11–15 yrs (ss) |
14 | 4.5 | (1.7) | 18 | 5.9 | (3.8) | 14 | 8.6 | (2.6) | 11 | 13.1 | (1.6) | 23.2 (.000) | 12,3,4 | 66.6 (.000) |
| TLC-2: Recreating Sentences: 10–15 yrs (ss) | 17 | 4.8 | (2.0) | 18 | 4.9 | (1.9) | 16 | 7.0 | (1.5) | 11 | 10.4 | (1.3) | 28.4 (.000) | 12,3,4 | 78.8 (.000) |
| Adaptive Behavior | |||||||||||||||
| VABS: Adaptive Behav. Composite (ss) |
20 | 59.0 | (17.5) | 24 | 55.0 | (14.2) | 19 | 65.4 | (21.1) | 16 | 95.3 | (12.3) | 21.1 (.000) | 123,4 | 46.3 (.000) |
| VABS: Socialization (ss) | 20 | 67.0 | (18.5) | 24 | 64.3 | (17.8) | 20 | 71.6 | (22.1) | 16 | 100.8 | (13.7) | 14.5 (.000) | 123,4 | 31.4 (.000) |
|
Behavioral Problems and Social Competence |
|||||||||||||||
| CBCL: Internalizing Problems (T) | 20 | 63.9 | (9.9) | 24 | 60.6 | (10.1) | 21 | 60.2 | (12.7) | 16 | 44.6 | (7.6) | 11.9 (.000) | 123,4 | 28.8 (.000) |
| CBCL: Externalizing Problems (T) | 20 | 65.2 | (10.6) | 24 | 64.4 | (11.8) | 21 | 65.0 | (12.1) | 16 | 47.1 | (10.4) | 10.6 (.000) | 123,4 | 20.6 (.000) |
| CBCL: Social Problems (T) | 20 | 66.0 | (8.8) | 24 | 66.8 | (8.6) | 21 | 66.9 | (12.7) | 16 | 52.3 | (4.6) | 10.1 (.000) | 123,4 | 17.6 (.000) |
| CBCL: Attention Problems (T) | 20 | 70.8 | (11.2) | 24 | 71.5 | (10.3) | 21 | 74.0 | (15.7) | 16 | 51.2 | (1.9) | 15.0 (.000) | 123,4 | 22.5 (.000) |
| CBCL: Total Competence (T) | 20 | 38.4 | (7.8) | 24 | 33.7 | (7.2) | 21 | 40.5 | (9.7) | 16 | 54.3 | (9.2) | 19.7 (.000) | 21,13,4 | 37.8 (.000) |
|
Caregiver Report of Behavior Related to Executive Function |
|||||||||||||||
| BRIEF: General Executive Composite (T) |
20 | 73.2 | (10.7) | 24 | 73.0 | (9.2) | 21 | 72.0 | (16.9) | 16 | 44.2 | (7.0) | 25.5 (.000) | 123,4 | 51.1 (.000) |
| BRIEF: Behavioral Regulation Index (T) |
20 | 73.1 | (13.2) | 24 | 70.1 | (13.4) | 21 | 68.9 | (17.1) | 16 | 43.9 | (8.0) | 16.9 (.000) | 123,4 | 38.8 (.000) |
| BRIEF: Metacognition Index (T) | 20 | 70.8 | (9.4) | 24 | 72.2 | (8.2) | 21 | 71.8 | (16.0) | 16 | 44.9 | (7.1) | 25.8 (.000) | 123,4 | 46.6 (.000) |
|
Selected Psychiatric Conditions from the C-DISC |
N | (Valid %) | N | (Valid %) | N | (Valid %) | N | (Valid %) | Chi2 (p) | ||||||
| Attention Deficit/Hyperactivity DisorderE |
12 | (63.2) | 17 | (70.8) | 14 | (66.7) | 0 | (0.0) | 23.5 (.000) | ||||||
| Oppositional Defiant DisorderF | 9 | (47.4) | 14 | (58.3) | 11 | (52.4) | 2 | (12.5) | 9.1 (.028) | ||||||
| Conduct DisorderG | 7 | (36.8) | 5 | (20.8) | 10 | (47.6) | 0 | (0.0) | 11.7 (.008) | ||||||
| Generalized Anxiety Disorder | 4 | (21.1) | 2 | (8.3) | 1 | (4.8) | 0 | (0.0) | 5.6 (.14) | ||||||
| Separation Anxiety Disorder | 3 | (15.8) | 2 | (8.3) | 3 | (14.3) | 0 | (0.0) | 3.0 (.39) | ||||||
| Obsessive Compulsive Disorder | 2 | (10.5) | 1 | (4.2) | 3 | (14.3) | 0 | (0.0) | 3.3 (.34) | ||||||
| Post Traumatic Stress Disorder | 2 | (10.5) | 1 | (4.2) | 0 | (0.0) | 0 | (0.0) | 3.9 (.28) | ||||||
| Social Phobia | 2 | (11.1) | 1 | (4.2) | 2 | (9.5) | 0 | (0.0) | 2.2 (.53) | ||||||
| Major Depression / Dysthymic Disorder | 1 | (5.3) | 2 | (8.3) | 1 | (4.8) | 0 | (0.0) | 3.0 (.40) | ||||||
| Mania / Hypomania | 1 | (5.3) | 0 | (0.0) | 0 | (0.0) | 0 | (0.0) | 3.3 (.35) | ||||||
| Schizophrenia | 1 | (5.3) | 0 | (0.0) | 0 | (0.0) | 0 | (0.0) | 3.3 (.35) | ||||||
| Panic Disorder | 0 | (0) | 0 | (0.0) | 1 | (4.8) | 0 | (0.0) | 2.9 (.41) | ||||||
Abbreviations: Chi2: chi-square test across the four study groups. BRIEF: Behavior Rating Inventory of Executive Function. CBCL: Child Behavior Checklist for Ages 6–18 (CBCL/6–18). CC: corpus callosum. C-DISC: Computerized Diagnostic Interview Schedule for Children (Parent). CV: cerebellar vermis. CVLT-C: California Verbal Learning Test-Children’s Version. D-KEFS: Delis-Kaplan Executive Function System. F: F statistic. IVA: Integrated Visual and Auditory Continuous Performance Test. LT: ANOVA a priori contrast, unweighted linear trend. p: p-value. QNST-II: Quick Neurological Screening Test-2nd Edition, Severe Discrepancy >50, Moderate Discrepancy 26–50, Normal Range 1–25. Raw: raw score. RCFT: Rey Complex Figure Test. SD: standard deviation. SS: standard score. Scaled: scaled score. T: T-score. TLC-1: Test of Language Competence-Expanded Edition Level 1 for 8–9 years. TLC-2: Test of Language Competence-Expanded Edition Level 2 for 10–15 years. TOLD-1:3: Test of Language Development-Intermediate: Third Edition for 8–10 years. TOWK: Test of Word Knowledge for 11–15 years. VABS: Vineland Adaptive Behavior Scales. VMI: Beery Buktenica Developmental Test of Visual-Motor Integration. WCST: Wisconsin Card Sorting Test: Computer Version 3. WIAT: Wechsler Individual Achievement Test. WISC III: Wechsler Intelligence Scale for Children-3rd Edition.
Notations: A. Numerator degrees of freedom = 3; denominator df = total sample size minus 4. B. The Duncan multiple comparison range test is reported if the overall ANOVA is statistically significant; commas separate groups with homogeneous means at p < 0.05. C. Numerator degrees of freedom = 1; denominator df = total sample size minus 4. D. Chi-square test for proportion of subjects with a RCFT Copy score≤ 5th percentile (FAS/PFAS n =17 (85.0%); SE/AE n=21 (87.5%), ND/AE n=10 (47.6%), Control n=0 (0%)): chi-square =37.8, p = .000. E. FASD versus Control: chi square 20.6, p = .000. F FASD versus Control: chi square 9.9, p = .002. G. FASD versus Control: Fisher exact, p = .004.
TABLE 4.
Proportion of subjects within each study group with neuropsychological and behavioral scores two or more standard deviations below the population mean
| Functional Domain Psychological TestA | FAS/PFAS | SE/AE | ND/AE | Control | ||||
|---|---|---|---|---|---|---|---|---|
| N= 20 | N= 24 | N =21 | N= 16 | |||||
| N | (valid %) | N | (valid %) | N | (valid %) | N | (valid %) | |
| Soft Neurologic Signs | ||||||||
| QNST-II: Total Raw Score >= 50 | 4 | (20.0) | 1 | (4.2) | 0 | (0.0) | 0 | (0.0) |
| General Intellectual Function | ||||||||
| WISC III Full Scale IQ | 7 | (35.0) | 6 | (25.0) | 0 | (0.0) | 0 | (0.0) |
| WISC III Verbal IQ | 7 | (35.0) | 6 | (25.0) | 1 | (4.8) | 0 | (0.0) |
| WISC III Performance IQ | 4 | (20.0) | 3 | (12.5) | 0 | (0.0) | 0 | (0.0) |
| WISC III Freedom from Distractibility | 8 | (40.0) | 5 | (20.8) | 0 | (0.0) | 0 | (0.0) |
| WISC III Processing Speed | 3 | (15.0) | 6 | (25.0) | 0 | (0.0) | 0 | (0.0) |
| Academic Achievement | ||||||||
| WIAT Basic Reading | 1 | (5.0) | 5 | (20.9) | 1 | (4.8) | 0 | (0.0) |
| KeyMath Total | 4 | (20.0) | 3 | (12.5) | 0 | (0.0) | 0 | (0.0) |
| Visuospatial Skills, Visual Memory, Organization | ||||||||
| VMI: Total | 6 | (33.3) | 2 | (8.3) | 0 | (0.0) | 0 | (0.0) |
| RCFT: Copy <= 5% | 17 | (85.0) | 21 | (87.5) | 10 | (47.6) | 0 | (0.0) |
| RCFT: Immediate Recall | 10 | (50.0) | 14 | (58.3) | 3 | (14.3) | 2 | (12.5) |
| RCFT: Delayed Recall | 11 | (55.0) | 13 | (54.2) | 6 | (28.6) | 0 | (0.0) |
| Executive Function | ||||||||
| D-KEFS: Trails, Number/Letter Switch Complete Time | 10 | (50.0) | 10 | (41.7) | 1 | (4.8) | 0 | (0.0) |
| D-KEFS: Tower, Total Achievement) | 0 | (0.0) | 1 | (4.2) | 0 | (0.0) | 0 | (0.0) |
| D-KEFS: Tower, Total Rule Violation | 5 | (25.0) | 5 | (20.8) | 0 | (0.0) | 0 | (0.0) |
| D-KEFS: Color Word Inhibit/Switch Completion Time | 5 | (25.0) | 7 | (29.2) | 0 | (0.0) | 0 | (0.0) |
| D-KEFS: Verbal Fluency Conds1–3 % Switch Accuracy | 2 | (10.0) | 4 | (16.7) | 0 | (0.0) | 0 | (0.0) |
| WCST: Total Errors | 4 | (20.0) | 2 | (8.3) | 0 | (0.0) | 0 | (0.0) |
| Verbal Memory | ||||||||
| CVLT-C: List A, Total Trials # Correct | 10 | (50.0) | 15 | (62.5) | 3 | (14.3) | 0 | (0.0) |
| CVLT-C: List A, Trial 1, Free Recall | 5 | (25.0) | 3 | (12.5) | 1 | (4.8) | 0 | (0.0) |
| Attention | ||||||||
| IVA: Full Response Control Quotient | 15 | (75.0) | 13 | (54.2) | 6 | (28.6) | 2 | (12.5) |
| Receptive and Expressive Language | ||||||||
| TOLD-1:3: Sentence Combining: 8–10 yrs | 0 | (0.0) | 0 | (0.0) | 0 | (0.0) | 0 | (0.0) |
| TLC-1: Recreating Speech Acts: 8–9 yrs | 0 | (0.0) | 1 | (4.2) | 0 | (0.0) | 0 | (0.0) |
| TOWK: Conjunctions & Transitions: 11–15 yrs | 6 | (42.9) | 7 | (38.9) | 1 | (7.1) | 0 | (0.0) |
| TLC-2: Recreating Sentences: 10–15 yrs | 5 | (27.8) | 6 | (33.3) | 0 | (0.0) | 0 | (0.0) |
| Adaptive Behavior | ||||||||
| VABS: Adaptive Behav. Composite | 15 | (75.0) | 20 | (83.3) | 14 | (66.7) | 1 | (6.3) |
| VABS: Socialization | 13 | (65.0) | 15 | (62.5) | 12 | (60.0) | 1 | (6.3) |
|
Behavioral Problems and Social Competence (in clinical range) |
||||||||
| CBCL: Internalizing Problems | 12 | (60.0) | 11 | (45.8) | 8 | (38.1) | 0 | (0.0) |
| CBCL: Externalizing Problems | 13 | (65.0) | 12 | (50.0) | 13 | (61.9) | 1 | (6.3) |
| CBCL: Social Problems | 4 | (20.0) | 3 | (12.5) | 5 | (23.8) | 0 | (0.0) |
| CBCL: Attention Problems | 10 | (50.0) | 9 | (37.5) | 11 | (52.4) | 0 | (0.0) |
| CBCL: Total Competence | 8 | (40.0) | 16 | (66.7) | 9 | (42.9) | 0 | (0.0) |
|
Caregiver Report of Behavior Related to Executive Function |
||||||||
| BRIEF: General Executive Composite | 17 | (85.0) | 22 | (91.7) | 16 | (76.2) | 0 | (0.0) |
| BRIEF: Behavioral Regulation Index | 16 | (80.0) | 18 | (75.0) | 15 | (71.4) | 1 | (6.3) |
| BRIEF: Metacognition Index | 18 | (90.0) | 23 | (95.8) | 16 | (76.2) | 0 | (0.0) |
Abbreviations: FAS/PFAS: fetal alcohol syndrome/partial FAS. ND/AE: neurodevelopmental disorder/alcohol exposed. SE/AE: static encephalopathy/alcohol exposed.
Notations: A. See Table 2 for definition of psychological tests.
RESULTS
The 4-Digit Code produced four clinically and statistically distinct study groups. The three FASD clinical subgroups reflect a linear continuum of increasing neuropsychological deficit and physical abnormality (e.g., growth deficiency and FAS facial features) across the full continuum of FASD (Tables 1, 3, and 4). All three FASD subgroups had comparably high levels of prenatal alcohol exposure.
Group Differences in Key FASD Diagnostic Features (growth, face, CNS, alcohol)
Growth
The prevalence and severity of growth deficiency generally increased as one advanced across the four study groups from Controls to FAS/PFAS (Table 1). Height was more impaired than weight.
Face
The FASD Facial D-Score revealed that the magnitude of the FAS facial phenotype increased linearly across the four study groups demonstrating that the FAS facial phenotype is not simply present or absent (Table 1). This was further illustrated by the Duncan post hoc group comparisons. The magnitude of expression of the FAS facial phenotype was significantly highest among the FAS/PFAS group. The magnitude of expression was significantly lower in the SE/AE and ND/AE groups relative to the FAS/PFAS group, but significantly higher than the Control group. It is also interesting to note that although the 4-Digit Code criteria for the FAS facial phenotype requires the palpebral fissure length (PFL) to be 2 or more standard deviations below the population mean, the mean PFL for the FAS/PFAS group is 3 SD’s below the mean.
CNS
By design, all subjects in the control group were without evidence of central nervous system dysfunction (CNS Rank 1). However, all those in the ND/AE group had mild to moderate dysfunction (CNS Rank 2) and all subjects in the SE/AE and FAS/PFAS groups had evidence of severe CNS dysfunction / damage (CNS Ranks 3 and 4) (Table 1). Severe dysfunction (CNS Rank 3) is defined by the presence of three or more domains (e.g., cognition, executive function, language, memory, attention, etc.) of brain function, two or more standard deviations below the norm, as measured on standardized neuropsychological tests, administered and interpreted by professionals. A Rank 3 classification does NOT dictate which domains of function must be impaired. CNS Rank 4 signifies the presence of structural brain abnormalities or frank neurological abnormality as determined by a clinical neuroradiologist or neurologist. The CNS Rank 4 classifications in Table 1 reflect the Rank 4 classifications the children received at the time of their FASD diagnostic evaluation. They do not reflect the new findings from this neuroimaging study. Nineteen subjects with FASD (13 with FAS/PFAS and 6 with SE/AE) had a CNS Rank 4 classification at the time of their FASD diagnostic evaluation. These clinical abnormalities were known prior to their enrollment into the study. Of the 13 subjects with FAS/PFAS and CNS Rank 4: 11 had microcephaly, 1 had hypogenesis of the corpus callosum (HCC), and 1 had microcephaly, agenesis of the corpus callosum (ACC), and petit mal seizures. Of the 6 subjects with SE/AE and CNS Rank 4: 4 had microcephaly, 1 had a seizure disorder and 1 had an abnormal clinical MRI (heterotopias in the left temporal lobe as interpreted by a neuroradiologist).
Within our FASD participants, one subject with PFAS had agenesis of the corpus callosum (ACC) and one subject with FAS had hypogenesis of the corpus callosum (HCC). That these subjects had callosal abnormalities were known prior to study enrollment. Interestingly, these two subjects with ACC/HCC are the only documented cases of ACC/HCC in the 2,040 patients with prenatal alcohol exposure diagnosed to date at the WA State FAS DPN clinics. In a clinical database such as the FAS DPN, MRIs are typically only available when clinically indicated (e.g., evidence of neurological abnormalities). Therefore, only 204 (10%) of the 2,040 patients evaluated at the FAS DPN had a previous MRI evaluation summarized in their medical record and 76% of the 204 MRI evaluations were interpreted as normal by the patient’s neuroradiologist. Although ACC/HCC has been observed in individuals with FASD42, ACC/HCC is not specific to prenatal alcohol exposure. The prevalence of ACC among developmentally disabled populations is estimated to be 2–3 per 100.43 Thus, a causal link between ACC/HCC and prenatal alcohol exposure in these two individuals should not be assumed; nor can it be ruled-out.
Alcohol
Of the 65 alcohol-exposed subjects, 64 had confirmed prenatal alcohol exposure and one with full FAS had an unknown exposure (Table 1). All controls had reported absence of prenatal alcohol exposure by birth mother report. More detailed information on quantity, frequency, and/or trimester of alcohol use was available on 53 of the 65 alcohol-exposed subjects. Reported exposure ranged from 1 to 26 drinks per drinking occasion, 1 to 7 days per week, first trimester only to all three trimesters. The mean number of days per week of drinking during pregnancy (4 to 5 days), and the maximum number of drinks per drinking occasion during pregnancy (12 to 14 drinks) were statistically comparable across the three alcohol-exposed groups (Table 1). A significantly higher proportion of subjects reported drinking all three trimesters as one advanced from the Controls to ND/AE to SE/AE to FAS/PFAS.
Maternal use of illicit drugs during pregnancy was reportedly present in 45%, 58%, 67%, and 0% of the FAS/PFAS, SE/AE, ND/AE and Control groups respectively. Use of illicit drugs was not an exclusion criteria for enrollment into this study because of its very high co-occurrence with prenatal alcohol exposure. Over 70% of the Washington State FAS DPN diagnostic clinic population has documented prenatal exposure to illicit drugs. The three FASD groups were also significantly more likely than the Control group to have other risk factors, in addition to prenatal alcohol exposure, that could adversely impact their growth and development (Table 1).
Group Differences in Neuropsychological, Behavioral and Psychiatric Outcomes
Key neuropsychological, behavioral, and psychiatric outcomes across the four study groups are presented in Tables 3 and 4. Table 3 presents mean scores on each measure for each group, reported as standard scores (or scaling appropriate for the instrument; e.g., T-scores on the CVLT-C). Table 4 presents the proportion of subjects within each group who performed in the impaired range on each measure. The “impaired range” was defined as 2 or more standard deviations below the age-appropriate population mean.
Group Mean Differences
Performance did not vary significantly with age, gender, or race. Inclusion of these covariates in between-group analyses confirmed they did not modify the outcomes. Mean performance on all assessments decreased significantly and incrementally as one advanced across the four groups from Controls, to ND/AE, to SE/AE, to FAS/PFAS (Table 3). As anticipated given the diagnostic criteria, multiple comparison tests confirmed that neuropsychological performance among the FAS/PFAS and SE/AE groups was comparably impaired—but significantly more impaired than the ND/AE and Control groups. The ND/AE group was almost always significantly less impaired than the FAS/PFAS and SE/AE groups, and significantly more impaired than the Control group on most standardized neuropsychological measures administered by the psychologists. However, the ND/AE group did not show significant differences from the Control group on direct testing measures of executive function. This was true even though caregiver report on measures of adaptation, behavior problems, and behavior rating inventory of executive functioning revealed comparable impairments in the ND/AE, SE/AE and FAS/PFAS groups, in the clinically significant range, with significantly more impairment than seen in the Control group. Psychiatric disorders were comparably prevalent across the three FASD groups, and significantly more prevalent than among the Controls. ADD/ADHD occurred most frequently. In interpreting these data, it is essential to remember that the subjects with FASD had originally sought help in a diagnostic clinic, so this high prevalence of psychiatric outcomes may not fully represent the population of all children with FASD.
The healthy, non-alcohol-exposed Control subjects showed significantly better performance on most measures when compared to the three FASD study groups. The mean full scale IQ of the healthy control group (123 + 7 SD) was higher than the population-based mean of 100 ± 15 SD. This was not surprising since children with prenatal and postnatal risk factors were screened out. Other population-based MRI and FASD-MRI studies enrolling healthy controls have reported mean full scale IQs ranging from 110 to 127.44–46 Most FASD-MRI studies do not report the IQ or neuropsychological profile of their healthy control population. Interestingly, in spite of the Control group’s relatively high IQ, many of their scores in the areas of memory, executive function, language, and adaptive behavior were, on average, solidly within normal limits compared to age peers. It is also interesting to note that the ND/AE group had a mean FSIQ (99.2 + 11.3 SD) equivalent to the population-based mean, despite multiple prenatal/postnatal risk factors and parent-reported, significant adaptive/behavioral deficits.
Prevalence of Impairment
When the data are examined by looking at the prevalence of significant impairment on the various neuropsychological measures, compared across the diagnostic groups, a somewhat different picture emerges than that seen by comparison of group means alone (Table 4). For example, typically 20% to 50% of the children with FAS/PFAS performed significantly below the population mean in any single domain of function. A comparable prevalence of impairment was observed among the children in the SE/AE group. The prevalence was markedly less in the ND/AE group and essentially absent in the Control group. Of importance, the pattern of functional impairment varied among participants, even when they were in the same FASD subgroup diagnostic classification. While there was no consistent ‘profile’ of neuropsychological deficits, it was interesting to note that children with prenatal alcohol exposure (including those in the ND/AE group), had the greatest percentage of participants in the clinically impaired range on the following specific scores: Rey Complex Figure Test–Copy and Delayed Recall; the IVA Response Control Quotient; and the California Verbal Learning Test -Trial 1 Immediate Recall. Children with prenatal alcohol exposure were more likely to score in the impaired range on these tasks than on many of the more common executive function measures such as DKEFS, Tower Trail Making, Verbal Fluency, and/or Sorting Test- or the Wisconsin Card Sorting test.
Most children in the FASD groups had full scale IQs within or above the borderline range (standard score > 70), but adaptive function was well below that expected for their level of IQ (Table 4). Parent data from the Behavior Rating Inventory of Executive Function (BRIEF) questionnaire reflect that parents of alcohol-exposed children on average rate their children as falling in the range of clinical concern (>2 standard deviations from the population mean) on everyday tasks requiring executive functioning, in contrast to direct testing of executive functions on which many fewer children scored in the impaired range (90% of the children with FASD fell in the impaired range based on parent report, while only 34% were in the impaired range on the direct EF measure that had the highest percentage of impaired scores (D-KEFS:Trails).
DISCUSSION
Three clinically and statistically distinct FASD study groups were successfully established using a comprehensive diagnostic system. Use of the FASD 4-Digit Code revealed three FASD study groups (ND/AE, SE/AE and FAS/PFAS) that reflect a linear continuum of increasing neuropsychological impairment and physical abnormality (e.g., growth deficiency and FAS facial anomalies). This represents the full spectrum of FASD. Although ND/AE, SE/AE, and FAS/PFAS are distinct FASD subgroups, a central finding of this study is that they are not distinguishable solely by their neuropsychological profiles. While all children within a group shared the same magnitude of neuropsychological impairment, no two children necessarily shared the same pattern of impairment. The creation of these three distinct FASD subgroups played a vital role in the interpretation of the MRI, MRS1, and fMRI2 outcomes of this study. Concurrently, the MRI, MRS, and fMRI outcomes played a vital role in further confirming the three FASD subgroups were clinically distinct.
While the neuropsychological, behavioral, and psychiatric profiles of the current FASD group closely parallel those presented in the FASD literature23,47, the FASD literature presents a somewhat mixed picture on whether significant neuropsychological differences exist between FASD subgroups with and without the physical features of FAS or between nondysmorphic FASD groups and healthy controls.17,48,49 The current study found clear neuropsychological differences between these various groups. Most of the differences observed between FASD subgroups, however, would not have been identified if the SE/AE and ND/AE groups had been combined into one nondysmorphic FASD group (typically referred to as ARND, FAE, or PEA in other studies).
Findings from the larger neuroimaging study further confirmed the distinction between these three FASD subgroups, and the notion that children with FASD differ in important ways from healthy, non-alcohol-exposed peers. The larger neuroimaging study also served to further validate7,8,31,34 the measurement scales and procedures for diagnostic classification used in the FASD 4-Digit Diagnostic Code. Data from the larger study revealed significant, neurostructural neurometabolite1 and neuroactivation2 differences between FASD diagnostic subgroups, and between nondysmorphic FASD subgroups and controls. For example MRI data from the larger study reveal that the frontal lobe was disproportionately smaller only in the FAS/PFAS group (the only group with the FAS facial phenotype as defined by the 4-Digit Code) (Figure 1B). The frontal lobe and FAS facial features share the same embryologic origin (the frontal nasal prominence.50 The caudate was disproportionately smaller only in the FAS/PFAS and SE/AE groups (the only two groups with severe neuropsychological impairment). Neurostructural abnormalities were also observed in the ND/AE group. The prevalence of participants in the ND/AE, SE/AE and FAS/PFAS groups with one or more brain regions found to be 2 or more standard deviations below the mean size observed in the control group increased significantly and incrementally from 43% to 58% to 75%. In addition, the prevalence/severity of structural brain abnormality increased significantly as one progressed from CNS Rank 1 (no dysfunction) to Rank 2 (mild-moderate dysfunction) to Rank 3 (severe dysfunction). Indeed, when these CNS Ranks were first defined in 199731 the underlying principle was that as the magnitude and breadth of functional impairment increased, the probability of underlying structural abnormality would increase. It is for this reason that the 4-Digit CNS Ranks 1, 2, and 3 were labeled “unlikely”, “possible”, and “probable” underlying CNS abnormality respectively (Figure 1A). MRS1 data from the larger study reveal the choline concentration (a marker of cell membrane stability and myelination) in a frontal/parietal white matter region was significantly lower only in the FAS/PFAS group. Finally, fMRI2 data reveal that neuroactivation during a difficult “2-back” working memory task decreased significantly and incrementally progressing across the four groups from Controls, to ND/AE, to SD/AE, to FAS/PFAS. These neuroimaging reports and previous studies7,31 demonstrate that these subgroup differences would not have been identified if the SE/AE and ND/AE groups had been combined into one nondysmorphic FASD group, or if less rigorous diagnostic methods and allowed the FAS/PFAS and SE/AE groups to be intermixed.
It is clear from the comprehensive neuroimaging study that MRI, MRS1, and fMRI2 can illuminate underlying brain abnormality across the full spectrum of FASD in new and important ways. What is learned about the teratogenic effects of alcohol on neurostructure, neurometabolites, and neuroactivation may help to clarify why individuals exposed to prenatal alcohol perform as they do on standardized neuropsychological measures. Certainly these neuroimaging technologies also provide convincing evidence that cognitive and behavioral deficits among those prenatally alcohol-exposed are, to an important extent, “brain-based.” These physical findings validate the importance of detecting and diagnosing the medical condition (and developmental disability) of FASD so that medication and behavioral interventions can be appropriately employed.
If we can improve our ability to physically identify the presence of CNS abnormality across the full spectrum of FASD, this may facilitate access to essential social and educational services for those with FASD. In truth, in the absence of definitive physical evidence of underlying organic CNS damage, it is often questioned whether individuals along the spectrum are really impacted by their prenatal exposure. As Stratton et al.11 note in the landmark Institute of Medicine report, not all individuals with FASD meet eligibility criteria for educational, developmental disability or mental health services. This is because FAS, and especially ARND, are typically not recognized as diagnostic labels in many existing service systems. This is also because children with FASD often have neuropsychological profiles that do not make them eligible for the services they actually need. The deficit patterns of children with FASD are characterized by deficits across multiple domains, and IQ scores may not reflect their full range of deficits or extent of functional compromise. Children with FASD often do not receive test scores that are low enough to qualify for services until their later elementary school (or even middle school) years, so many do not qualify for intervention that occurs sufficiently early. Indeed, children with FASD may receive services targeting disruptive or antisocial behavior, rather than services that more appropriately address the complex cognitive and learning deficits that comprise the foundation for their behavioral difficulties and problems in adaptive function. The clinical literature suggests that these deficits have an increasingly debilitating effect as children move into the elementary school years and beyond, interfering with successful daily function.51
Acknowledgements
This research was supported by NIAAA grant R01- AA12915-01A1 to SJA. Support was also received from the Center on Human Development and Disability, University of Washington (National Institute of Child Health and Human Development grant P30 HD02274). Special thanks are extended to the children and their families who so kindly contributed their time and energy to this study.
REFERENCES
- 1.Astley SJ, Richards T, Aylward EH, et al. Magnetic resonance spectroscopy outcomes from a comprehensive magnetic resonance study of children with fetal alcohol spectrum disorders. Magn Reson Imaging. 2009 doi: 10.1016/j.mri.2009.01.003. [DOI] [PMC free article] [PubMed] [Google Scholar]
- 2.Astley SJ, Aylward EH, Olson HC, et al. Functional magnetic resonance imaging outcomes from a comprehensive magnetic resonance study of children with fetal alcohol spectrum disorders. Journal of Neurodevelopmental Disorders. 2009 doi: 10.1007/s11689-009-9004-0. [DOI] [PMC free article] [PubMed] [Google Scholar]
- 3.Astley SJ. Diagnostic Guide for Fetal Alcohol Spectrum Disorders: The 4-Digit Diagnostic Code. 3rd ed. Seattle WA: University of Washington Publication Services; 2004. [Google Scholar]
- 4.Smith DW. The fetal alcohol syndrome. Hosp Pract. 1979;14(10):121–128. doi: 10.1080/21548331.1979.11707631. [DOI] [PubMed] [Google Scholar]
- 5.Bertrand J, Floyd RL, Weber MK, et al. National Task Force on FAS/FAE Fetal Alcohol Syndrome: Guidelines for Referral and Diagnosis. Atlanta GA: Centers for Disease Control and Prevention; 2004. [Google Scholar]
- 6.Chudley AE, Conroy J, Cook JL, Loock C, Rosales T, LeBlanc N. Public Health Agency of Canada’s National Advisory Committee on Fetal Alcohol Spectrum Disorder. Canadian guidelines for diagnosis. Can Med Assoc J. 2005;172:S1–S21. doi: 10.1503/cmaj.1040302. [DOI] [PMC free article] [PubMed] [Google Scholar]
- 7.Astley SJ, Clarren SK. Measuring the facial phenotype of individuals with prenatal alcohol exposure: correlations with brain dysfunction. Alcohol Alcohol. 2001;36:147–159. doi: 10.1093/alcalc/36.2.147. [DOI] [PubMed] [Google Scholar]
- 8.Astley S, Stachowiak J, Clarren S, Clausen C. Application of the fetal alcohol syndrome facial photographic screening tool in a foster care population. J Pediatr. 2002;141(5):712–717. doi: 10.1067/mpd.2002.129030. [DOI] [PubMed] [Google Scholar]
- 9.Aase JM, Jones KL, Clarren SK. Do we need the term “FAE”? Pediatrics. 1995;95:428–430. [PubMed] [Google Scholar]
- 10.Streissguth AP, Bookstein FL, Sampson PC, Barr HM. The enduring effects of prenatal alcohol exposure on child development: Birth through seven years a partial least squares solution. Ann Arbor MI: University of Michigan Press; 1993. [Google Scholar]
- 11.Stratton K, Howe C, Battaglia F. Institute of Medicine. Washington D C: National Academy Press; 1996. Fetal Alcohol Syndrome: Diagnosis Epidemiology Prevention and Treatment. [Google Scholar]
- 12.Streissguth AP, Bookstein FL, Barr HM, Sampson PD, O'Malley K, Young JK. Risk factors for adverse life outcomes in fetal alcohol syndrome and fetal alcohol effects. J Dev Behav Pediatr. 2004;25(4):228–238. doi: 10.1097/00004703-200408000-00002. [DOI] [PubMed] [Google Scholar]
- 13.Kerns KA, Don A, Mateer CA, Streissguth AP. Cognitive deficits in nonretarded adults with fetal alcohol syndrome. Learn Disabil. 1997;30:685–693. doi: 10.1177/002221949703000612. [DOI] [PubMed] [Google Scholar]
- 14.McGee CL, Sconfeld AM, Roebuck-Spencer TM, Riley EP, Mattson SN. Children with heavy prenatal alcohol exposure demonstrate deficits on multiple measures of concept formation. Alcohol Clin Exp Res. 2008;32(8) doi: 10.1111/j.1530-0277.2008.00707.x. [DOI] [PMC free article] [PubMed] [Google Scholar]
- 15.Rasmussen C. Executive functioning and working memory in fetal alcohol spectrum disorder. Alcohol Clin Exp Res. 2005;29:1359–1367. doi: 10.1097/01.alc.0000175040.91007.d0. [DOI] [PubMed] [Google Scholar]
- 16.Rasmussen C, Horne K, Witol A. Neurobehavioral functioning in children with fetal alcohol spectrum disorder. Child Neuropsychology. 2006;12(6):453–468. doi: 10.1080/09297040600646854. [DOI] [PubMed] [Google Scholar]
- 17.Connor PD, Sampson PD, Bookstein FL, Barr HM, Streissguth AP. Direct and indirect effects of prenatal alcohol damage on executive function. Developmental Neuropsychology. 2000;18:331–354. doi: 10.1207/S1532694204Connor. [DOI] [PubMed] [Google Scholar]
- 18.Mattson SN, Schoenfeld AM, Riley EP. Teratogenic effects of alcohol on brain and behavior. Alcohol Research & Health. 2001;25:185–191. [PMC free article] [PubMed] [Google Scholar]
- 19.Church M, Kaltenbach J. Hearing, speech, language, and vestibular disorders in the fetal alcohol syndrome: A literature review. Alcohol Clin Exp Res. 1997;21(3):495–512. doi: 10.1111/j.1530-0277.1997.tb03796.x. [DOI] [PubMed] [Google Scholar]
- 20.Franklin L, Dietz J, Jirikowic T, Astley S. Children with fetal alcohol spectrum disorders: Problem behaviors and sensory processing. Am J Occup Ther. 2008;62:265–273. doi: 10.5014/ajot.62.3.265. [DOI] [PubMed] [Google Scholar]
- 21.Streissguth AP, Aase JM, Clarren SK, Randels SP, LaDue RA, Smith DF. Fetal alcohol syndrome in adolescents and adults. Journal of the American Medical Association. 1991;265:1961–1967. [PubMed] [Google Scholar]
- 22.Thomas S, Kelly S, Mattson S, Riley E. Comparison of social abilities of children with FAS to those of children with similar IQ scores and normal controls. Alcohol Clin Exp Res. 1998;22:528–533. [PubMed] [Google Scholar]
- 23.Kodituwakku PW. Defining the behavioral phenotype in children with fetal alcohol spectrum disorders: a review. Neurosci Biobehav Rev. 2007;31(2):192–201. doi: 10.1016/j.neubiorev.2006.06.020. [DOI] [PubMed] [Google Scholar]
- 24.Archibald SL, Fennema-Notestine C, Ganst A, Riley EP, Mattson SN, Jernigan TL. Brain dysmorphology in individuals with severe prenatal alcohol exposure. Dev Med Child Neurol. 2001;43:148–154. [PubMed] [Google Scholar]
- 25.Mattson SN, Riley EP, Sowell ER, Jernigan TL, Sobel DF, Jones KL. A decrease in the size of the basal ganglia in children with FAS. Alcohol Clin Exp Res. 1996;20:1088–1093. doi: 10.1111/j.1530-0277.1996.tb01951.x. [DOI] [PubMed] [Google Scholar]
- 26.Sowell ER, Thompson PM, Mattson SN, et al. Voxel-based morphometric analyses of the brain in children and adolescents prenatally exposed to alcohol. Neuroreport. 2001;12:515–523. doi: 10.1097/00001756-200103050-00018. [DOI] [PubMed] [Google Scholar]
- 27.Bookstein FL, Sampson PD, Connor PD, Streissguth AP. Midline corpus callosum is a neuroanatomical focus of fetal alcohol damage. Anat. Rec. 2002;269:162–174. doi: 10.1002/ar.10110. [DOI] [PubMed] [Google Scholar]
- 28.Malisza KL, Allman A, Shiloff D, Jakobson L, Longstaffe S, Chudley AE. Evaluation of spatial working memory function in children and adults with fetal alcohol spectrum disorders: A functional magnetic resonance imaging study. Pediatr Res. 2005;58:1150–1157. doi: 10.1203/01.pdr.0000185479.92484.a1. [DOI] [PubMed] [Google Scholar]
- 29.Sowell ER, Lu LH, O'Hare ED, et al. Functional magnetic resonance imaging of verbal learning in children with heavy prenatal alcohol exposure. Neuroreport. 2007;18:636–639. doi: 10.1097/WNR.0b013e3280bad8dc. [DOI] [PubMed] [Google Scholar]
- 30.Fryer SL, Tapert SF, Mattson SN, Paulus MP, Spadoni AD, Riley EP. Prenatal alcohol exposure affects frontal-striatal BOLD response during inhibitory control. Alcohol Clin Exp Res. 2007;31(1–10):1. doi: 10.1111/j.1530-0277.2007.00443.x. [DOI] [PubMed] [Google Scholar]
- 31.Astley SJ, Clarren SK. Diagnosing the full spectrum of fetal alcohol exposed individuals: Introducing the 4-Digit Diagnostic Code. Alcohol Alcohol. 2000;35:400–410. doi: 10.1093/alcalc/35.4.400. [DOI] [PubMed] [Google Scholar]
- 32.Hoyme HE, May PA, Kalberg WO, et al. A practical clinical approach to diagnosis of fetal alcohol spectrum disorders: clarification of the 1996 Institute of Medicine criteria. Pediatrics. 2005;115:39–47. doi: 10.1542/peds.2004-0259. [DOI] [PMC free article] [PubMed] [Google Scholar]
- 33.Kleinbaum DG, Kupper LL, Morgenstern H. New York: Van Nostrand Reinhold Company; 1982. Epidemiologic Research: Principles and Quantitative Methods. [Google Scholar]
- 34.Astley SJ, Clarren SK. A case definition and photographic screening tool for the facial phenotype of fetal alcohol syndrome. J Pediatr. 1996;129:33–41. doi: 10.1016/s0022-3476(96)70187-7. [DOI] [PubMed] [Google Scholar]
- 35.Astley SJ. In: Fetal Alcohol Syndrome Facial Photograph Analysis Software. 1.0 ed. Astley SJ, editor. Seattle: University of Washington; 2003. [Google Scholar]
- 36.Mattson SN, Riley EP. A review of neurobehavioral deficits in children with FAS or prenatal exposure to alcohol. Res. 1998;22:279–294. doi: 10.1111/j.1530-0277.1998.tb03651.x. [DOI] [PubMed] [Google Scholar]
- 37.Connor PD, Streissguth AP, Sampson PD, Bookstein FL, Barr HM. Individual differences in auditory and visual attention among fetal alcohol-affected adults. Res. 1999;23:1395–1402. [PubMed] [Google Scholar]
- 38.Olson HC, Jirikowic T, Kartin D, Astley SJ. Responding to the challenge of early intervention for fetal alcohol spectrum disorders. Children. 2007;20:172–189. [Google Scholar]
- 39.Roebuck TM, Mattson SN, Riley EP. Behavioral and psychosocial profiles of alcohol-exposed children. Alcohol Clin Exp Res. 1999;23:1070–1076. [PubMed] [Google Scholar]
- 40.Rothman KJ. No adjustments are needed for multiple comparisons. Epidemiol Community Health. 1990;1(1):43–46. [PubMed] [Google Scholar]
- 41.Bender R, Lange S. Adjusting for multiple testing--when and how? J Clin Epidemiol. 2001;54(4):343–349. doi: 10.1016/s0895-4356(00)00314-0. [DOI] [PubMed] [Google Scholar]
- 42.Riley EP, Mattson SN, Sowell ER, Jernigan TL, Sobel DF, Jones KL. Abnormalities of the corpus callosum in children prenatally exposed to alcohol Alcohol Clin Exp. Res. 1995;19:1198–1202. doi: 10.1111/j.1530-0277.1995.tb01600.x. [DOI] [PubMed] [Google Scholar]
- 43.Jeret JS, Serur D, Wisniewski K, Fisch C. Frequency of agenesis of the corpus callosum in the developmentally disabled population as determined by computerized tomography. Pediatr Neurosci. 1986;12:101–103. doi: 10.1159/000120229. [DOI] [PubMed] [Google Scholar]
- 44.Sowell E, Johnson A, Kan E, et al. Mapping white matter integrity and neurobehavioral correlates in children with fetal alcohol spectrum disorders. Journal of Neuroscience. 2008;28(6):1313–1319. doi: 10.1523/JNEUROSCI.5067-07.2008. [DOI] [PMC free article] [PubMed] [Google Scholar]
- 45.Haier R, Jung R, Yeo R, Head K, Alkire M. Structural brain variation and general intelligence. Neuroimage. 2004;23:425–433. doi: 10.1016/j.neuroimage.2004.04.025. [DOI] [PubMed] [Google Scholar]
- 46.Waber DP, Moor CD, Forbes PW, et al. The NIH MRI Study of Normal Brain Development: Performance of a Population Based Sample of Healthy Children Aged 6 to 18 Years on a Neuropsychological Battery. J Int Neuropsychol Soc. 2007;13:1–18. doi: 10.1017/S1355617707070841. [DOI] [PubMed] [Google Scholar]
- 47.Niccols A. Fetal alcohol syndrome and the developing socio-emotional brain. Brain Cogn. 2007;65:135–142. doi: 10.1016/j.bandc.2007.02.009. [DOI] [PubMed] [Google Scholar]
- 48.Mattson SN, Riley EP, Gramling L, Delis DC, Jones KL. Neuropsychological comparison of alcohol-exposed children with or without physical features of fetal alcohol syndrome. Neuropsychology. 1998;12(1):146–153. doi: 10.1037//0894-4105.12.1.146. [DOI] [PubMed] [Google Scholar]
- 49.Conry J. Neuropsychological deficits in fetal alcohol syndrome and fetal alcohol effects. Alcohol Clin Exp Res. 1990;14(5):650–655. doi: 10.1111/j.1530-0277.1990.tb01222.x. [DOI] [PubMed] [Google Scholar]
- 50.Moore KL, Persaud TVN, Shiota K. Color Atlas of Clinical Embryology. Philidelphia, PA: W B Saunders Co; 1994. [Google Scholar]
- 51.Whaley SE, O'Connor MJ, Gunderson B. Comparison of the adaptive functioning of children prenatally exposed to alcohol to a nonexposed clinical sample. Alcohol Clin Exp Res. 2001;25:1018–1024. [PubMed] [Google Scholar]
- 52.Mutti M, Sterling HM, Spalding N. Quick Neurological Screen Test. Novato, CA: Academic Therapy Publications; 1978. [Google Scholar]
- 53.Wechsler D. WISC-III Manual. San Antonio TX: The Psychological Corporation; 1996. [Google Scholar]
- 54.Wilkinson GS. The Wide Range Achievement Test 3. 3rd ed. Wilmington, Delaware: Wide Range Inc; 1994. [Google Scholar]
- 55.Huebner FS. Review of KeyMath-Revised. Journal of Psychoeducational Assessment. 1989;7:364–367. [Google Scholar]
- 56.Beery KE. The Beery-Buktenica developmental test of visual-motor integration. 4th ed. Parsippany, NJ: Modern Curriculum Press; 1997. [Google Scholar]
- 57.Spreen O, Strauss E. A compendium of neuropsychological tests: Administration norms and commentary. 2nd ed. New York NY: Oxford University Press; 1998. [Google Scholar]
- 58.Delis DC, Kaplan E, Kramer JH, Ober BA. Delis-Kaplan Executive Function Scale. San Antonio, TX: The Psychological Corporation; 2000. [Google Scholar]
- 59.Heaton R, Chelune GJ, Talley JL, Kay GG, Curtiss G. Manual Revised and Expanded. Odessa, FL: Psychological Assessment Resources; 1993. Wisconsin Card Sorting Test. [Google Scholar]
- 60.Delis DC, Kramer JH, Kaplan E, Ober BA. CVLT-C: California Verbal Learning Test— Children’s Version. San Antonio, TX: Psychological Corporation; 1994. [Google Scholar]
- 61.Tinius TP. The Integrated Visual and Auditory Continuous Performance Test as a Neuropsychological Measure. Archives of Clinical Neuropsychology. 2003;18:439–454. [PubMed] [Google Scholar]
- 62.Newcomer P, Hammill DD. Using the test of language development with language-impaired children. J Learn Disabil. 1978;11:521–524. doi: 10.1177/002221947801100811. [DOI] [PubMed] [Google Scholar]
- 63.Wiig EH, Secord W. Test of Language Competence-Expanded Edition. The Psychological Corporation. 1988 [Google Scholar]
- 64.Wiig EH, Secord W. Test of Word Knowledge. San Antonio, TX: The Psychological Corporation; 1992. [Google Scholar]
- 65.Sparrow SS, Balla DA, Cicchetti DV. Vineland Adaptive Behavior Scales: Interview Edition Survey Form Manual Circle. Pines, MN: American Guidance Service; 1984. [Google Scholar]
- 66.Achenbach T. Child Behavior Checklist (CBCL 6–18) Burlington: University Associates in Psychiatry; 2001. [Google Scholar]
- 67.Gioia GA, Isquith PK, Guy SC, Kenworth L. Behavior rating inventory of executive function (BRIEF) Odessa, FL: Psychological Assessment Resources; 2000. [Google Scholar]
- 68.Shaffer D, Fischer P, Lucas C, Comer J. Diagnostic Interview for Children (DISC-V) New York: Columbia University; 2003. [Google Scholar]