

Abstract
Purpose
Previous studies suggest that African Americans (AA) have lower levels of cardiorespiratory fitness (CRF) than their Caucasian (C) counterparts. However, the association between CRF and race/ethnicity in the context of higher socioeconomic status (SES) has not been explored.
Methods
We evaluated 589 AA (309 men and 203 women) and 33,015 C (19,399 men and 8753 women) enrolled in the Cooper Center Longitudinal Study. Education years and access to a preventive health care examination were used as a proxy for higher SES. Data were collected from a questionnaire, maximal treadmill exercise stress test, and other clinical measures. The outcome variable was CRF, which was stratified into low fit (quintile 1 of CRF) and fit (quintiles 2–5). Multivariable regression was used to compare adjusted mean CRF between groups. P values were adjusted for unbalanced sample size and unequal variance between groups.
Results
The mean education years were similar for AA and C men at 16 yr; however, AA women had more years of education than C (15.8 vs 15.2 yr, P = 0.0062). AA men and women had a significantly higher prevalence of being unfit compared with their C counterparts (men 26.7% vs 12.6%, P < 0.0001; women 21.3% vs 8.4%, P < 0.0001). The adjusted mean estimated maximal METs were 10.9 vs 11.7 and 8.8 vs 9.8 for AA and C men and women, respectively. Fully adjusted odds ratios revealed that AA men had more than twice the risk of being unfit compared with C men. A trend persisted for AA women to have a lower MET value than their counterparts.
Conclusions
Despite comparable higher SES, lower CRF existed among AA men versus C men. These results suggest that CRF may not be mediated strictly by environmental factors related to SES.
Keywords: Racial/Ethnic Minorities, Disparities, Physical Activity
Cardiorespiratory fitness (CRF) is shown to have an inverse relationship with several health outcomes such as cardiovascular disease (6), diabetes (36), and cardiovascular and all-cause mortality (8). Lower CRF has been documented among African Americans when compared with their Caucasian counterparts (12,17,29,34). Data from the National Health and Nutrition Examination Survey (NHANES) has demonstrated that non-Hispanic black adults age 20–49 yr have more than a twofold increased risk of having a lower CRF level compared with non-Hispanic white adults (15). To note, most NHANES studies that address race and CRF include estimated fitness levels from submaximal exercise tests (12,15,34); limited information is available for maximal fitness levels. Accumulating evidence suggests that these differences in CRF exist in African Americans and Caucasians across multiple populations, including children, athletes, and premenopausal women (21,35,37). After adjusting for confounding variables such as age, percentage of body fat, tobacco use, and other fitness-related variables, racial differences in CRF persisted in previous studies. However, unmeasured confounders related to socioeconomic issues believed to affect fitness in such populations cannot be easily evaluated. It is similarly known that African Americans have an overall greater risk of cardiovascular disease, cancer, and other chronic diseases compared with Caucasians (24). The underlying directionality of the relationship between these chronic diseases and low CRF is unclear in diverse populations. The fitness and chronic condition disparities must be considered by primary care physicians when they are providing exercise recommendations to their patients, thus highlighting the importance of addressing fitness disparities between African Americans and Caucasians.
In previous studies involving African Americans, it is suggested that social, cultural, and genetic influences affect CRF and susceptibility to disease (1,10). Social and environmental determinants of fitness such as cultural mores, built environment, and poverty are believed to be associated with less physical activity and hence fitness (33). Existing CRF research on disparities does not focus on populations of high individual-level socioeconomic status (SES) (21,34,37). Therefore, our study will address the question of whether African Americans in a higher SES cohort, removing unmeasured confounders believed to be present in lower individual-level SES populations, will have lower CRF as compared with Caucasians. This is the second diversity paper from the Cooper Center Longitudinal Study (CCLS) to explore the effect of race in the context of an otherwise homogenous cohort of higher individual-level SES (18).
Methods
This study was a cross-sectional analysis of data collected on men and women who were self-referred or employer-referred for a preventive medical examination in Dallas, Texas, at the Cooper Clinic between 1970 and 2010. All patients signed an informed consent approving their data to be collected and used for research purposes in the CCLS, a prospective epidemiological database. Privacy precautions were maintained through The Cooper Institute and Clinic policies, and all data were deidentified before analysis. The study protocol is reviewed and approved annually by The Cooper Institute review board.
To derive our cohort of 589 African Americans (309 men and 203 women) and 33,015 Caucasian (19,399 men and 8753 women), we required complete data on race and maximal exercise stress testing. Participants with the history of myocardial infractions, stroke, diabetes, and cancer were excluded. The examination included a maximal exercise test; self-report of pertinent demographic information including age, race/ethnicity, and education; past medical history; a physical examination consisting of blood pressure measurements, anthropometric assessments, and an electrocardiogram; and laboratory tests.
Blood pressure was measured with a stethoscope and mercury sphygmomanometer using the ausculatory technique. Height and weight were measured using a calibrated physician's scale and stadiometer. Body mass index (BMI) was defined as weight in kilograms divided by height in meters squared. Measures of risk factors such as fasting glucose and total cholesterol were completed with a blood chemistry test after an overnight fast of at least 12 h Blood serum was analyzed using automated methods that were measured in accordance with standard procedures.
Our primary exposure variable was self-reported race. SES was defined using education years and access to the preventive health care examination as proxy for higher SES. Income is not an available variable in our CCLS population. The primary outcome variable was objectively measured CRF by modified Balke treadmill with time used to estimate METs. The test has been described elsewhere (38). Exercise time was used to estimate age- and sex-specific quintiles that were grouped into low fit (quintile 1) and fit (quintiles 2–5) categories as in previous studies (8). Our goal was to determine the likelihood of being in the highest health risk category of fitness. As absolute cut points are not available, traditionally we use age-adjusted quintiles. Age- and sex-specific quintiles for measuring treadmill time do not provide an absolute measure of fitness, but it has been shown to be a useful method to demonstrate fitness-related effects. MET-minutes were calculated by multiplying the estimated energy expenditure retrieved from the Compendium of Physical Activities (2) by the amount of minutes completed during activity.
Results
Demographic characteristics of the cohort are presented in Table 1. African American men reported similar mean education years to Caucasian men (16 yr); however, African American women had more years of education than Caucasian women (15.8 vs 15.2 yr, P = 0.0062). Tobacco use was comparable among women, although Caucasian men self-reported a significantly higher percentage of tobacco use (15.1% vs 11%, P = 0.05). The average BMI was in the overweight category for all race-sex groups (African American men 29.2 kg·m−2, Caucasian men 27.3 kg·m−2, and African American women 27.3 kg·m−2) except Caucasian women (24.1 kg·m−2). Blood pressure in African American men (systolic, 125.1 vs 122.4 mm Hg, P = 0.0004) and women (systolic, 119.0 vs 114.4 mm Hg, P < 0.0001) was significantly higher compared with their Caucasian counterparts (Table 1). Despite nonsignificant differences in PA MET-minutes in men (P = 0.21) and women (P = 0.22), African Americans overall had a significantly lower CRF than their Caucasians (P < 0.0001) (Table 1).
Table 1.
Baseline characteristics of African American and Caucasian men and women, CCLS 1970–2010.
| African American Men N = 309 |
Caucasian Men N = 19,399 |
P | African American Women N = 203 |
Caucasian Women N = 8753 |
P | |
|---|---|---|---|---|---|---|
| Age (yr) | 43.7 ± 7.9 | 45.1 ± 9.2 | 0.0025 | 44.8 ± 8.4 | 45.9 ± 10.3 | 0.05 |
| Education (yr) | 16.1 ± 2.2 | 16.0 ± 2.1 | 0.63 | 15.8 ± 2.3 | 15.2 ± 2.2 | 0.0062 |
| Smoker | 34.0 (11.0) | 2927 (15.1) | 0.05 | 10 (4.9) | 552 (6.3) | 0.42 |
| BMI (kg·m−2) | 29.2 ± 4.8 | 27.3 ± 4.0 | <0.0001 | 27.3 ± 5.7 | 24.1 ± 4.6 | <0.0001 |
| Glucose (mmol·L−1) | 95.8 ± 8.9 | 97.3 ± 8.7 | 0.0039 | 90.9 ± 8.5 | 92.0 ± 8.5 | 0.07 |
| Total cholesterol (mmol·L−1) | 201.2 ± 39.6 | 200.1 ± 37.9 | 0.63 | 193.9 ± 37.9 | 196.5 ± 36.0 | 0.32 |
| High density lipoprotein cholesterol (mmol·L−1) | 50.8 ± 11.9 | 47.7 ± 12.1 | <0.0001 | 65.4 ± 17.3 | 65.5 ± 16.3 | 0.96 |
| Triglycerides (mmol·L−1) | 104.6 ± 76.7 | 134.2 ± 95.3 | <0.0001 | 82.2 ± 38.7 | 99.2 ± 58.4 | <0.0001 |
| Systolic blood pressure (mm Hg) | 125.1 ± 13.3 | 122.4 ± 12.8 | 0.0004 | 119.0 ± 14.5 | 114.4 ± 14.8 | <0.0001 |
| Diastolic blood pressure (mm Hg) | 85.2 ± 10.7 | 82.5 ± 9.5 | <0.0001 | 80.7 ± 10.3 | 77.1 ± 9.7 | <0.0001 |
| Hypertension | 142 (46.0) | 6470 (33.3) | <0.0001 | 68 (33.5) | 1715 (19.6) | <0.0001 |
| Hemoglobin (g·dL−1) | 14.7 ± 0.9 | 15.2 ± 1.0 | <0.0001 | 12.7 ± 1.0 | 13.5 ± 0.9 | <0.0001 |
| CRF (METs) | 10.9 (2.1) | 11.7 (2.3) | <0.0001 | 8.8 (1.8) | 9.8 (2.0) | <0.0001 |
| Physical activity (MET·min·wk−1) | 1096.1 ± 1375.3 | 997.2 ± 1377.5 | 0.21 | 946.8 ± 1209.2 | 1052.9 ± 1387.2 | 0.22 |
Hypertension is defined by medication use or blood pressure >140/90. Data are presented as means ± SD or n (%).
African Americans had a higher prevalence of being in the low fit category (quintile 1) than Caucasians (men, 25.2% vs 11.5%; women, 18.2% vs 7.6%, respectively) (Table 2). Low fitness in African Americans was predicted by race after correcting for age as seen in Table 3. After adjusting for the covariates of age, BMI, PA MET-minutes, education, high blood pressure, hemoglobin, and tobacco use, African American men had two times the risk of being low fit than Caucasians, as seen in Table 3. A trend persisted for African American women (Fig. 1), although the fully adjusted risk of low fitness was not significantly different (Table 3). There was no significant difference between maximum heart rates (MHR) on treadmill (African American men MHR = 178.6 vs Caucasian n = 177.5, P value = 0.20; African American women MHR = 176.2 vs Caucasian = 175.2, P value = 0.29), suggesting comparable effort. Of note, the reasons for participants in our cohort stopping the treadmill test were generally similar in Caucasians and African Americans (Table 4).
Table 2.
Prevalence of CRF by quintile, sex, and race, CCLS 1970–2010.
| Men | Women | |||
|---|---|---|---|---|
|
|
|
|||
| African American | Caucasian | African American | Caucasian | |
| Quintile 1 (low fit)a | 78 (25.2) | 2237 (11.5) | 37 (18.2) | 666 (7.6) |
| Quintile 2 | 66 (21.4) | 3541 (18.3) | 56 (27.6) | 1159 (13.2) |
| Quintile 3 | 57 (18.5) | 4176 (21.5) | 27 (13.3) | 1435 (16.4) |
| Quintile 4 | 76 (24.6) | 5125 (26.4) | 51 (25.1) | 2512 (28.7) |
| Quintile 5 | 32 (10.4) | 4320 (22.3) | 32 (15.8) | 2981 (34.1) |
Data are presented as n (%).
Quintiles represent age- and sex-adjusted CRF quintiles estimated from Balke treadmill time in seconds. See Methods section for details.
Table 3.
Odds ratio for the relative risk of low fitnessa in African Americans.
| Referent = Caucasian | Men | P |
|---|---|---|
| Adjusted for age | 2.55 (1.97, 3.31) | <0.0001 |
| Fully adjustedb | 2.06 (1.51, 2.83) | <0.0001 |
|
| ||
| Women | P | |
|
| ||
| Adjusted for age | 2.72 (1.89, 3.92) | <0.0001 |
| Fully adjustedb | 1.34 (0.84, 2.14) | 0.22 |
Low fitness defined by quintile 1 of CRF estimated from Balke treadmill time in seconds.
Fully adjusted includes variables: age, BMI, education, high blood pressure, hemoglobin, smoking, and PA MET-minutes.
PA MET, physical activity MET.
Figure 1.
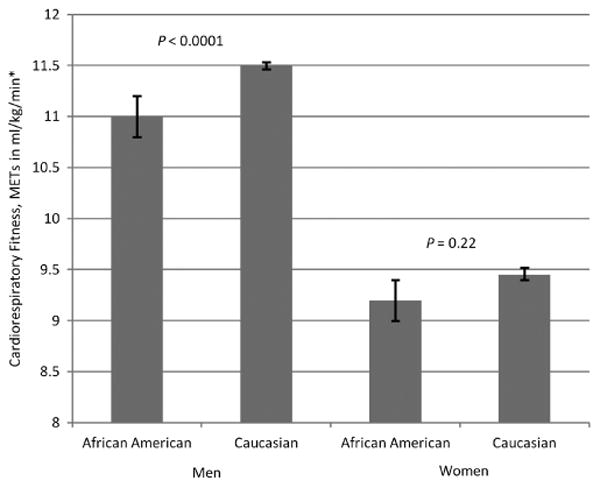
Means for METs comparing African American and Caucasian men and women. * Adjusted for age, BMI, PA MET-mins, education, high blood pressure, hemoglobin, and tobacco use.
Table 4.
Most prevalent reasons for stopping Balke treadmill test in the CCLS, 1970–2010.
| African Americans | Caucasians | |
|---|---|---|
| Leg weakness | 235 (48.7) | 12,833 (47.9) |
| Volitional exhaustion | 107 (22.2) | 6847 (25.6) |
| Dyspnea | 62 (12.8) | 4189 (15.6) |
| Othera | 55 (11.4) | 1676 (6.3) |
| Subject's desire to stop | 8 (1.7) | 568 (2.1) |
| Physician decided | 7 (1.45) | 301 (1.12) |
| Hypertension | 5 (1.04) | 36 (0.13) |
| Dizzy | 2 (0.41) | 236 (0.88) |
| Chest pain | 1 (0.21) | 50 (0.19) |
| Equipment failure | 1 (0.21) | 6 (0.02) |
| Hypotension | 0 (0.00) | 12 (0.04) |
| ECG change | 0 (0.00) | 35 (0.13) |
Data are presented as n(%).
“Other” is a clinically driven category that did not include the previously mentioned variables.
Discussion
This article is the second to present apparent racial disparities in health factors between African Americans and Caucasians (18) in this population. Frierson et al. (18) suggested race was predictive of cardiovascular risk factors in African Americans compared with Caucasians regardless of higher homogenous SES, defined by education years and access to a preventive care examination. We investigated further and observed that significant disparities in the presence of high-risk fitness levels were present and remained in African American men compared with Caucasians despite both groups having higher individual-level SES. Significant CRF disparities, estimated by maximal exercise testing, were present and remained in men after adjusting for the confounding variables of age, BMI, PA MET-minutes, education, high blood pressure, hemoglobin, and tobacco. Lower fitness in African Americans from the CCLS suggests that racial differences in CRF may not be mediated strictly by factors related to individual-level SES.
Previous literature has shown Caucasian race, younger age, male sex, and lower BMI as independent predictors of CRF between African American and Caucasian men and women (29). Our results are parallel with these findings, suggesting African Americans have increased risk of having reduced CRF. Our findings are consistent with previous evaluations of population-based estimated submaximal CRF levels using NHANES in which lower CRF was also seen in African Americans (12,15,34). Our study demonstrates that among those of higher SES, disparities still exist in CRF levels between African Americans and Caucasians. The results of this report further support race as an independent risk factor for lower fitness levels among African Americans. Furthermore, there was a small but significant age difference (<2 yr) in African Americans compared with Caucasians. The African American men and women were on average younger than their respective Caucasian comparison groups. As fitness decreases with age, this observation would suggest that our finding of lower fitness in African Americans is conservative.
The fitness disparities may be important given the known relationship between fitness and numerous morbidities and mortality. As CRF has been shown to associate with more positive health outcomes, racial CRF disparities may contribute to poorer health outcomes among African Americans compared with Caucasians. Moderate fitness may protect against precursors of mortality, which include elevated blood pressure and cholesterol levels (6,7). Fitness has an inverse, graded relationship with cardiovascular disease and all-cause mortality in healthy and unhealthy African American and Caucasian populations (19,26,27). In addition, exercise capacity has been found to be an independent predictor of mortality (19,25). Kokkino et al. (28) found that adjusted mortality risk decreased among diabetic men in both racial groups (African Americans 14%, Caucasians 19%) for every 1-MET increase; nonetheless, all-cause mortality remained 23% higher in African Americans. Further, in a group of healthy men, mortality risk remained 11% higher in African American versus Caucasians, although the mortality risk reduction for every 1-MET increase was similar for both races (27).
Individual-level SES has been defined by others using income, occupation, and/or education and contributes to health- and fitness-related disparities (1,11). Although demographic information is shared between physician and patient, we do not collect income levels, as noted. Therefore, education and access to preventive care have been used to define higher SES status in this population (18). Furthermore, built environment has been identified as a strong predictor of physical activity resources and is associated with both individual- and neighborhood-level SES (16,33). Although our findings suggest that disparities in CRF between African Americans and Caucasians are independent of individual-level SES, further studies in this population can explore whether differences in built environment or neighborhood-level SES are potential explanatory factors in racial/ethnic differences in CRF. Comparable physical activity levels among men in this study make it unlikely that racial differences related to fitness were a result of leisure time physical activity alone. Although African American women had a higher education level than their Caucasian counterparts and comparable access to a preventive care examination, African American women participated in less self-reported physical activity, although statistically insignificant. Previous literature suggests that perceptions regarding the benefits of physical activity between African Americans and Caucasians are similar; therefore, other neighborhood environment factors may be a barrier to physical activity and fitness (30). Our study results are similar to previous heterogeneous studies documenting increased BMI and lower fitness levels in African American women compared with Caucasian women (34). Of note, some suggest that increased BMI in young adult African Americans may not reflect increased body fat; therefore, BMI may not have a significant metabolic impact (22). Although the fully adjusted fitness model did not reach significance in women, which may be due to power issues, a trend persisted.
Although lower CRF in African Americans has been consistently found in a variety of populations including children, adults, and athletes, the underlying mechanisms leading to this phenomenon are not fully understood (21,35,37). It has been suggested that physiologic differences lead to the different CRF levels seen in racial groups, although the exact underlying mechanisms are unknown. For example, a previous study provided evidence that African Americans appeared to have greater physiologic difficulty when attaining maximal fitness levels suggested by increased heart rate, ventilation, and perceived exertion during physical tasks compared with Caucasians (21). However, our analysis revealed no significant difference in mean age-adjusted maximal heart rates between sex-specific counterparts, suggesting comparable effort and difficulty. Furthermore, adjusting for variables age, BMI, education, PA MET-minutes, smoking, high blood pressure, and hemoglobin failed to remove the significant effect of race on CRF in African American men. Even in populations of highly trained athletes, a disparity exists (37). A hypothesis that could explain racial differences in CRF involves the concept of increased exercise economy in Africans compared with their Caucasian counterparts. Weston et al. investigated the concept of “running economy” and found that African runners operated at a reduced VO2max, compared with Caucasians, yet completed a 10-km run within a comparable time frame (37). “Running economy” refers to a greater ability to produce energy during movements, specifically stepping tasks, as defined in this small study of elite marathon runners (37). Inconsistent evidence has shown increased running economy (31,37,39) and higher fractional utilization of VO2peak (9,13) in African individuals versus their Caucasian counterparts; however, little is known concerning these physiological factors within the African American and Caucasian population.
Several potential underlying mechanisms should be considered. First, it is believed that a reasonable percentage of an individual's ability to attain high maximal fitness levels is genetic in basis (10). Second, other investigators have found differences in skeletal muscle characteristics including oxidative capacity and lower percentage of slow twitch muscle fibers in African Americans (4,5). Third, lower hemoglobin levels are generally seen in African Americans but do not appear to affect the race–fitness relationship in this study (21). Finally, there are well-known differences in cardiovascular health, including greater prevalence of hypertension, left ventricular hypertrophy, obesity, insulin resistance, and diabetes (32), that could affect and be affected by CRF level. In particular, higher levels of insulin resistance among African Americans as compared with Caucasians, independent of body fat distribution (3), may contribute to abnormalities in skeletal muscle mitochondria, hampering exercise performance and worsening CRF (14). Nonphysiologic considerations could account for the disparate CRF levels seen here. First, eating behaviors may have varied, and deficient energy consumption could have failed to supply the energy required to attain maximum CRF level, although maximal predicted heart rate was similar. Another possible explanation for the results is inaccurate measurement of physical activity that is inherent in self-reports of physical activity. Therefore, it is possible that the disparate fitness may be a result of different lifestyle behaviors in our African American and Caucasian populations that are not measured.
A major strength of our study includes an African American population with higher, more homogeneous individual-level SES relative to other studies in fitness. The disproportionate social disadvantages experienced by African Americans are well documented (1); these high levels of inequality introduce unmeasured confounders related to SES in other studies (20). In addition, extensive phenotyping of the cohort removed the likelihood of lower CRF being related solely to underlying disease. Moreover, we had the opportunity to examine the association of maximal fitness levels in relation to race, whereas other large databases estimate fitness levels from submaximal tests. An additional strength includes the similar mean and median year of examination dates among African Americans (2002 and 2003) and Caucasians (2000 and 2001) in this 40-yr period; these similar dates point against secular differences that may have occurred over time (38) because of increased public policy regarding physical activity recommendations. A limitation to this study is the disproportionately smaller African American population. We addressed this by using multivariable regression to compare adjusted mean CRF between groups, and P values were calculated for an unbalanced sample size and unequal variance between groups. Second, although fat-free mass may better represent metabolically active tissue than BMI, it was not available in this data set. Lastly, there are limitations regarding our definition of SES, defined by the available variable of education years and having access to the Cooper Clinic's preventive examination. This potentially could artificially increase the SES of the examined individuals.
Overall, we conclude that the African Americans in this cohort have a lower fitness level than their Caucasian counterparts and a significantly lower CRF level within the male population. Disparate fitness levels between African Americans and Caucasians did not seem to be significantly mitigated despite higher individual-level SES in this population as measured by education and access to health care resources. The elimination of unmeasured confounders present in other economically diverse populations did not entirely remove racial differences seen in CRF, further emphasizing the need for a multifaceted approach to health equality. Our results suggest that racial/ethnic differences regarding CRF do exist among African Americans and Caucasians across the socioeconomic spectrum. These findings may have both individual and policy level implications. First, this fitness disparity in conjunction with the known health disparities should remind health care providers of the critical need to screen and follow their African American patients for low fitness-related disease. Second, as some experts are beginning to suggest the need for considering fitness levels a vital sign (23) in this era of increasing obesity and sedentary behavior, it will be critical to understand the nuanced differences between races to inform cut points and policy. Additional research in this area is warranted to verify these findings in other homogenous, higher SES populations. Finally, research should be done to delineate the mechanisms for lower fitness and to determine its impact on chronic disease development and hence prevention.
Acknowledgments
The authors thank Kenneth H. Cooper, M.D., M.P.H., for establishing the Cooper Center Longitudinal Study and The Cooper Institute for data management.
There are no funding sources to disclose.
Footnotes
There are no conflicts of interest to disclose.
The results of the present study do not constitute endorsement by the American College of Sports Medicine.
References
- 1.Adler NE, Rehkopf DH. U.S. disparities in health: descriptions, causes, and mechanisms. Annu Rev Public Health. 2008;29:235–52. doi: 10.1146/annurev.publhealth.29.020907.090852. [DOI] [PubMed] [Google Scholar]
- 2.Ainsworth BE, Haskell WL, Whitt MC, et al. Compendium of physical activities: an update of activity codes and MET intensities. Med Sci Sports Exerc. 2000;32(9 Suppl):S498–516. doi: 10.1097/00005768-200009001-00009. [DOI] [PubMed] [Google Scholar]
- 3.Albu JB, Kovera AJ, Allen L, et al. Independent association of insulin resistance with larger amounts of intermuscular adipose tissue and a greater acute insulin response to glucose in African American than in white nondiabetic women. Am J Clin Nutr. 2005;82(6):1210–7. doi: 10.1093/ajcn/82.6.1210. [DOI] [PMC free article] [PubMed] [Google Scholar]
- 4.Ama PF, Simoneau JA, Boulay MR, Serresse O, Theriault G, Bouchard C. Skeletal muscle characteristics in sedentary black and Caucasian males. J Appl Physiol. 1986;61(5):1758–61. doi: 10.1152/jappl.1986.61.5.1758. [DOI] [PubMed] [Google Scholar]
- 5.Bassett DR, Jr, Howley ET. Limiting factors for maximum oxygen uptake and determinants of endurance performance. Med Sci Sports Exerc. 2000;32(1):70–84. doi: 10.1097/00005768-200001000-00012. [DOI] [PubMed] [Google Scholar]
- 6.Blair SN, Kampert JB, Kohl HW, III, et al. Influences of cardiorespiratory fitness and other precursors on cardiovascular disease and all-cause mortality in men and women. JAMA. 1996;276(3):205–10. [PubMed] [Google Scholar]
- 7.Blair SN, Kannel WB, Kohl HW, Goodyear N, Wilson PWF. Surrogate measures of physical activity and physical fitness: evidence for sedentary traits of resting tachycardia, obesity, and low vital capacity. Am J Epidemiol. 1989;129(6):1145–56. doi: 10.1093/oxfordjournals.aje.a115236. [DOI] [PubMed] [Google Scholar]
- 8.Blair SN, Kohl HW, III, Paffenbarger RS, Jr, Clark DG, Cooper KH, Gibbons LW. Physical fitness and all-cause mortality: a prospective study of healthy men and women. JAMA. 1989;262(17):2395–401. doi: 10.1001/jama.262.17.2395. [DOI] [PubMed] [Google Scholar]
- 9.Bosch AN, Goslin BR, Noakes TD, Dennis SC. Physiological differences between black and white runners during a treadmill marathon. Eur J Appl Physiol Occup Physiol. 1990;61(1–2):68–72. doi: 10.1007/BF00236696. [DOI] [PubMed] [Google Scholar]
- 10.Bouchard C, Sarzynski MA, Rice TK, et al. Genomic predictors of maximal oxygen uptake response to standardized exercise training programs. J Appl Physiol. 2010;110(5):1160–70. doi: 10.1152/japplphysiol.00973.2010. [DOI] [PMC free article] [PubMed] [Google Scholar]
- 11.Braveman PA, Cubbin C, Egerter S, Williams DR, Pamuk E. Socioeconomic disparities in health in the United States: what the patterns tell us. Am J Public Health. 2010;100(1 suppl):S186–96. doi: 10.2105/AJPH.2009.166082. [DOI] [PMC free article] [PubMed] [Google Scholar]
- 12.Ceaser TG, Fitzhugh EC, Thompson DL, Bassett DR., Jr Association of physical activity, fitness, and race: NHANES 1999–2004. Med Sci Sports Exerc. 2012;45(2):286–93. doi: 10.1249/MSS.0b013e318271689e. [DOI] [PubMed] [Google Scholar]
- 13.Coetzer P, Noakes TD, Sanders B, et al. Superior fatigue resistance of elite black South African distance runners. J Appl Physiol. 1993;75(4):1822–7. doi: 10.1152/jappl.1993.75.4.1822. [DOI] [PubMed] [Google Scholar]
- 14.De Filippis E, Alvarez G, Berria R, et al. Insulin-resistant muscle is exercise resistant: evidence for reduced response of nuclear-encoded mitochondrial genes to exercise. Am J Physiol Endocrinol Metab. 2008;294(3):E607–14. doi: 10.1152/ajpendo.00729.2007. [DOI] [PubMed] [Google Scholar]
- 15.Duncan GE, Li SM, Zhou XH. Cardiovascular fitness among U.S. adults: NHANES 1999–2000 and 2001–2002. Med Sci Sports Exerc. 2005;37(8):1324–8. doi: 10.1249/01.mss.0000174893.74326.11. [DOI] [PubMed] [Google Scholar]
- 16.Estabrooks PA, Lee RE, Gyurcsik NC. Resources for physical activity participation: does availability and accessibility differ by neighborhood socioeconomic status? Ann Behav Med. 2003;25(2):100–4. doi: 10.1207/S15324796ABM2502_05. [DOI] [PubMed] [Google Scholar]
- 17.Fleg JL, Morrell CH, Bos AG, et al. Accelerated longitudinal decline of aerobic capacity in healthy older adults. Circulation. 2005;112(5):674–82. doi: 10.1161/CIRCULATIONAHA.105.545459. [DOI] [PubMed] [Google Scholar]
- 18.Frierson GM, Howard EN, Defina LF, Powell-Wiley TM, Willis BL. Effect of race and socioeconomic status on cardiovascular risk factor burden: The Cooper Center Longitudinal Study. Ethn Dis. 2013;23:35–42. [PMC free article] [PubMed] [Google Scholar]
- 19.Gulati M, Pandey DK, Arnsdorf MF, et al. Exercise capacity and the risk of death in women: the St James Women Take Heart Project. Circulation. 2003;108(13):1554–9. doi: 10.1161/01.CIR.0000091080.57509.E9. [DOI] [PubMed] [Google Scholar]
- 20.Hummer RA. Black–white differences in health and mortality. Sociol Q. 1996;37(1):105–25. [Google Scholar]
- 21.Hunter GR, Weinsier RL, Zuckerman PA, Darnell BE. Aerobic fitness, physiologic difficulty and physical activity in Black and White women. Int J Obes Relat Metab Disord. 2004;28(9):1111–7. doi: 10.1038/sj.ijo.0802724. [DOI] [PubMed] [Google Scholar]
- 22.Jackson AS, Ellis KJ, McFarlin BK, Sailors MH, Bray MS. Body mass index bias in defining obesity of diverse young adults: the Training Intervention and Genetics of Exercise Response (TIGER) study. Br J Nutr. 2009;102(7):1084–90. doi: 10.1017/S0007114509325738. [DOI] [PMC free article] [PubMed] [Google Scholar]
- 23.Kaminsky LA, Arena R, Beckie TM, et al. The importance of cardiorespiratory fitness in the United States: the need for a national registry: a policy statement from the American Heart Association. Circulation. 2013;127(5):652–62. doi: 10.1161/CIR.0b013e31827ee100. [DOI] [PubMed] [Google Scholar]
- 24.Keppel KG, Pearcy JN, Wagener DK. Trends in racial and ethnic-specific rates for the health status indicators: United States, 1990–98. Healthy People 2000 Stat Notes. 2000:1–16. [PubMed] [Google Scholar]
- 25.Kodama S, Saito K, Tanaka S, et al. Cardiorespiratory fitness as a quantitative predictor of all-cause mortality and cardiovascular events in healthy men and women: a meta-analysis. JAMA. 2009;301(19):2024–35. doi: 10.1001/jama.2009.681. [DOI] [PubMed] [Google Scholar]
- 26.Kokkinos P, Myers J, Faselis C, et al. Exercise capacity and mortality in older men: a 20-year follow-up study. Circulation. 2010;122(8):790–7. doi: 10.1161/CIRCULATIONAHA.110.938852. [DOI] [PubMed] [Google Scholar]
- 27.Kokkinos P, Myers J, Kokkinos JP, et al. Exercise capacity and mortality in black and white men. Circulation. 2008;117(5):614–22. doi: 10.1161/CIRCULATIONAHA.107.734764. [DOI] [PubMed] [Google Scholar]
- 28.Kokkinos P, Myers J, Nylen E, et al. Exercise capacity and all-cause mortality in African American and Caucasian men with type 2 diabetes. Diabetes Care. 2009;32(4):623–8. doi: 10.2337/dc08-1876. [DOI] [PMC free article] [PubMed] [Google Scholar]
- 29.Lavie CJ, Kuruvanka T, Milani RV, Prasad A, Ventura HO. Exercise capacity in adult African-Americans referred for exercise stress testing: is fitness affected by race? Chest. 2004;126(6):1962–8. doi: 10.1378/chest.126.6.1962. [DOI] [PubMed] [Google Scholar]
- 30.Mathieu RA, Powell-Wiley TM, Ayers CR, et al. Physical activity participation, health perceptions, and cardiovascular disease mortality in a multiethnic population: the Dallas Heart Study. Am Heart J. 2012;163(6):1037–40. doi: 10.1016/j.ahj.2012.03.005. [DOI] [PMC free article] [PubMed] [Google Scholar]
- 31.Robinson J, Dill DB, Harman PM, Hall FG, Wison JW. Adaptation to exercise of Negro and White sharecroppers: in comparison with Northern Whites. Hum Biol. 1941;13:139–58. [Google Scholar]
- 32.Roger VL, Go AS, Lloyd-Jones DM, et al. Executive summary: heart disease and stroke statistics-2012 update: a report from the American Heart Association. Circulation. 2012;125(1):188–97. doi: 10.1161/CIR.0b013e3182456d46. [DOI] [PubMed] [Google Scholar]
- 33.Sallis JF, Floyd MF, Rodriguez DA, Saelens BE. Role of built environments in physical activity, obesity, and cardiovascular disease. Circulation. 2012;125(5):729–37. doi: 10.1161/CIRCULATIONAHA.110.969022. [DOI] [PMC free article] [PubMed] [Google Scholar]
- 34.Sanders LF, Duncan GE. Population-based reference standards for cardiovascular fitness among U.S. adults: NHANES 1999–2000 and 2001–2002. Med Sci Sports Exerc. 2006;38(4):701–7. doi: 10.1249/01.mss.0000210193.49210.b5. [DOI] [PubMed] [Google Scholar]
- 35.Trowbridge CA, Gower BA, Nagy TR, Hunter GR, Treuth MS, Goran MI. Maximal aerobic capacity in African-American and Caucasian prepubertal children. Am J Physiol. 1997;273(4 Pt 1):E809–14. doi: 10.1152/ajpendo.1997.273.4.E809. [DOI] [PubMed] [Google Scholar]
- 36.Wei M, Gibbons LW, Mitchell TL, Kampert JB, Lee CD, Blair SN. The association between cardiorespiratory fitness and impaired fasting glucose and type 2 diabetes mellitus in men. Ann Intern Med. 1999;130(2):89–96. doi: 10.7326/0003-4819-130-2-199901190-00002. [DOI] [PubMed] [Google Scholar]
- 37.Weston AR, Mbambo Z, Myburgh KH. Running economy of African and Caucasian distance runners. Med Sci Sports Exerc. 2000;32(6):1130–4. doi: 10.1097/00005768-200006000-00015. [DOI] [PubMed] [Google Scholar]
- 38.Willis BL, Morrow JR, Jr, Jackson AW, Defina LF, Cooper KH. Secular change in cardiorespiratory fitness of men: Cooper Center Longitudinal Study. Med Sci Sports Exerc. 2011;43(11):2134–9. doi: 10.1249/MSS.0b013e31821c00a7. [DOI] [PubMed] [Google Scholar]
- 39.Wyndham CH, Strydom NB, Morrison JF, et al. Differences between ethnic groups in physical working capacity. J Appl Physiol. 1963;18:361–6. doi: 10.1152/jappl.1963.18.2.361. [DOI] [PubMed] [Google Scholar]