

Abstract
Iron scavengers (chelators) offer therapeutic opportunities in anticancer drug design by targeting the increased demand for iron in cancer cells as compared to normal cells. Prochelation approaches are expected to avoid systemic iron depletion as chelators are liberated under specific intracellular conditions. In the strategy described herein, a disulfide linkage is employed as a redox-directed switch within the binding unit of an antiproliferative thiosemicarbazone prochelator, which is activated for iron coordination following reduction to the thiolate chelator. In glutathione redox buffer, this reduction event occurs at physiological concentrations and half-cell potentials. Consistent with concurrent reduction and activation, higher intracellular thiol concentrations increase cell susceptibility to prochelator toxicity in cultured cancer cells. The reduction of the disulfide switch and intracellular iron chelation are confirmed in cell-based assays using calcein as a fluorescent probe for paramagnetic ions. The resulting low-spin Fe(III) complex is identified in intact Jurkat cells by EPR spectroscopy measurements, which also document a decreased concentration of active ribonucleotide reductase following exposure to the prochelator. Cell viability and fluorescence-based assays show that the iron complex presents low cytotoxicity and does not participate in intracellular redox chemistry, indicating that this antiproliferative chelation strategy does not rely on the generation of reactive oxygen species.
Introduction
A reprogrammed metabolism of iron has recently emerged as a characteristic of malignancy.1 This notion is supported by epidemiological studies2 and, at a molecular level, by the altered expression in cancer cells of several key handlers of intracellular iron availability, such as transferrin,3 ferritin4 and ferroportin.5 Given its well-established role in cell proliferation, iron is critical for tumor growth.6 In addition, recent evidence connects this essential nutrient to metastasis and the development of a favorable tumor microenvironment.1 Furthermore, through intracellular redox chemistry,7 iron can promote the formation of reactive radical species leading to oxidative damage and mutagenicity, both characteristics of malignant cells.
The accumulating evidence on the complex relationship between iron and cancer motivates the synthesis and study of chelator molecules capable of capturing iron ions in biological settings.6 Such compounds are expected to provide new tools in cancer treatment8 and determination of prognosis.9 Several iron chelators, such as desferrioxamine (DFO), are commonly employed in the clinic for the treatment of iron overload disorders,10 and testing in the context of cancer chemotherapy revealed their promising antiproliferative behaviour.11 The susceptibility of cancer cells to iron deprivation is therefore being pursued as a therapeutic opportunity.
Prochelation strategies, in which the chelator is activated in response to a triggering event, increase the selectivity of biologically active chelators and are therefore addressing a contemporary challenge in the design of chelation approaches targeting conditions, such as cancer and neurodegenerative disorders, that are not characterized by systemic metal overload.12–14 For instance, in several approaches targeting neurodegenerative diseases, prochelators are activated by action of an enzyme (e.g., β-glucosidase, acetylcholinesterase),15, 16 photoirradiation17 or by reactivity with an intracellular species such as hydrogen peroxide.18, 19
We have recently developed a prochelation strategy based on the thiosemicarbazone tridentate scaffold,20 which characterizes a large number of biologically active metal scavengers.21 This approach incorporates a redox-directed activation step employing a disulfide bond as a switch of chelation, which allows iron binding to occur only after reduction to the corresponding thiolate (Scheme 1). Because of their stability in the bloodstream and cleavage at intracellular levels of glutathione (GSH), disulfide bonds are increasingly employed in drug delivery systems and nanomaterials for biological applications.22 In addition, because of the higher GSH concentrations in cancer cells as compared to the neighbouring normal tissue,23 disulfide linkages are found in effective anti-cancer prodrugs.24–27 Our disulfide-based prochelation strategy is therefore expected to not only protect the chelator from unwanted metal binding in the bloodstream, but also lead to preferential activation and iron sequestration in malignant cells.
Scheme 1.

Reduction of a disulfide switch for the activation of an antiproliferative thiosemicarbazone chelator.
A disulfide bond was employed to mask one of the sulfur atoms in the S,N,S donor set of a thiosemicarbazone ligand, affording a prochelator ((TC1-S)2, Scheme 1) that does not bind iron ions in neutral aqueous solutions. Following reduction, the corresponding thiol TC1-SH readily coordinates iron in a 2:1 ligand-to-metal stoichiometry. This ligand stabilizes iron in its trivalent oxidation state, and therefore coordination of Fe(II) occurs concurrently to oxidation, yielding a stable Fe(III) complex.20
Prochelator (TC1-S)2 displayed antiproliferative activity in SK-N-MC (neuroepithelioma) and MDA-MB-231 (breast adenocarcinoma) cells with IC50 values in the low micromolar range,20 similar to those associated with antiproliferative chelator DFO. Notably, (TC1-S)2 was significantly less toxic than DFO in normal lung fibroblasts.
Herein, we sought to follow the fate of the prochelator through its reduction/activation and iron coordination in the intracellular environment. Furthermore, we investigated the redox properties of the metal complex in order to ascertain whether Fe(III)/Fe(II) redox cycling and ensuing oxidative damage contribute to the toxicity of this chelation system.
Experimental
Materials and instruments
(TC1-S)2, TC1-SH, [(TC1-S)2Fe][BF4]20 and salicylaldehyde isonicotinoyl hydrazone (SIH)28 were prepared as previously reported. Desferrioxamine mesylate salt (Aldrich) and human holo-transferrin (Aldrich) were obtained commercially and used as received. Stock solutions of Calcein-AM (AnaSpec) and DCFH2-DA (Invitrogen) were prepared in DMSO, aliquoted in single-use doses and stored at −20 °C. All other chemicals were purchased from common commercial sources and used without further purification.
UV-visible absorption spectra were obtained on an Agilent 8453 spectrophotometer. Fluorescence measurements were conducted on a Thermo Spectronic Aminco Bowman Series 2 Luminescence Spectrometer. Absorption and fluorescence assays in 96-well plates were recorded on a BioTek Synergy™ 2 microplate reader at the indicated wavelengths. The continuous-wave (CW) EPR experiments were carried out at the University of Arizona EPR Facility on a X-band EPR spectrometer Elexsys E500 (Bruker) equipped with the ESR900 flow cryostat (Oxford instruments).
In vitro assays
Reduction in GSH/GSSG buffer
All buffered aqueous solutions (50 mM PIPES, pH 7.40) were degassed with four freeze-pump-thaw cycles. The spectral changes corresponding to the reduction of (TC1-S)2 to TC1-SH in GSH solutions are shown in Fig. 1a. For the determination of the percentage of reduced chelator at various half-cell potentials (Fig. 1b), ten sets of GSH/GSSG redox buffer solutions were prepared. For each set, reduced (GSH) and oxidized (GSSG) glutathione concentrations were selected to give the desired half-cell potentials (−350 ≤ Ehc ≤ −100 mV) while maintaining the total glutathione concentration in the 11–13 mM range. The half-cell potentials were calculated using the Nernst equation featuring the standard reduction potential of GSSG at 25 °C adjusted for pH 7.40 (−264 mV).29 To determine the extent of the reduction of the prochelator at these various potentials, (TC1-S)2 stock solutions were prepared in degassed DMSO and then added to each redox buffer solution to a final concentration of 12.5 μM. After equilibration for 2 h at room temperature, UV-Vis absorption spectra were obtained. The equilibrium concentrations of (TC1-S)2 and TC1-SH were determined from absorbances at 342 nm using the following equations, which assume that (TC1-S)2 and TC1-SH were the only absorbing species in solution (a two-state model as supported by the almost isosbestic behavior of the traces in Fig. 1a):
| (1) |
| (2) |
| (3) |
where [(TC1-S)2]0 is the initial concentration of disulfide, Aobs is the observed absorbance for the solution after equilibration, Amax is the initial absorbance of disulfide, and Amin refers to the absorbance of the solution after all disulfide has been converted to the thiol. Measurements were conducted in triplicate and reported as average ± standard deviation.
Fig. 1.

UV-visible absorption study of the reduction of disulfide prochelator (TC1-S)2 in buffered aqueous solutions (50 mM PIPES, pH 7.40) at 25 °C. a) Spectral changes during the reduction of (TC1-S)2 (blue, 9.0 μM) to TC1-SH (red) by GSH (11.0 mM). The reaction goes to completion within 2 h. b) Fraction of reduced chelator TC1-SH after equilibration in GSH/GSSG redox buffer solutions at different half-cell potentials (Ehc, bottom axis) corresponding to given [GSH]/[GSSG] ratios (top axis). The total glutathione concentration ([GSH]+[GSSG]) was maintained at 11–13 mM, whereas initial [(TC1-S)2]0 was 12.5 μM. Samples were allowed to equilibrate for 2 h.
Benzoate hydroxylation
Stock solutions of ligands were prepared in methanol (for TC1-SH) or ultrapure water (for DFO and EDTA). Ligand stock solutions were added to test solutions prepared in 10 mM phosphate buffer (pH 7.40) and containing benzoate. The amount of methanol (0.46% v/v) was maintained the same in all test solutions. Following addition of FeSO4, the hydroxylation reaction was initiated by addition of 30% H2O2. The final volume of each test solution was 3000 μL, containing 1.0 mM benzoate, 30 μM Fe(II), 1 mM H2O2, and varying concentrations of ligands as indicated (Fig. 5). Test solutions were incubated for 3 h at room temperature, and then fluorescence emission was measured at 410 nm (ex. 290 nm). Measurements were conducted in triplicate and reported as average ± standard deviation.
Fig. 5.

Effect of TC1-SH and DFO on the extent of benzoate hydroxylation leading to fluorescent salicylate(s) (ex: 290 nm, em: 410 nm) in the presence of Fe(II) ions (30 μM) and H2O2 (1.0 mM). All solutions were prepared in phosphate buffer (10 mM, pH 7.40) and incubated for 3 h following addition of H2O2. EDTA (30 μM) was employed as a positive control.
Cell culture and cell-based assays
MDA-MB-231 (ATCC® HTB-26™) breast adenocarcinoma cells and SK-N-MC (ATCC® HTB-10™) neuroepithelioma cells were cultured under a 5% CO2 humidified atmosphere at 37 °C in Eagle’s Minimal Essential Medium (EMEM) supplemented with 10% fetal bovine serum (FBS), glutamine (2 mM), sodium pyruvate (1 mM), sodium bicarbonate (1.5 g/L), penicillin (100 units/mL), streptomycin (100 μg/mL), and 1.25 μM (1 mg/10 mL) human holo-transferrin (Aldrich) prior to use. Jurkat T lymphocytes (ATCC® T1B-152™) were cultured in suspension at 37 °C under a 5% CO2 humidified atmosphere in RPMI 1640 medium supplemented with 10% FBS, penicillin (5 mg/ml) and streptomycin (1 mg/ml), and maintained at a density lower than 2.0 × 10⁶ cells/mL.
MTT (3-(4,5-dimethylthiazol-2-yl)-2,5-diphenyltetrazolium bromide) proliferation assays were conducted by standard methods as previously described.20
Effect of NAC supplementation
MDA-MB-231 cells were seeded in 96-well plates (8.0 × 10⁴ cells/well) and allowed to incubate for 18 h. Stock solutions of N-acetyl cysteine (NAC) were freshly prepared in growth media, added and allowed to incubate for additional 6 h (total of 24 h before treatment). Stock solutions of (TC1-S)2 (in DMSO) and DFO (in PBS buffer) were freshly prepared and diluted with growth media. The amount of DMSO was maintained at 0.01% v/v per well for all experiments. The final concentrations (10 μM) for the test compounds in each well were chosen similar to their IC50 values (MTT, 48 h).20 Cells were incubated in the presence of the test compounds for 48 h, washed with PBS, and then viability was assessed by MTT assays. All experiments were performed in triplicate.
Effect of (TC1-S)2 on calcein fluorescence emission
Jurkat cells (1.0 × 10⁶ cells/mL) were centrifuged, washed with warm PBS, resuspended in PBS containing 0.15 μM calcein-AM, and incubated for 30 min. The cells were then centrifuged and washed to remove extracellular calcein-AM, diluted in basic medium (free of Phenol Red) to 8.0 × 10⁵ cell/mL and incubated for 10 min. Fluorescence measurements (ex. 488 nm, em. 517 nm) were conducted on cell suspensions (3.0 mL) in quartz cuvettes under magnetic stirring. Readings were recorded every 20 s for a total period of 1500 s. DMSO solutions of the test compounds were added and the final concentration of DMSO (after two additions) was maintained at 1% v/v. Control addition of DMSO did not change the emission intensity of the sample (Fig. S1, ESI).
Whole-cell EPR measurements
Jurkat cells (1.8 × 10⁶ cells/mL) were treated with the test compounds and incubated for 1 h or 3 h. The suspension (90 mL) was then centrifuged (1000 rpm, 10 min), and the cells were resuspended in PBS and pelleted (1000 rpm, 10 min). After removal of the supernatant, the pellet was suspended in 200 μL HEPES buffer (50 mM, pH 6.9, 10% glycerol), transferred to an EPR tube, and spun down (1000 rpm, 10 min). The pellet was frozen in cold methanol (−40 °C) and then stored in liquid nitrogen. The total time between the first centrifugation and freezing was less than 30 min.
Detection of oxidative reactivity with DCFH2-DA
MDA-MB-231 cells were seeded in clear-bottomed, black-sided 96-well plates (1.0 × 10⁴ cells/well) and allowed to incubate overnight. The growth medium was then removed, and the adherent cells were incubated in warm PBS containing 10 μM 2′,7′– dihydrodichlorofluorescein diacetate (DCFH2-DA) for 10 min. After removal of the probe solution, the cells were washed with PBS (×2) and then incubated in growth media (100 μL, without Phenol Red) containing the test compounds for 30 min before recording fluorescence emission (ex. 485 nm, em. 528 nm). Measurements were conducted in triplicate and reported as average ± standard deviation.
Results and discussion
Reduction of disulfide switch
The disulfide bond in (TC1-S)2 functions as a switch in our redox-directed chelation approach because its reduction to the corresponding thiols is required to “switch on” iron sequestration. This activation event is expected to occur under the reducing conditions characteristic of the intracellular space, where the glutathione redox buffer (GSH/GSSG) is present in millimolar concentrations and acts as a major regulator of the intracellular redox environment.29, 30
The reduction of (TC1-S)2 can be monitored in vitro by UV-visible absorption spectroscopy (Fig. 1a). In the presence of reduced glutathione (GSH, 11.0 mM) in buffered aqueous solution (pH 7.40), disulfide (TC1-S)2 (9.0 μM) is converted quantitatively to thiol TC1-SH, which is stable in solution for over 6 h.
In order to estimate the speciation of the prochelator/chelator system in solutions containing glutathione levels reflecting biologically relevant conditions, disulfide (TC1-S)2 was allowed to equilibrate in a series of ten redox buffer mixtures. The half-cell potentials for the solutions were calculated based on the concentrations of GSH and GSSG, and they were selected to include values ranging from those typically associated with proliferating cells (−240 mV vs SHE) to those found in necrotic cells (−180 mV).29 Based on the differences in spectral features of (TC1-S)2 and TC1-SH in the 260–400 nm range (as shown for instance in Fig. 1a), the estimated equilibrium percentage of thiol TC1-SH was found to be greater than 80% at half-cell potentials of −200 mV or lower (Fig. 1b).
As genetically encoded biosensors continue to provide new information on the compartmentalization of intracellular redox potentials,31, 32 it is likely that more details on the extent and location of intracellular disulfide reductions will become available. In this simplified model of intracellular conditions containing micromolar chelation system and millimolar glutathione buffer, the chelator after equilibration was found prevalently in its reduced iron-binding form at glutathione half-cell potentials that have been associated to proliferating and malignant cells (Ehc ≤ −220 mV vs SHE).29
The control of redox conditions and equilibration employed in the in-vitro experiments described above cannot be achieved in cell culture;33 however, the intracellular concentration of GSH can be increased by supplementation with N-acetyl cysteine (NAC), a precursor required for GSH biosynthesis.29, 34 NAC supplementation was expected to lead to increased levels of reduced chelator and hence a higher toxicity in cell culture to the extent that the cytotoxicity of (TC1-S)2 correlates with iron depletion (and not with oxidative damage, vide infra). This effect was indeed observed in breast adenocarcinoma (MDA-MD-231) cell cultures, in which (TC1-S)2 was previously found cytotoxic with a 4.6 μM IC50 (48 h).20 In viability assays conducted at a fixed (TC1-S)2 concentration (10.0 μM), cells were more susceptible to (TC1-S)2 in the presence of increasing amounts of NAC (Fig. 2). In contrast, the effect of antiproliferative siderofore DFO (IC50 17.0 μM in MDA-MD-231 cells, 48 h), which does not require a reduction/activation step, was not affected significantly by NAC concentrations in these assays.
Fig. 2.

Effect of NAC supplementation on the toxicity of DFO (gray, 10 μM) and (TC1-S)2 (blue, 10 μM). MDA-MB-231 cells were incubated with NAC for 6 h before treatment with DFO (10.0 μM) or (TC1-S)2 (10.0 μM) for 48 h. Percent viability, assessed using MTT proliferation assays, is expressed relative to control samples treated with DMSO. Statistical analysis refers to cultures treated with test compound (DFO or (TC1-S)2) but no NAC (left bars, [NAC] = 0), * p < 0.01.
Collectively, these experiments indicate that the reduction of the disulfide switch in (TC1-S)2 falls within the range of potentials that are relevant to the intracellular concentrations of glutathione redox buffer. The extent of such reduction correlates with changes in total GSH concentrations (Fig. 1b) that are associated with life cycle transitions (for instance, from differentiation to proliferation) and with higher toxicity in more reducing conditions in live cultured cells (Fig. 2). Because rapidly dividing cancer cells typically present higher [GSH]/[GSSG] ratios as compared to the neighboring normal tissue,23, 35 these findings probing the reduction of (TC1-S)2 could lead to the preferential activation of the chelation system in more reducing tumor tissue.
Intracellular iron binding
Thiol TC1-SH readily coordinates Fe(II) ions in organic and aqueous solutions in a 2:1 ligand-to-metal stoichiometry complex, which is concurrently oxidized to a Fe(III) species in the presence of trace oxygen.20 This low-spin ferric complex was anticipated to form intracellularly upon reduction of disulfide (TC1-S)2 and subsequent iron coordination. We therefore sought to confirm the formation of this species in live cultured cells upon exposure to the pro-chelator (TC1-S)2.
Intracellular iron binding was first examined using calcein-AM, the acetoxymethyl ester of a fluorescein-based sensor of metal ions in biological specimens. Trapped intracellularly upon hydrolysis of the ester groups by cytosolic esterases, calcein coordinates iron and other (far less abundant) cations (e.g., Cu(II), Zn(II)). Coordination of paramagnetic ions quenches considerably its fluorescence, and changes in calcein fluorescence intensity are correlated with variations in intracellular iron concentrations.36 In cells that have been loaded with calcein, addition of a chelator competing for metal coordination causes real-time increases in emission intensity as the probe is partially liberated from the paramagnetic ions quenching its fluorescence.36
In a suspension of cultured Jurkat cells (T1B-152, acute T-cell leukemia) loaded with calcein, addition of (TC1-S)2 caused a concentration-dependent increase in fluorescence intensity (Fig. 3), thus indicating a partial displacement of paramagnetic ions from calcein. Subsequent addition of cell-permeating high-affinity chelator SIH further increased fluorescence intensity. Because the prochelator does not coordinate iron ions, these experiments reveal simultaneously the reduction of (TC1-S)2 to the thiol TC1-SH and the subsequent intracellular iron binding.
Fig. 3.
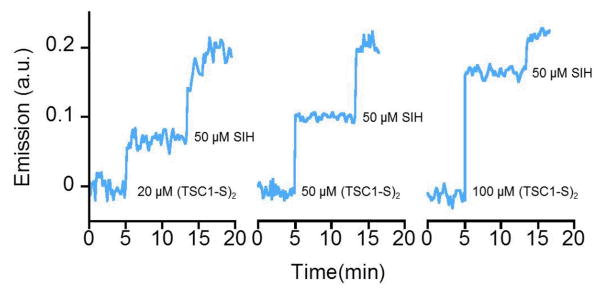
Displacement of paramagnetic ions and restoration of calcein fluorescence by addition of chelators (TC1-S)2 and SIH at the indicated times and final concentrations in suspended Jurkat cell cultures. Initial fluorescence intensity at 517 nm (excitation, 488 nm) was set to zero and real-time increases in signal were recorded upon addition of chelating systems. Addition of DMSO alone as a control does not cause an increase in signal (Fig. S1, ESI).
The effect of exposure of Jurkat cells to (TC1-S)2 was also investigated by CW EPR spectroscopy. As reported for several leukemia cell lines,37–39 the g ~ 2 region of the EPR spectrum of untreated cells at 30 K is dominated by the signal of the tyrosyl radical (Tyr•) within the β2 subunit of ribonucleotide reductase (RNR), the iron-dependent enzyme essential in DNA biosynthesis (Fig. 4, trace 1). The amplitude of this signal, which correlates to enzyme activity, is reduced by incubation of cells in the presence of iron chelators.37, 39–41 As such, the inhibition of DNA synthesis is being investigated as a component of the mechanism of action of antiproliferative iron chelators.21, 42
Fig. 4.

EPR spectra of intact Jurkat cells: 1) untreated cells, 2) after treatment with 50 μM DFO for 3 hours, and 3) after treatment with 50 μM (TC1-S)2 for 1 hour. Experimental conditions: microwave frequency, 9.338 GHz; microwave power, 2 mW; magnetic field modulation amplitude, 0.5 mT; temperature, 30 K.
In our experimental conditions, exposure to DFO (50 μM, 3 h) led to a significant signal reduction (Fig. 4, trace 2). Treatment with (TC1-S)2 ((50 μM, 1 h or 3 h) resulted in similar decrease of the Tyr• signal and in appearance of a signal characteristic of a low-spin Fe(III) center (Fig. 4, trace 3), which is attributed to the [(TC1-S)2FeIII]+ complex. This assignment is in agreement with our earlier magnetic susceptibility measurements indicating an S = ½ ground state20 and is confirmed by the observation of a similar signal from the synthetic complex [(TC1-S)2FeIII][BF4] in DMSO (Fig. S2, ESI). Additionally, no EPR lines attributable to new high-spin ferric centers were observed in whole-cell samples treated with (TC1-S)2. In contrast, incubation with DFO gave rise to the EPR signal at g ~ 4.3 characteristic of high-spin Fe(III) species (Fig. S3, ESI) as previously reported.37
The EPR spectrum of [(TC1-S)2FeIII]+, with turning points at g = (2.135, 2.110, 2.006), is quite narrow when compared to low-spin ferric heme complexes.43 The observed g values are similar to those reported for other hexacoordinate low-spin ferric centers bound to thiosemicarbazones44, 45 or Schiff base ligands featuring sulfur donors.46, 47
The experiments described in this section, which employed two different spectroscopic techniques in cultured Jurkat cells, confirm the reduction/activation of (TC1-S)2 as well as the intracellular formation of a low-spin Fe(III) complex. The disulfide, which does not coordinate iron ions, behaves as a prochelator and leads to intracellular iron sequestration upon its reduction to thiol TC1-SH. We also observed that one of the intracellular effects of (TC1-S)2 exposure in Jurkat cells is the reduced activity of RNR.
Redox activity of complexes
The toxicity of several thiosemicarbazone-based chelators is associated with oxidative damage caused by their metal complexes, which engage in intracellular redox cycling of the Fe(III)/Fe(II) couple and concomitant generation of reactive oxygen species (ROS) through Fenton-type chemistry.21 Thiosemicarbazone TC1-SH, however, strongly stabilizes iron in its trivalent oxidation state and, as observed for DFO and other iron scavengers,10, 48 readily leads to the formation of the oxidized Fe(III) complex upon binding of Fe(II) ions. Consistently, electrochemical characterization of the ferric complex by cyclic voltammetry presented an irreversible cathodic event assigned to the Fe(III)/Fe(II) couple. 20 TC1-SH was thus expected to exclude iron ions from intracellular redox cycling and hence from participating in ROS generation. This expectation was assessed both in vitro and in live cultured cells.
The redox activity of the iron complex(es) of TC1-SH was first investigated in vitro using the benzoate hydroxylation assay, which monitors the hydroxylation of non-fluorescent benzoate ions to fluorescent salicylates in the presence of Fe(II) ions and H2O2.49 Because complexation alters the Fe(III)/Fe(II) reduction potential, iron-coordinating ligands can enhance or diminish the extent of benzoate hydroxylation relative to the aqueous Fe(II)/H2O2 system. In addition, ligands and complexes can act as scavengers of ROS and interfere with benzoate hydroxylation. EDTA, which facilitates Fenton-type reactivity, was selected as a positive control; conversely, DFO was employed as an established negative control in this assay.50 Similar to the latter, TC1-SH decreased the Fenton redox activity of the Fe(II)/H2O2 system as indicated by the lower levels of salicylate fluorescence intensity (Fig. 5).
These in-vitro observations were reproduced in cultures of MBA-MD-231 breast carcinoma cells using a fluorescence-based assay of ROS generation. Added to the growth media, cell-permeating dihydrodichlorofluorescein diacetate (DCFH2-DA) is hydrolysed intracellularly to trap the dihydrodichlorofluorescein (DCFH2) probe, which is oxidized by several ROS (e.g., OH•, NO2•, CO3•−) to give the bright fluorescent product dichlorofluorescein.51 DCFH2 does not react directly with H2O2,51 and an excess of hydrogen peroxide is commonly used to enable metal-mediated generation of ROS as a positive control in cell-based assays.52 As in the iron-mediated benzoate hydroxylation assay (Fig. 5), addition of disulfide prochelator (TC1-S)2 and thiol TC1-SH did not elicit significant turn-on response of the fluorescent probe relative to the positive control (Fig. 6). In addition, no generation of ROS was detected for cells treated with the preformed and isolated iron complex [(TC1-S)2Fe][BF4].
Fig. 6.

Intracellular generation of ROS monitored through the oxidation of DCFH2 to fluorescent DCF (ex: 485 nm, em: 528 nm). MDA-MB-231 cells were treated with DCFH2-DA (10 μM, 10 min), washed and then incubated with test compounds (concentrations as shown, 30 min). H2O2 (100 μM) was employed as a positive control.
Finally, consistent with the formation of a redox-inactive complex, the Fe(III) species [(TC1-S)2Fe][BF4] presents low cytotoxicity in MDA-MB231 and SK-N-MC human cells, with IC50 values greater than 30 μM in MTT viability assays in both cell lines (Table S1, ESI).
Taken together, the data collected on redox chemistry in vitro and in live cell cultures indicate that the (TC1-S)2/TC1-SH chelation system does not lead to the formation of ROS and excludes iron ions from redox reactivity in simulated biological conditions. Although a reduction event is responsible for the activation of prochelators in this approach, the resulting metal complexes are not involved in intracellular redox chemistry.
Conclusions
The introduction of a disulfide bond in the donor set of a thiosemicarbazone moiety led to a prochelator system that can be switched on by reduction to the corresponding thiol. The experimental findings described herein indicate that such reduction/activation is operational in biological settings. In-vitro experiments in glutathione buffer show that the reduction of (TC1-S)2 occurs at GSH concentrations and half-cell potentials that are relevant to the intracellular conditions. The increased toxicity of the prochelator in response to increased intracellular thiol levels (by NAC supplementation) supports the notion of a redox-directed activation leading to enhanced toxicity.
Following reduction, chelator TC1-SH readily binds iron ions to form a low-spin Fe(III) complex. The data presented in this study demonstrate that this species is formed intracellularly. Fluorescence-based assays employing prochelator (TC1-S)2 indicate that the activated chelator generated upon reduction is capable of displacing iron ions from other metal-binding species (i.e., fluorescent sensor calcein in these experiments) in cultured cells. Furthermore, EPR experiments in whole Jurkat cells provided direct evidence for the formation of the low-spin Fe(III) complex [(TC1-S)2Fe]+ as documented by its distinct spectral features. Our EPR data also indicate that this chelation system leads to a decrease in the signal amplitude for the tyrosyl radical of RNR, which correlates with loss of activity of this essential enzyme for DNA biosynthesis. Finally, fluorescence-based assays both in vitro and in live cells did not report ROS generation in this chelation approach, which is characterized by the marked stabilization of a low-spin Fe(III) center within the complex.
Collectively, the observations described in this study indicate that the antiproliferative activity of prochelator (TC1-S)2 can be attributed to the reduction to chelator TC1-SH and to the ensuing intracellular iron sequestration (and related downstream effects), but not to oxidative damage resulting from redox chemistry of the formed iron complexes.
Within the large family of antiproliferative thiosemicarbazone chelators, our thiolate system offers the opportunity to evaluate the S,N,S donor set. TC1-SH shares with α-pyridyl thiosemicarbazones the ability to form low-spin ferric complexes. Unlike the ferric complex investigated herein, however, such complexes carrying the N,N,S donor set are redox active under physiological conditions, and their ability to generate ROS is considered a key component of their pronounced antitumor efficacy.21 Future structure-activity relationship studies will determine the requirements for Fe(II) stabilization and the effect of potential Fe(III)/Fe(II) redox cycling on the toxicity of disulfide-based thiosemicarbazone chelators. Additionally, synthetic modifications are expected to alter the disulfide reduction potential as well as the lipophilicity and cell permeability of the prochelators, which will also be the subject of upcoming studies. Because copper coordination plays a role in the mechanism of action of several thiosemicarbazones including potent Dp44mT,53 we will investigate the ability of TC1-SH and its analogues to bind Cu(II), as well as the biological activity of complexes thereof.
We have shown that the incorporation of disulfide switches in the primary coordination sphere of biological metal scavengers is a valid strategy for the design of redox-directed chelation approaches. The elevated [GSH]/[GSSG] ratios that characterize highly proliferating malignant cells compared to neighboring normal tissue could offer an environment for preferential activation of these constructs. As new details on the dynamic nature and compartmentalization of intracellular redox potentials continue to emerge, reduction/activation strategies could be tailored to specific intracellular conditions. These considerations provide an incentive for the investigation of disulfide switches in varying chelating scaffolds and targeting strategies.
Supplementary Material
Acknowledgments
This work was supported by the University of Arizona. A.V.A. gratefully acknowledges the NSF (DBI-0139459, DBI-9604939, BIR-9224431) and NIH (S10RR020959, S10RR026416-01) grants for the development of the EPR facility at the University of Arizona.
Footnotes
Electronic Supplementary Information (ESI) available: Control measurements for fluorescence and EPR experiments using Jurkat cells, cytotoxicity data for complex [(TC1-S)2FeIII]+ in SK-N-MC and MDA-MB-231 cells. See DOI: 10.1039/b000000x/
Notes and references
- 1.Torti SV, Torti FM. Nat Rev Cancer. 2013;13:342–355. doi: 10.1038/nrc3495. [DOI] [PMC free article] [PubMed] [Google Scholar]
- 2.Beguin Y, Aapro M, Ludwig H, Mizzen L, Osterborg A. Crit Rev Oncol Hematol. 2014;89:1–15. doi: 10.1016/j.critrevonc.2013.10.008. [DOI] [PubMed] [Google Scholar]
- 3.Daniels TR, Bernabeu E, Rodriguez JA, Patel S, Kozman M, Chiappetta DA, Holler E, Ljubimova JY, Helguera G, Penichet ML. Biochim Biophys Acta, Gen Subj. 2012;1820:291–317. doi: 10.1016/j.bbagen.2011.07.016. [DOI] [PMC free article] [PubMed] [Google Scholar]
- 4.Shpyleva SI, Tryndyak VP, Kovalchuk O, Starlard-Davenport A, Chekhun VF, Beland FA, Pogribny IP. Breast Cancer Res Treat. 2011;126:63–71. doi: 10.1007/s10549-010-0849-4. [DOI] [PubMed] [Google Scholar]
- 5.Pinnix ZK, Miller LD, Wang W, D’Agostino R, Jr, Kute T, Willingham MC, Hatcher H, Tesfay L, Sui G, Di X, Torti SV, Torti FM. Sci Transl Med. 2010;2 doi: 10.1126/scisignal.3001127. [DOI] [PMC free article] [PubMed] [Google Scholar]
- 6.Richardson DR, Kalinowski DS, Lau S, Jansson PJ, Lovejoy DB. Biochim Biophys Acta. 2009;1790:702–717. doi: 10.1016/j.bbagen.2008.04.003. [DOI] [PubMed] [Google Scholar]
- 7.Koskenkorva-Frank TS, Weiss G, Koppenol WH, Burckhardt S. Free Radic Biol Med. 2013;65:1174–1194. doi: 10.1016/j.freeradbiomed.2013.09.001. [DOI] [PubMed] [Google Scholar]
- 8.Kalinowski DS, Richardson DR. Pharmacol Rev. 2005;57:547–583. doi: 10.1124/pr.57.4.2. [DOI] [PubMed] [Google Scholar]
- 9.Miller LD, Coffman LG, Chou JW, Black MA, Bergh J, D’Agostino R, Jr, Torti SV, Torti FM. Cancer Res. 2011;71:6728–6737. doi: 10.1158/0008-5472.CAN-11-1870. [DOI] [PMC free article] [PubMed] [Google Scholar]
- 10.Bernhardt PV. Dalton Trans. 2007:3214–3220. doi: 10.1039/b708133b. [DOI] [PubMed] [Google Scholar]
- 11.Hoke EM, Maylock CA, Shacter E. Free Radic Biol Med. 2005;39:403–411. doi: 10.1016/j.freeradbiomed.2005.03.029. [DOI] [PubMed] [Google Scholar]
- 12.Perez LR, Franz KJ. Dalton Trans. 2010;39:2177–2187. doi: 10.1039/b919237a. [DOI] [PMC free article] [PubMed] [Google Scholar]
- 13.Scott LE, Orvig C. Chem Rev. 2009;109:4885–4910. doi: 10.1021/cr9000176. [DOI] [PubMed] [Google Scholar]
- 14.Zheng H, Fridkin M, Youdim MBH. Mini-Rev Med Chem. 2012;12:364–370. doi: 10.2174/138955712800493898. [DOI] [PubMed] [Google Scholar]
- 15.Zheng H, Youdim MBH, Fridkin M. ACS Chem Biol. 2010;5:603–610. doi: 10.1021/cb900264w. [DOI] [PubMed] [Google Scholar]
- 16.Scott LE, Telpoukhovskaia M, Rodriguez-Rodriguez C, Merkel M, Bowen ML, Page BDG, Green DE, Storr T, Thomas F, Allen DD, Lockman PR, Patrick BO, Adam MJ, Orvig C. Chem Sci. 2011;2:642–648. [Google Scholar]
- 17.Li M, Liu Z, Ren J, Qu X. Chem Sci. 2012;3:868–873. [Google Scholar]
- 18.Kielar F, Helsel ME, Wang Q, Franz KJ. Metallomics. 2012;4:899–909. doi: 10.1039/c2mt20069d. [DOI] [PMC free article] [PubMed] [Google Scholar]
- 19.Dickens MG, Franz KJ. ChemBioChem. 2010;11:59–62. doi: 10.1002/cbic.200900597. [DOI] [PMC free article] [PubMed] [Google Scholar]
- 20.Chang TM, Tomat E. Dalton Trans. 2013;42:7846–7849. doi: 10.1039/c3dt50824b. [DOI] [PubMed] [Google Scholar]
- 21.Yu Y, Kalinowski DS, Kovacevic Z, Siafakas AR, Jansson PJ, Stefani C, Lovejoy DB, Sharpe PC, Bernhardt PV, Richardson DR. J Med Chem. 2009;52:5271–5294. doi: 10.1021/jm900552r. [DOI] [PubMed] [Google Scholar]
- 22.Lee MH, Yang Z, Lim CW, Lee YH, Dongbang S, Kang C, Kim JS. Chem Rev. 2013;113:5071–5109. doi: 10.1021/cr300358b. [DOI] [PubMed] [Google Scholar]
- 23.Gamcsik MP, Kasibhatla MS, Teeter SD, Colvin OM. Biomarkers. 2012;17:671–691. doi: 10.3109/1354750X.2012.715672. [DOI] [PMC free article] [PubMed] [Google Scholar]
- 24.Chen SY, Zhao XR, Chen JY, Chen J, Kuznetsova L, Wong SS, Ojima I. Bioconjugate Chem. 2010;21:979–987. doi: 10.1021/bc9005656. [DOI] [PMC free article] [PubMed] [Google Scholar]
- 25.Wen HY, Dong HQ, Xie WJ, Li YY, Wang K, Pauletti GM, Shi DL. Chem Commun. 2011;47:3550–3552. doi: 10.1039/c0cc04983b. [DOI] [PubMed] [Google Scholar]
- 26.Lee MH, Kim JY, Han JH, Bhuniya S, Sessler JL, Kang C, Kim JS. J Am Chem Soc. 2012;134:12668–12674. doi: 10.1021/ja303998y. [DOI] [PubMed] [Google Scholar]
- 27.Wu XM, Sun XR, Guo ZQ, Tang JB, Shen YQ, James TD, Tian H, Zhu WH. J Am Chem Soc. 2014;136:3579–3588. doi: 10.1021/ja412380j. [DOI] [PubMed] [Google Scholar]
- 28.Edward JT, Gauthier M, Chubb FL, Ponka P. J Chem Eng Data. 1988;33:538–540. [Google Scholar]
- 29.Schafer FQ, Buettner GR. Free Radical Biol Med. 2001;30:1191–1212. doi: 10.1016/s0891-5849(01)00480-4. [DOI] [PubMed] [Google Scholar]
- 30.Banerjee R. J Biol Chem. 2012;287:4397–4402. doi: 10.1074/jbc.R111.287995. [DOI] [PMC free article] [PubMed] [Google Scholar]
- 31.Dardalhon M, Kumar C, Iraqui I, Vernis L, Kienda G, Banach-Latapy A, He T, Chanet R, Faye G, Outten CE, Huang ME. Free Radic Biol Med. 2012;52:2254–2265. doi: 10.1016/j.freeradbiomed.2012.04.004. [DOI] [PMC free article] [PubMed] [Google Scholar]
- 32.Morgan B, Ezerina D, Amoako TNE, Riemer J, Seedorf M, Dick TP. Nat Chem Biol. 2013;9:119–125. doi: 10.1038/nchembio.1142. [DOI] [PubMed] [Google Scholar]
- 33.Flohé L. Biochim Biophys Acta, Gen Subj. 2013;1830:3139–3142. doi: 10.1016/j.bbagen.2012.10.020. [DOI] [PubMed] [Google Scholar]
- 34.Yu Y, Rahmanto YS, Hawkins CL, Richardson DR. Mol Pharmacol. 2011;79:921–931. doi: 10.1124/mol.111.071324. [DOI] [PubMed] [Google Scholar]
- 35.Yeh CC, Hou MF, Wu SH, Tsai SM, Lin SK, Hou LA, Ma H, Tsai LY. Cell Biochem Funct. 2006;24:555–559. doi: 10.1002/cbf.1275. [DOI] [PubMed] [Google Scholar]
- 36.Epsztejn S, Kakhlon O, Glickstein H, Breuer W, Cabantchik ZI. Anal Biochem. 1997;248:31–40. doi: 10.1006/abio.1997.2126. [DOI] [PubMed] [Google Scholar]
- 37.Cooper CE, Lynagh GR, Hoyes KP, Hider RC, Cammack R, Porter JB. J Biol Chem. 1996;271:20291–20299. doi: 10.1074/jbc.271.34.20291. [DOI] [PubMed] [Google Scholar]
- 38.McCue JM, Link KL, Eaton SS, Freed BM. J Immunol. 2000;165:6771–6775. doi: 10.4049/jimmunol.165.12.6771. [DOI] [PubMed] [Google Scholar]
- 39.Eberhard Y, McDermott SP, Wang X, Gronda M, Venugopal A, Wood TE, Hurren R, Datti A, Batey RA, Wrana J, Antholine WE, Dick J, Schimmer AD. Blood. 2009;114:3064–3073. doi: 10.1182/blood-2009-03-209965. [DOI] [PubMed] [Google Scholar]
- 40.Aye Y, Long MJC, Stubbe J. J Biol Chem. 2012;287:35768–35778. doi: 10.1074/jbc.M112.396911. [DOI] [PMC free article] [PubMed] [Google Scholar]
- 41.Popovic-Bijelic A, Kowol CR, Lind MES, Luo J, Himo F, Enyedy EA, Anion VB, Graslund A. J Inorg Biochem. 2011;105:1422–1431. doi: 10.1016/j.jinorgbio.2011.07.003. [DOI] [PMC free article] [PubMed] [Google Scholar]
- 42.Shao J, Zhou B, Chu B, Yen Y. Curr Cancer Drug Targets. 2006;6:409–431. doi: 10.2174/156800906777723949. [DOI] [PubMed] [Google Scholar]
- 43.Nishida Y, Oshio S, Kida S. Inorg Chim Acta. 1977;23:59–61. [Google Scholar]
- 44.Sreekanth A, Kurup MRP. Polyhedron. 2004;23:969–978. [Google Scholar]
- 45.Garg BS, Kurup MRP, Jain SK, Bhoon YK. Transition Met Chem. 1988;13:247–249. [Google Scholar]
- 46.Jackson HL, Shoner SC, Rittenberg D, Cowen JA, Lovell S, Barnhart D, Kovacs JA. Inorg Chem. 2001;40:1646–1653. doi: 10.1021/ic001271d. [DOI] [PMC free article] [PubMed] [Google Scholar]
- 47.Shoner SC, Barnhart D, Kovacs JA. Inorg Chem. 1995;34:4517–4518. [Google Scholar]
- 48.Boukhalfa H, Reilly SD, Michalczyk R, Iyer S, Neu MP. Inorg Chem. 2006;45:5607–5616. doi: 10.1021/ic060196p. [DOI] [PubMed] [Google Scholar]
- 49.Kalinowski DS, Sharpe PC, Bernhardt PV, Richardson DR. J Med Chem. 2007;50:6212–6225. doi: 10.1021/jm070839q. [DOI] [PubMed] [Google Scholar]
- 50.Richardson DR, Sharpe PC, Lovejoy DB, Senaratne D, Kalinowski DS, Islam M, Bernhardt PV. J Med Chem. 2006;49:6510–6521. doi: 10.1021/jm0606342. [DOI] [PubMed] [Google Scholar]
- 51.Kalyanaraman B, Darley-Usmar V, Davies KJA, Dennery PA, Forman HJ, Grisham MB, Mann GE, Moore K, Roberts LJ, II, Ischiropoulos H. Free Radic Biol Med. 2012;52:1–6. doi: 10.1016/j.freeradbiomed.2011.09.030. [DOI] [PMC free article] [PubMed] [Google Scholar]
- 52.Karlsson M, Kurz T, Brunk UT, Nilsson SE, Frennesson CI. Biochem J. 2010;428:183–190. doi: 10.1042/BJ20100208. [DOI] [PubMed] [Google Scholar]
- 53.Lovejoy DB, Jansson PJ, Brunk UT, Wong J, Ponka P, Richardson DR. Cancer Res. 2011;71:5871–5880. doi: 10.1158/0008-5472.CAN-11-1218. [DOI] [PubMed] [Google Scholar]
Associated Data
This section collects any data citations, data availability statements, or supplementary materials included in this article.