

Abstract
Mithramycin is a neoplastic antibiotic synthesized by various Streptomyces bacteria. It is under investigation as a chemotherapeutic treatment for a wide variety of cancers. Ongoing and forthcoming clinical trials will require pharmacokinetic analysis of mithramycin in humans, both to see if target concentrations are achieved and to optimize dosing and correlate outcomes (response/toxicity) with pharmacokinetics. Two published methods for mithramycin quantitation exist, but both are immunoassays that lack current bioanalytical standards of selectivity and sensitivity. To provide an upgraded and more widely applicable assay, a UPLC-MS/MS method for quantitation of mithramycin in human plasma was developed. Solid phase extraction allowed for excellent recoveries (>90%) necessary for high throughput analyses on sensitive instrumentation. However, a ~55% reduction in analyte signal was observed as a result of plasma matrix effects. Mithramycin and the internal standard chromomycin were separated on a Waters Acquity BEH C18 column (2.1x50mm, 1.7um) and detected using electrospray ionization operated in the negative mode at mass transitions m/z 1083.5→268.9 and 1181.5→269.0, respectively, on an AB Sciex QTrap 5500. The assay range was 0.5–500 ng/mL and proved to be linear (r2>0.996), accurate (≤10% deviation), and precise (CV<15%). Mithramycin was stable in plasma at room temperature for 24 hours, as well as through three freeze-thaw cycles. This method was subsequently used to quantitate mithramycin plasma concentrations from patients enrolled on two clinical trials at the NCI.
Keywords: Mithramycin, Ultra-HPLC, tandem mass spectrometry
1. Introduction
Mithramycin (Plicamycin, Mitracin) has antibiotic, neuroprotective, and antiproliferative properties. Though it shows potential to treat neurodegenerative diseases such as Huntington’s Disease [1], Alzheimer’s, and Parkinson’s, it has primarily been investigated as an anticancer drug. Mithramycin has been used clinically against testicular cancer [2] and leukemia [3], and preclinical studies have shown activity against glioma [4], pancreatic cancer [5], prostate cancer [6], oral squamous cell carcinoma [7], and lung and esophageal cancer [8]. Patients receiving mithramycin often develop hepatotoxicity [9]; various analogs have been developed in an attempt to curtail dose-limiting side effects [10–12].
Mithramycin inhibits RNA synthesis by binding to GC-rich regions of DNA. The resulting complex blocks Sp1 transcription factors, leading to downregulation of multiple oncogenes [13]. The drug also sensitizes cells to apoptosis induced by TNF-related apoptosis-inducing ligand (TRAIL) [14–15]. Another study attributed the antitumor activity of mithramycin to c-myc inhibition and p53 activation [16]. Of particular interest to the trials analyzed here, Grohar et al. showed that mithramycin has in vitro and in vivo activity against the oncogenic fusion transcription factor EWS-FLI1 and the Ewing sarcoma family of tumors it produces [17].
Despite widespread and longstanding interest in this agent’s anticancer potential, only two methods for quantifying the drug have been published [18–19]. Both are immunoassays, and only one measured mithramycin in human plasma [18]. Fujiwara et al. report a comparison of their assay to an HPLC-UV method of unspecified origin, but there is no validation data provided for this method and it has a LLOQ of 10 ng/mL, which lacks sufficient sensitivity for clinical pharmacokinetic applications following standard doses of 17–25 mg/kg.
Presented here is a fully validated UHPLC-MS/MS method for quantifying mithramycin in human plasma at concentrations as low as 0.5 ng/mL. This method uses the gold standard of tandem mass spectrometry (MS/MS) in small molecule detection, which is fast, sensitive, selective, accurate, and precise. The assay calibration range is 0.5–500 ng/mL, with the option to measure concentrations up to 5,000 ng/mL via a 10-fold dilution. This method was used to generate pharmacokinetic data by analyzing samples from patients enrolled on two clinical trials at the NIH (NCT01610570, NCT01624090).
2. Experimental
2.1. Materials
Mithramycin was supplied by Fermentek Ltd (Jerusalem, Israel) to the NCI under an IND held by the CCR. Chromomycin, used as the internal standard, was purchased from Sigma Aldrich (St. Louis, MO, USA). Mixed-mode Evolute® Express 30 mg ABN solid phase extraction (SPE) plates, capable of extracting a wide range of acidic, basic, or neutral molecules, were purchased from Biotage (Charlotte, NC, USA). Optima-grade acetonitrile and methanol were obtained from Fisher Scientific (Fairlawn, NJ, USA) and de-ionized water was generated with a Hydro-Reverse Osmosis system (Durham, NC, USA) connected to a Milli-Q UV Plus purifying system (Billerica, MA, USA). Drug-free human heparinized plasma was obtained from the National Institutes of Health Clinical Center Blood Bank (Bethesda, MD, USA).
2.2. Preparation of stock solutions
Stock solutions were prepared individually by dissolving mithramycin in 50/50 (v/v) methanol/water and chromomycin in ethanol at free base concentrations of 1 mg/mL. After vortex mixing and brief sonication, each stock solution was stored in glass vials at −80 °C. Serial dilutions (working stocks) were prepared in methanol from each individual 1 mg/mL master stock and stored in glass vials at −80 °C for the preparation of calibration standards and quality control (QC) samples. The chemical structures of mithramycin and chromomycin are pictured in Figure 1.
Figure 1.
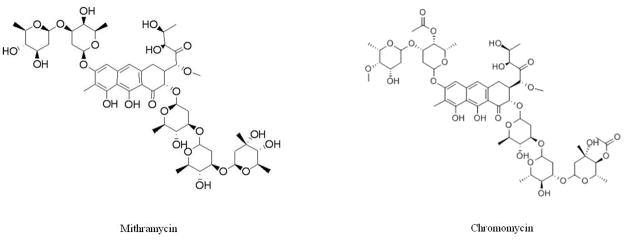
Structures of mithramycin and the internal standard chromomycin.
For each analytical run, calibration standards in drug-free human heparinized plasma were freshly prepared in duplicate at concentrations of 0.5, 1, 2, 5, 25, 50, 100, and 500 ng/mL. Quality control (QC) samples were freshly prepared in quintuplet at concentrations of 0.5 (lower limit of quantification; LLOQ), 1.5 (low-range; LQC), 25 (mid-range; MQC), 400 (high-range; HQC), and 5,000 ng/mL (10-fold dilution; DQC) by adding drug-free heparinized plasma to the required amount of working stock.
2.3. Sample preparation
Two hundred μL of 250 ng/mL chromomycin (aq) was added to 100 μL of plasma calibrator aliquots, QC samples, and study samples of unknown concentration. This mixture was briefly vortexed, then centrifuged for 10 min at 13,200 rpm (11,700 x g) in a mini-centrifuge. The SPE procedure was performed with an Evolute® Express 30 mg ABN plate (Biotage), which was first conditioned with 1 mL of ACN before equilibrated with 1 mL of H2O. A vacuum manifold was used to pull liquid through the membrane into a 96-well 2-mL collection plate. Samples (250 μL) were then loaded into wells before being washed with 1 mL 5% ACN (aq), then eluted with 1 mL of ACN. Samples were dried under nitrogen gas in a TurboVap 96 concentrator, before reconstitution with 100 μL of 50/50 v/v methanol/water.
2.4. Instrument conditions
Ten microliters of each sample was injected onto a Waters Acquity UPLC™ system (Waters Corporation, Milford, MA, USA), which included a binary pump, refrigerated autosampler (4 °C) and a temperature-controlled column compartment (35 °C). Chromatographic separation was achieved on a Waters Acquity BEH C18, 2.1x50 mm, 1.7 μm preceded by a Waters Acquity BEH VanGuard C18 guard column packed with 1.7-μm packing material. The mobile phase consisted of A: 0.1% formic acid in water, and B: 0.1% formic acid in methanol with a flow rate of 0.4 mL/min and a total run time of 5 min. A gradient of mobile phase B was utilized by increasing the initial 20% linearly to 100% over 1.5 min, held there until 3.0 min, then returning to 20% by 4.0 min. The column eluent was directed into a Turbo V ion source, operated in the negative ion mode, before entry into an AB SCIEX QTRAP® 5500 mass spectrometer (AB SCIEX, Framingham, MA, USA). The mass spectrometer was set to monitor the monoisotopes of mithramycin (m/z 1083.5→268.9) and the internal standard chromomycin (m/z 1181.5→269.0) using multiple reaction monitoring (MRM). Universal mass spectrometric settings included capillary voltage of 500 V, cone voltage of 45 V, extractor voltage 7 V, RF Lens 1.0, source temperature of 120 °C, desolvation temperature 450 °C, cone gas flow 100 L/hr, desolvation gas flow 800 L/hr, collision energy of 13, and dwell times of 150 msec. MRM peak integrations and data analyses were performed using the Analyst® program (AB SCIEX, Framingham, MA, USA).
2.5. Validation
2.5.1. Linearity
Calibration curves for mithramycin were constructed by least-squares linear regression analysis of an eight-point calibration curve (0.5–500 ng/mL) by plotting the ratio of the analyte peak area versus the internal standard peak area, using 1/x2 as a weighting factor, where x is the nominal analyte concentration. Calibrator response functions and choice of regression analysis were investigated by calculating correlation coefficients (r2) and the percent deviation (% DEV) for all calibrators.
2.5.2. Accuracy and precision
Accuracy and precision were evaluated by determining mithramycin at four different concentrations of QC samples in five replicates analyzed over four different days. Each run consisted of blank plasma extracts, internal standard only, and calibration standards in duplicate; QC and LLOQ samples in replicates of five, with the LLOQ prepared independently in five different lots of plasma each of the four days (n=20) to confirm selectivity. Accuracy (% DEV) was defined as the percent difference between the mean observed concentration and the nominal concentration. The repeatability of the assay was determined by the within-run precision (WRP) and between-run (BRP), as calculated below.
GM represents the grand mean, MSwit represents within-group mean squared, MSbet represents between-group mean squared, and n represents the number of repetitions. FDA guidelines for bioanalytical validation were followed, with ± 15% variability in accuracy and precision allowed except for the LLOQ, where ± 20% variability is acceptable [20].
2.5.3. Plasma Stability
The stability of mithramycin in plasma at room temperature was assessed over a 24-hr period. Samples at three concentrations (1.5, 25, 400 ng/mL) were either extracted immediately (fresh) or let sit at room temperature in plasma for 24 hours before extraction. The analyte concentration after each period at room temperature was compared to the concentration of freshly prepared samples in the same analytical run.
2.5.3.1. Freeze/Thaw Stability
Stability tests were performed to examine the potential for degradation of mithramycin during freeze/thaw cycles. Samples were assayed at three concentrations (1.5, 25, 400 ng/mL). The samples were subjected to three freeze/thaw cycles at −80 °C, with each freeze cycle lasting at least 12 hr. The analyte concentration after each storage period was compared to the concentration of freshly prepared samples in the same analytical run.
2.5.3.2. Post-Preparative Stability
The post-preparative stability of mithramycin in the injection vials pending analysis in the 4 °C refrigerated autosampler was performed. Samples were re-injected and re-analyzed 24 hr after the initial analysis and compared to the previous values obtained from those same samples.
2.5.3.3. Long-term Stability
The long-term freezer stability of mithramycin in frozen plasma and (50/50, v/v) methanol/water as a stock solution was tested. Low, mid, and high QCs in plasma were analyzed 43 days after preparation and frozen storage at − 80 °C. Low and high concentrations (1 and 100 ng/mL) were prepared from a fresh master stock and one made 3 months prior.
2.5.4. Extraction Recovery and Matrix Effects
The extraction efficiency, or recovery, of the solid-phase extraction was assessed by comparing analyte peak areas from both a low (1 ng/mL; n=5) and high (100 ng/mL; n=5) concentration, both before and after the SPE. For each set, both concentrations (low and high) were assayed in quintuplets by spiking analyte into five different lots of plasma to further demonstrate selective and matrix effects.
Matrix effects from the plasma on the mass spectrometric signal for mithramycin was assessed through direct comparison of samples spiked in plasma to samples spiked in neat solution (50/50 [v/v] methanol/water). Mithramycin peak areas were first analyzed using a low (1 ng/mL; n=3) and a high (100 ng/mL; n=3) calibrator sample spiked into the reconstitution solution (50/50 [v/v] methanol/water). These values were used for comparison to the same concentrations by spiking drug into each of 5 plasma lots after extraction (to avoid discrepancies from extraction efficiency).
2.6. Plasma Protein Binding
A Rapid Equilibrium Dialysis device (Thermo-Fisher Scientific, Waltham MA) was used to measure the fraction of mithramycin bound by plasma proteins, as this is important pharmacologic information that has yet to be reported in the literature. Two hundred μL of plasma spiked with drug (at LQC, MQC, and HQC concentrations in triplicate) was incubated with 350 μL of PBS at 37 °C and placed on an orbital shaker at 100 rpm. Equilibrium was achieved over a 4 hour incubation period [21]. Aliquots were taken from the plasma chamber (for total drug concentration) and the PBS chamber (for unbound drug concentration). The free fraction was calculated as follows: %Free=(Concentration in PBS chamber/Concentration in plasma chamber) x 100%. Therefore, the %Bound=100% - %Free.
2.7. Clinical Application
To demonstrate the applicability of this method for measuring mithramycin clinically, blood samples were collected in lavender top (K2 EDTA) tubes following a six-hour intravenous infusion of the drug. Both trials used the same method of delivery and collection time points at pre-dose, half way through infusion (3 hrs post start), end of infusion (6 hrs post-start) and 0.25, 0.5, 1, 2, 3, 5, 7 hr, and between 9–12 hr post end of infusion.. The National Cancer Institute Institutional Review Board approved these clinical protocols.
3. Results and Discussion
3.1. Specificity
Figure 2 depicts LC-MS/MS chromatograms of a drug-free plasma extract (Fig 2A), the internal standard only (Fig 2B), the LLOQ at 0.5 ng/mL (Fig 2C), and a clinical pharmacokinetic sample taken immediately following a six-hour infusion (Fig 2D). The retention times of mithramycin and the internal standard, chromomycin, were both 1.80 min. The use of ultra-high performance liquid chromatography (UHPLC) provided sharp peaks (~3 sec peak width at 50% height) that were well-resolved and separated from interfering matrix peaks that were eluted following an organic solvent gradient to cleanse the column.
Figure 2.


Chromatograms of A) a blank plasma extract, B) internal standard only extract, C) the lower limit of quantification (LLOQ), and D) a clinical pharmacokinetic sample taken immediately following a six-hour IV infusion.
3.2. Validation
The calibration standards, ranging from 0.5–500 ng/mL, were run in duplicate on each of four days (n=8). The eight calibration standards proved accurate and precise (Table 1), with a mean (± SD) calibration curve linear correlation (r2) of 0.99644 ± 0.00176 (n=4). Four quality control (QC) samples, at low (1.5 ng/mL), mid (25 ng/mL), high (400 ng/mL), and 10-fold diluted (5,000 ng/mL) concentrations, plus a lower limit of quantification (LLOQ) QC were run in quintuplet daily over four days (n=20). All QC levels proved accurate and precise, within the required ≤ 15% (≤ 20% for LLOQ samples) (Table 2). Selectivity was demonstrated with the LLOQ quality control sample by measuring the concentration in five different lots of drug-free human heparinized plasma.
Table 1.
Calibration Linearity
| Nominal (ng/mL) | GM (ng/mL) | SD (ng/mL) | DEV (%) | CV (%) | n |
|---|---|---|---|---|---|
| 0.50 | 0.51 | 0.06 | 2.75 | 5.50 | 8 |
| 1 | 0.97 | 0.05 | −3.00 | 5.59 | 8 |
| 2 | 1.92 | 0.15 | −4.25 | 7.94 | 8 |
| 5 | 5.03 | 0.49 | 0.62 | 9.84 | 8 |
| 25 | 25.41 | 1.14 | 1.63 | 4.49 | 8 |
| 50 | 50.70 | 5.00 | 1.39 | 9.87 | 8 |
| 100 | 103.73 | 7.39 | 3.73 | 7.12 | 8 |
| 500 | 499.48 | 25.66 | −0.10 | 5.14 | 8 |
Abbreviations: GM, grand mean; SD, standard deviation; DEV (%), relative deviation from nominal value; CV (%), coefficient of variation; n, number of replicate observations within each validation run, i.e. two samples at each concentration were run on four separate occasions, for a total (n) of eight samples at each concentration.
Table 2.
Accuracy and Precision
| Nominal (ng/mL) | GM (ng/mL) | SD (ng/mL) | DEV (%) | WRP (%) | BRP (%) | n |
|---|---|---|---|---|---|---|
| 0.5 (LLOQ) | 0.52 | 0.07 | 4.20 | 13.57 | 1.87 | 20 |
| 1.5 (LQC) | 1.65 | 0.15 | 9.83 | 5.50 | 8.57 | 20 |
| 25 (MQC) | 24.43 | 1.09 | −2.27 | 4.39 | 5.50 | 20 |
| 400 (HQC) | 397.55 | 27.40 | −0.61 | 4.76 | 5.61 | 20 |
| 5,000 (DQC) | 4,709.62 | 410.77 | −5.81 | 4.32 | 8.53 | 20 |
Abbreviations: GM, grand mean; SD, standard deviation; DEV (%) relative deviation from nominal value; WRP, within-run precision; n, number of replicate observations within each validation run; BRP, between-run precision (A hyphen indicates MSwit>MSbet, thus BRP cannot be calculated and it was concluded that no additional variation was observed as a result of performing the assay in different runs)
3.3. Stability
Bench-top stability in human plasma at room temperature was assessed up to 24 hours. Mithramycin demonstrated sufficient stability through that time, with <8% difference in measured concentrations from freshly extracted and prepared samples. Freeze/thaw stability was assessed through three freeze/thaw cycles in human plasma. Changes in measured values at each of the three concentrations after each freeze/thaw cycle were all below 11%, indicating no significant degradation (Table 3). The 24-hour post-preparative stability measurements (at 4 °C) were well within the maximum acceptable deviation of 15 % (<6% loss of signal observed), confirming samples extracted from human plasma and reconstituted in (50/50, v/v) methanol/water are able to be reanalyzed the following day once extracted. Long-term stability of mithramycin in frozen plasma (−80 °C) for 43 days showed negligible degradation, with <10% loss of signal at all three concentrations. In (50/50, v/v) methanol/water, mithramycin showed similar negligible degradation after 3 months at −80 °C.
Table 3.
Freeze/Thaw Stability in Plasma
| 1.50 ng/mL (low) | 25 ng/mL (mid) | 400 (high) | ||||
|---|---|---|---|---|---|---|
| Freeze/Thaw Cycles | GM (ng/mL) | DEV from fresh (%) | GM (ng/mL) | DEV from fresh (%) | GM (ng/mL) | DEV from fresh (%) |
| 0 (Fresh) | 1.51 | - | 25.40 | - | 375.58 | - |
| 1 | 1.60 | 6.13 | 25.95 | 2.18 | 416.54 | 10.91 |
| 2 | 1.57 | 4.02 | 25.03 | −1.47 | 366.35 | −2.46 |
| 3 | 1.48 | −1.66 | 27.69 | 9.02 | 371.85 | −0.99 |
Abbreviations: GM, grand mean; DEV (%) relative deviation from nominal value
3.4. Extraction Recovery and Matrix Effects
The mean overall recoveries for mithramycin, estimated by comparing the mass spectrometric signal response of the analyte spiked into 5 different lots of human plasma before extraction versus analyte spiked after extraction at both a low (1 ng/mL; n=5) and a high (100 ng/mL; n=5) concentration, were approximately 92.5% and 93.0%, respectively. Comparison of analyte peak areas between post-extraction plasma and samples prepared in (50/50, v/v) methanol/water resulted in 57.0% and 54.2% signal reduction from plasma matrix effects (compared to clean solution) for the low and high concentrations, respectively.
3.5. Plasma Protein Binding
The bound fraction of mithramycin was consistent across the three concentrations tested. The overall PPB was 79%; previous reports had claimed zero plasma protein binding for mithramycin [21]. Therefore, this data represents the first known published protein binding study that refutes this initial claim of zero protein binding.
3.6. Clinical application
A mean plasma concentration (with standard deviation) vs. time curve is shown in Figure 3, encompassing twenty cycles from twelve patients enrolled in one of the NCI trials. Rich sampling was performed during the first daily dose, where a bi-phasic disposition was evident. Following daily doses for a week (one cycle), mithramycin does not appear to significantly accumulate in the plasma, as shown by peak and trough levels that are consistent between doses. These data show that the analytical method is useful for gathering PK data in early phase clinical trials, where the LLOQ of 0.5 ng/mL is more than sufficient to provide an accurate estimate of the half-life during the terminal phase.
Figure 3.
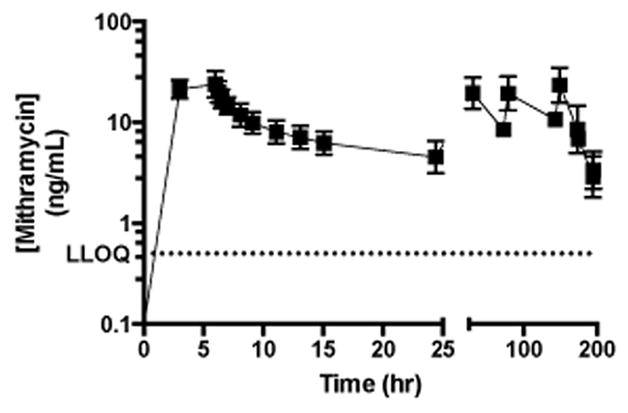
Mean mithramycin plasma concentration vs time curve.
4. Conclusions
Mithramycin is a promising option for treating numerous types of cancer. Two immunoassays for mithramycin were reported over 20 years ago, but a newer and easier method is necessary to provide support for current trials. Described here is a UPLC-MS/MS method for quantitation of mithramycin in human plasma. This method proved sensitive (LLOQ 0.5 ng/mL), selective, accurate, precise, and efficient at recovering drug from plasma (~93% recovery). Mithramycin is stable in plasma at room temperature for 24 hours, in frozen plasma through 3 freeze/thaw cycles and long-term for at least 43 days. Additionally, mithramycin is stable in a (50/50, v/v) methanol/water solution for 24 hr at 4 °C and at least 3 months at −80 °C. The drug is 79% protein bound in plasma, in contrast to the lone literature reference of 0% protein bound. This novel assay was applied to two early phase clinical trials of mithramycin in solid tumors.
Highlights.
A UPLC-MS/MS method for quantitation of mithramycin in human plasma was developed
Solid-phase extraction using mixed-mode sorbent utilized and negative electrospray ionization
Lower limit of quantitation of 500 pg/mL
This method was applied to samples from patients in two clinical trials at the NCI
New data for plasma protein binding of mithramycin is reported
Acknowledgments
This study has been funded in whole with federal funds from the National Cancer Institute, National Institutes of Health.
Abbreviations
- UHPLC
Ultra-high performance liquid chromatography
- MS
mass spectrometry
- MS/MS
tandem mass spectrometry
- QC
Quality control
- LLOQ
Lower limit of quantification
- SPE
solid-phase extraction, NIH, National Institutes of Health
- NCI
National Cancer Institute
- ESI
electrospray ionization
Footnotes
Disclaimer
The content of this publication does not necessarily reflect the views or policies of the Department of Health and Human Services, nor does mention of trade names, commercial products, or organization imply endorsement by the U.S. Government. The views in this manuscript are those of the authors and may not necessarily reflect NIH policy. No official endorsement is intended nor should be inferred.
Publisher's Disclaimer: This is a PDF file of an unedited manuscript that has been accepted for publication. As a service to our customers we are providing this early version of the manuscript. The manuscript will undergo copyediting, typesetting, and review of the resulting proof before it is published in its final citable form. Please note that during the production process errors may be discovered which could affect the content, and all legal disclaimers that apply to the journal pertain.
References
- 1.Ferrante RJ, Ryu H, Kubilus JK, D’Mello S, Sugars KL, Lee J, Lu P, Smith K, Browne S, Beale MF, Kristal BS, Stavrovskaya IG, Hewett S, Rubinsztein DC, Langley B, Ratan RR. J Neurosci. 2004;24:10335–42. doi: 10.1523/JNEUROSCI.2599-04.2004. [DOI] [PMC free article] [PubMed] [Google Scholar]
- 2.Ream NW, Perlia CP, Wolter J, Taylor SG., III JAMA. 1968;204:1030–6. [PubMed] [Google Scholar]
- 3.Dutcher JP, Coletti D, Paietta E, Wiernik PH. Leuk Res. 1997;5:375–80. doi: 10.1016/s0145-2126(96)00108-7. [DOI] [PubMed] [Google Scholar]
- 4.Seznec J, Silkenstedt B, Naumann U. J Neurooncol. 2011;3:365–77. doi: 10.1007/s11060-010-0266-x. [DOI] [PubMed] [Google Scholar]
- 5.Yuan P, Wang L, Wei D, Zhang J, Jia Z, Li Q, Le X, Wang H, Yao J, Xie K. Cancer. 2007;15:2682–90. doi: 10.1002/cncr.23092. [DOI] [PubMed] [Google Scholar]
- 6.Choi ES, Chung T, Kim JS, Lee H, Kwon KH, Cho NP, Cho SD. J Clin Biochem Nutr. 2013;53:89–93. doi: 10.3164/jcbn.13-28. [DOI] [PMC free article] [PubMed] [Google Scholar]
- 7.Shin JA, Jung JY, Ryu MH, Safe S, Cho SD. Mol Pharmacol. 2013;83:33–41. doi: 10.1124/mol.112.081364. [DOI] [PubMed] [Google Scholar]
- 8.Zhang M, Mathur A, Zhang Y, Xi S, Atay S, Hong JA, Datrice N, Upham T, Kemp CD, Ripley RT, Wiegand G, Avital I, Fetsch P, Mani H, Zlott D, Robey R, Bates SE, Li X, Rao M, Schrump D. Cancer Res. 2012;15:4178–92. doi: 10.1158/0008-5472.CAN-11-3983. [DOI] [PMC free article] [PubMed] [Google Scholar]
- 9.Green L, Donehower RC. Cancer Treat Rep. 1984;68:1379–81. [PubMed] [Google Scholar]
- 10.Remsing LL, González AM, Nur-e-Alam M, Fernández-Lozano MJ, Braña AF, Oliveira MA, Méndez C, Salas JA, Rohr J. J Am Chem Soc. 2003;14:5745–53. doi: 10.1021/ja034162h. [DOI] [PMC free article] [PubMed] [Google Scholar]
- 11.Barceló F, Ortiz-Lombardía M, Martorell M, Oliver M, Méndez C, Salas JA, Portugal J. Biochemistry. 2010;14:10543–52. doi: 10.1021/bi101398s. [DOI] [PubMed] [Google Scholar]
- 12.Núñez LE, Nybo SE, González-Sabín J, Pérez M, Menéndez N, Braña AF, Shaaban KA, He M, Morís F, Salas JA, Rohr J, Méndez C. J Med Chem. 2012;55:5813–25. doi: 10.1021/jm300234t. [DOI] [PMC free article] [PubMed] [Google Scholar]
- 13.Snyder RC, Ray R, Blume S, Miller DM. Biochemistry. 1991;30:4290–7. doi: 10.1021/bi00231a027. [DOI] [PubMed] [Google Scholar]
- 14.Taylor DJ, Parsons CE, Han H, Jayaraman A, Rege K. BMC Cancer. 2011;11:470. doi: 10.1186/1471-2407-11-470. [DOI] [PMC free article] [PubMed] [Google Scholar]
- 15.Lee TJ, Jung EM, Lee JT, Kim S, Park JW, Choi KS, Kwon TK. Mol Cancer Ther. 2006;5:2737–46. doi: 10.1158/1535-7163.MCT-06-0426. [DOI] [PubMed] [Google Scholar]
- 16.Otjacques E, Binsfeld M, Rocks N, Blacher S, Vanderkerken K, Noel A, Beguin Y, Cataldo D, Caers J. PLoS One. 2013;8:e62818. doi: 10.1371/journal.pone.0062818. [DOI] [PMC free article] [PubMed] [Google Scholar]
- 17.Fang K, Koller CA, Brown N, Covington W, Lin JR, Ho DH. Ther Drug Monit. 1992;14:255–60. doi: 10.1097/00007691-199206000-00013. [DOI] [PubMed] [Google Scholar]
- 18.Grohar PJ, Woldemichael GM, Griffin LB, Mendoza A, Chen QR, Yeung C, Currier DG, Davis S, Khanna C, Khan J, McMahon JB, Helman LJ. J Natl Cancer Inst. 2011;103:962–78. doi: 10.1093/jnci/djr156. [DOI] [PMC free article] [PubMed] [Google Scholar]
- 19.Fujiwara K, Saita T, Nakashima K, Kitagawa T. Cancer Res. 1986;46:1084–8. [PubMed] [Google Scholar]
- 20.U.S. Food and Drug Administration. Guidance for Industry: Bioanalytical Method Validation. 2001 [Google Scholar]
- 21.Waters NJ, Jones R, Williams G, Sohal B. J Pharm Sci. 2008:2586–95. doi: 10.1002/jps.21317. [DOI] [PubMed] [Google Scholar]
- 22. [Accessed May 15, 2014];DrugBank: Plicamycin (DB06810) www.drugbank.ca/drugs/DB06810.