Abstract
Quantification and characterization of the hemodynamic environment created after flow diversion treatment of cerebral aneurysms is important to understand the effects of flow diverters and their interactions with the biology of the aneurysm wall and the thrombosis process that takes place subsequently. This paper describes the construction of multi-modality image-based subject-specific CFD models of experimentally created aneurysms in rabbits and subsequently treated with flow diverters. Briefly, anatomical models were constructed from 3D rotational angiography images, flow conditions were derived from Doppler ultrasound measurements, stent models were created and virtually deployed, and the results were compared to in vivo digital subtraction angiography and Doppler ultrasound images. The models were capable of reproducing in vivo observations, including velocity waveforms measured in the parent artery, peak velocity values measured in the aneurysm, and flow structures observed with digital subtraction angiography before and after deployment of flow diverters. The results indicate that regions of aneurysm occlusion after flow diversion coincide with slow and smooth flow patterns, while regions still permeable at the time of animal sacrifice were observed in parts of the aneurysm exposed to larger flow activity, i.e. higher velocities, more swirling and more complex flow structures.
Keywords: Flow Diversion, Computational Fluid Dynamics, Hemodynamics, Cerebral Aneurysm, Rabbit Model
Introduction
The use of flow diverting (FD) devices for the treatment of intracranial aneurysms has been increasingly considered as an alternative to surgical clipping or endovascular coiling. Flow diversion works by deviating the blood flow away from the aneurysm and promoting aneurysm thrombosis and reconstruction of the parent artery by endothelialization [1]. However, the exact underlying mechanisms are still poorly understood. Many complex aneurysms, difficult to treat with either clips or coils, have been successfully treated with flow diverters [2-4]. However, complications related to delayed aneurysm rupture after flow diversion treatment have been reported [5, 6]. In contrast with coil embolization, evaluation of the technical success of flow diversion procedures immediately after implantation of the FD device is difficult because aneurysm thrombosis takes time and immediate occlusions are not always seen. Therefore, it is important to understand the immediate effects of flow diverters and their relationships to the long term outcome of these procedures. Previous studies have focused on understanding the flow alterations produced by FD devices using in vitro [7-9] and computational models [10, 11], as well as developing image analysis techniques to evaluate flow modifications in vivo [12-14]. The objective of our research is to study the relationship between the local hemodynamic conditions created immediately after FD treatment and the subsequent biological processes that take place leading to aneurysm thrombosis and endothelial growth in the parent artery. The purpose of this paper is to describe subject-specific computational fluid dynamics (CFD) models of aneurysms experimentally created in rabbits to study the connection between hemodynamics and aneurysm occlusion.
Methods
Animal models
Elastase-induced aneurysms were created in New Zealand white rabbits using a previously described technique [15, 16], and subsequently treated with a flow diverting (FD) device. Subjects were observed for 1 day (n=3), 3 days (n=3) and 8 weeks (n=15). Two days before embolization, the subjects in the 8 weeks group were premedicated with aspirin (10 mg/Kg PO) and clopidogrel (10 mg/kg PO). This medication regime was continued for one month after embolization. At the time of sacrifice, the animals were deeply anesthetized and euthanized with a lethal injection of pentobarbital. The aneurysms were then harvested and immediately fixed in 10% neutral buffered formalin for subsequent analysis. Some of the rabbits employed in this study were used as part of another investigation, where we analyzed the mechanism of the endothelialization after flow diverter implantation. This manuscript is entirely unrelated to the previous study.
Vascular imaging and modeling
3D rotational angiography (3DRA) was performed immediately prior and immediately post implantation of the FD device, as well as at the time of sacrifice. These images were acquired by contrast injection in the aortic arch. The 2D projections were reconstructed into 3D images consisting of isotropic voxels of approximately 0.27 mm. Anatomical models of the aneurysm and nearby vessels were constructed from the 3D images acquired prior to treatment using previously described methods [17] and manual edition of the 3D images using the itksnap software (http://www.itksnap.org) to separate arteries that were in close proximity to each other. The reconstructed models were then smoothed and cut perpendicularly to the vessel axes. Unstructured grids of tetrahedral elements with a resolution of approximately 0.2 mm were then generated using an advancing front method [18, 19]. Previous studies have suggested that a mesh resolution of at least 0.2 mm seems to be sufficient for realistically representing in vivo flows in the major cerebral arteries and aneurysms [17, 20, 21]. The aneurysm neck was manually delineated by interactively selecting points on the surface mesh and connecting them along the path of minimal geodesic distance. The line loop defining the aneurysm neck was later used to subdivide the model into regions for quantitative analysis as in previous studies [22]. An example is presented in Figure 1 (top row).
Figure 1.
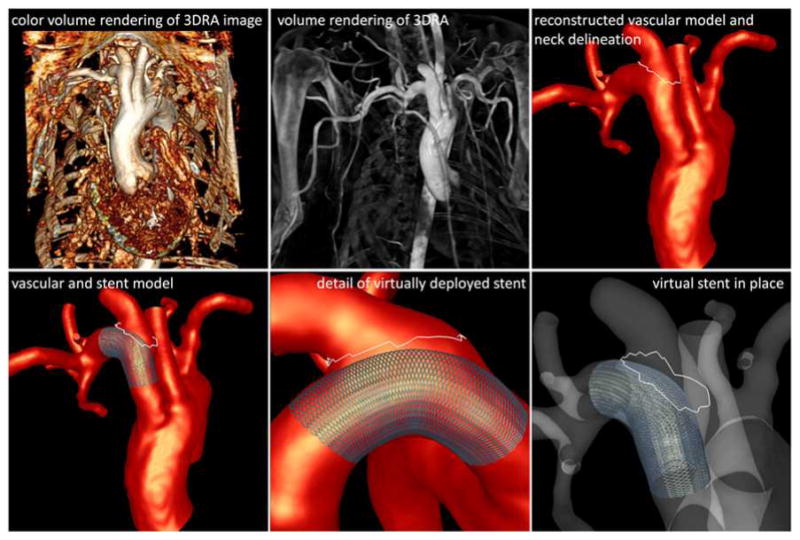
Image-based modeling.
Stent deployment and modeling
The flow diverter used (Pipeline Embolization Device, Covidien) consisted of 48 wires braided to form a cell with an angle of 150° in its reference configuration. Different device diameters and lengths were selected for each aneurysm depending on the parent artery diameter and geometry and the desired degree of device oversizing. Models of the flow diverting devices used to treat the aneurysms were created and placed within the reconstructed vascular models (see Figure 1 – bottom row). This was done using a virtual stent deployment technique previously described [11, 23]. Briefly, this technique consists in the following steps: a) the centerline or skeleton of the parent artery is extracted from the vascular model, b) a cylindrical surface is created along the vessel skeleton, c) the surface is elastically expanded until it becomes in contact with the vessel walls, d) the stent design is generated on the un-deformed reference cylindrical surface, e) the design (cell angle) is modified to account for foreshortening effects due to oversizing, and f) the stent design is mapped to the deformed cylindrical surface. The process is illustrated in Figure 2.
Figure 2.
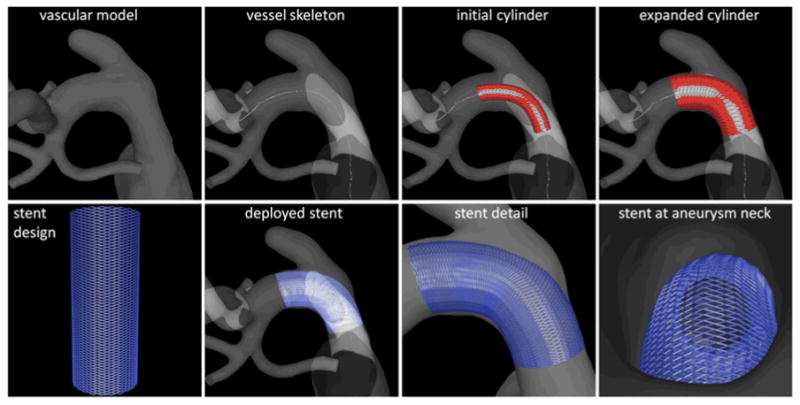
Virtual stent deployment.
CFD modeling
The blood flow was modeled by solving the 3D incompressible Navier-Stokes equations for a Newtonian fluid [24]. The blood density was set to ρ=1.0 g/cm3 and the viscosity to μ=0.04 Poise. The mass and momentum conservation equations were numerically solved using an upwind finite element discretization on unstructured grids composed of linear tetrahedral elements, the time integration was carried out with an implicit scheme [17], and the discretized pressure equation was solved with a fast deflated conjugate gradients algorithm [25]. Unsteady simulations were carried out under pulsatile flow conditions using a time step of 0.01 s for a total of two cardiac cycles. All subsequent data analysis was based on the results corresponding to the second cycle. Vessel wall compliance was neglected and no-slip boundary conditions were applied at the walls.
Two simulations were carried out for each aneurysm model. The first corresponded to the pre-treatment configuration, i.e. without the flow diverter. These simulations were carried out using the grids generated from the vascular reconstructions. The second simulation corresponded to the post-treatment configuration. In this case, the original grid was first adaptively refined around the stent wires. Four levels of h-refinement were applied to the mesh elements crossed by the stent wires. The number of grid elements ranged from approximately 2 million to 5.5 million in the pre-treatment models, and from about 10 million to 36 million in the post-treatment models. Post-treatment simulations were carried out using immersed unstructured grid methods to model the devices [26, 27]. All computations were carried out on parallel multi-core shared memory computers using OpenMP.
Flow measurements and boundary conditions
Subject-specific physiologic flow conditions were derived from in vivo Doppler ultrasound (DUS) measurements of blood velocity acquired prior to the aneurysm treatment. DUS measurements were obtained in the ascending aorta, the descending aorta, and the major arteries branching off the aortic arch. In particular, velocity measurements were taken in the parent artery of the aneurysm, both proximal and distal to the aneurysm, as well as in the aneurysm neck region. The velocity waveforms were manually reconstructed from the DUS images with a custom tool developed using python (see Figure 3). Briefly, the waveform reconstruction procedure starts by cropping the DUS image to isolate a single cardiac cycle. Secondly, a typical flow waveform is drawn on top of the cropped image, and the user is allowed to edit this curve by dragging control points of a cubic interpolating spline. Once the control points are placed at the desired locations, the waveform curve is generated and scaled with the appropriate velocity values from the DUS measurements. The peak velocity waveforms were thus reconstructed and subsequently used to impose pulsatile flow boundary conditions.
Figure 3.
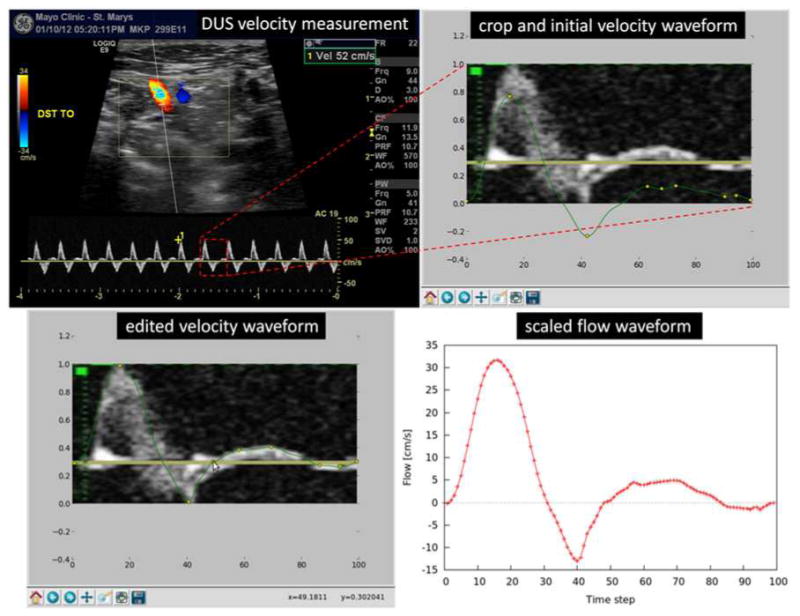
Flow estimation from Doppler ultrasound.
Flow divisions between the aorta and the arteries branching off the aortic arch were estimated from the corresponding DUS measurements. Using the peak velocity measured by DUS and the artery diameter measured on the reconstructed vascular model in the vicinity of the DUS measurement, the peak flow rate was estimated assuming a parabolic velocity profile. It was found that the flow division from the aorta to the three arteries branching off the aortic arch was fairly consistent across subjects. Roughly, one sixth of the aortic flow was observed in each of these three branches.
This subject-specific flow information was then used to impose boundary conditions in the corresponding CFD models (see Figure 4). At the model inlet, the pulsatile flow rate was prescribed and imposed as a velocity boundary condition using a parabolic profile. Flow boundary conditions were applied at all outlets except one (descending aorta). At the descending aorta outlet a traction-free boundary condition with a zero pressure was prescribed. The flow through each of the arteries branching off the aortic arch, estimated from the DUS measurements, were further split among the distal branches according to their areas. It was assumed that flow divisions followed a (area)2/3 law corresponding to a principle of minimum work (Murray's law [28]). At each of these outlets, the corresponding outflow rates were imposed as velocity boundary conditions with a parabolic profile. This choice of boundary conditions was able to reproduce the flow divisions estimated from the DUS measurements.
Figure 4.
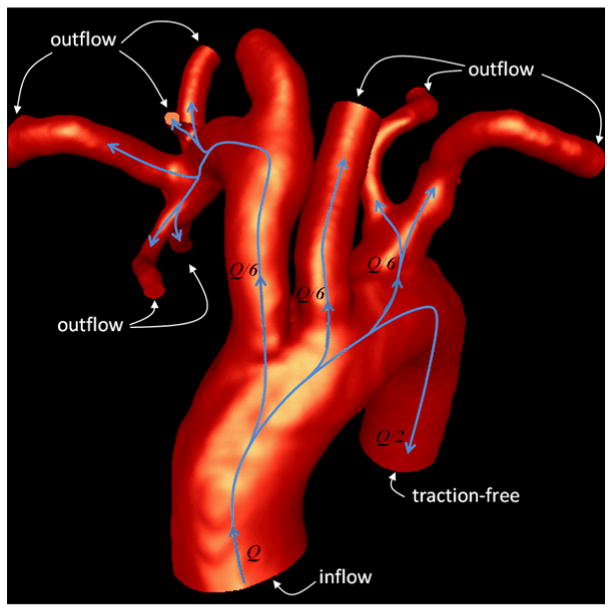
Flow splits and boundary conditions.
Occlusion imaging and quantification
Immediately prior to sacrifice, 3DRA images were acquired and used to characterize the aneurysm occlusion and identify aneurysmal regions that remained permeable. These images were used to create new vascular models that were manually aligned to the pre-treatment models through rigid registration. The aneurysm region in the pre-stenting models were identified by labeling grid points on each side of the orifice surface defined by the delineated necks [22]. A second volumetric mesh was generated from the aligned follow up models. The bounding box of each aneurysm was then voxelized with isotropic voxels similar to the voxels of the 3DRA images. Aneurysm voxels were subsequently labeled as: a) outside (outside of the pre-stenting or follow up grids), b) inside-occluded (inside pre-stenting grid but outside follow up grid), and c) inside-open (inside both the pre-stenting and follow up grids). To determine whether a voxel was inside or outside a given grid, it was tested whether the centroid of the voxel was inside of any of the tetrahedral elements belonging to the aneurysm region. This was done by evaluating the linear finite element shape functions of each element at the voxel center and testing whether all four shape functions were between 0 and 1. This procedure allows us to identify the regions of the aneurysm that were occluded or remained permeable at the time of the 8 weeks follow up exam and to quantify how much of the aneurysm volume was thrombosed at that time. The process is illustrated in Figure 5.
Figure 5.
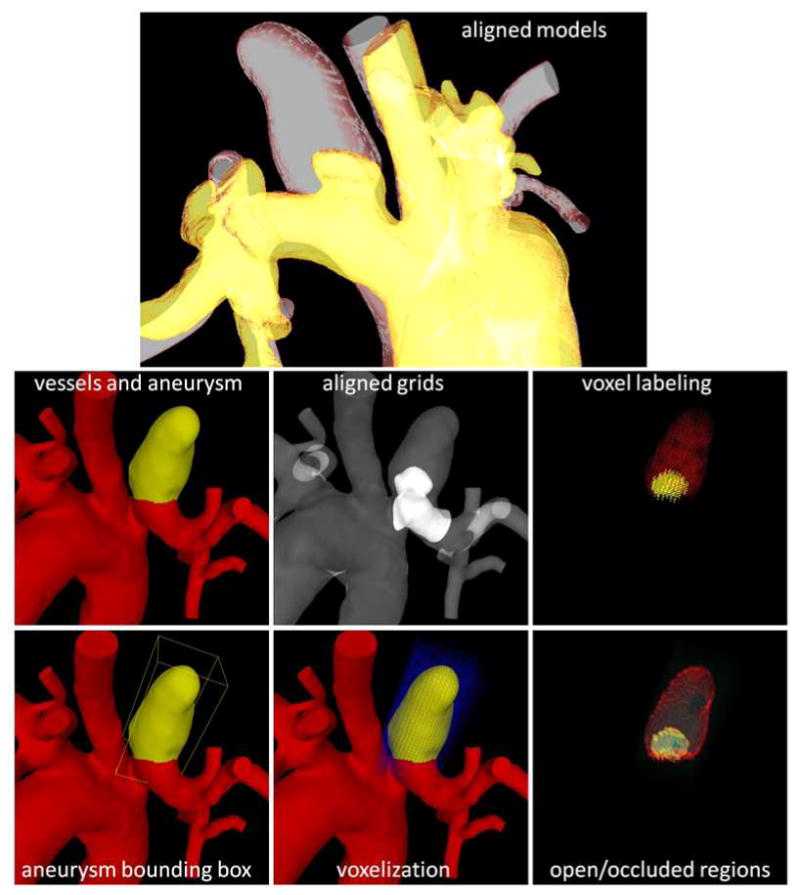
Estimation of occluded and permeable regions.
Results
A total of 21 subject-specific aneurysm models were successfully constructed from 3DRA and DUS images as described above, and corresponding pre- and post-stenting flow simulations were carried out. The results of the CFD models were then compared to both DUS measurements and 2D DSA observations.
CFD vs. DUS in the parent artery
Values of the blood velocity computed by the CFD models in the parent artery in the proximity of the aneurysm before treatment were compared to corresponding DUS measurements. For this purpose, “virtual probes” were placed on the vessel centerline of the parent artery in locations similar to the DUS measurements. Then, the axial velocity in a sphere of radius equal to half the vessel radius centered at the probe was calculated. The maximum and minimum axial velocities waveforms were then compared to the corresponding waveforms extracted from the DUS measurements. Two examples are presented in Figure 6. This figure shows the DUS measurement (top), the reconstructed DUS waveform and the maximum and minimum CFD axial velocity waveforms in the same scale (center), and the CFD velocity probes (bottom). Values of maximum and minimum axial velocity in the parent artery from the CFD models and the DUS measurements are listed in Table 1 (left) for all 21 models.
Figure 6.
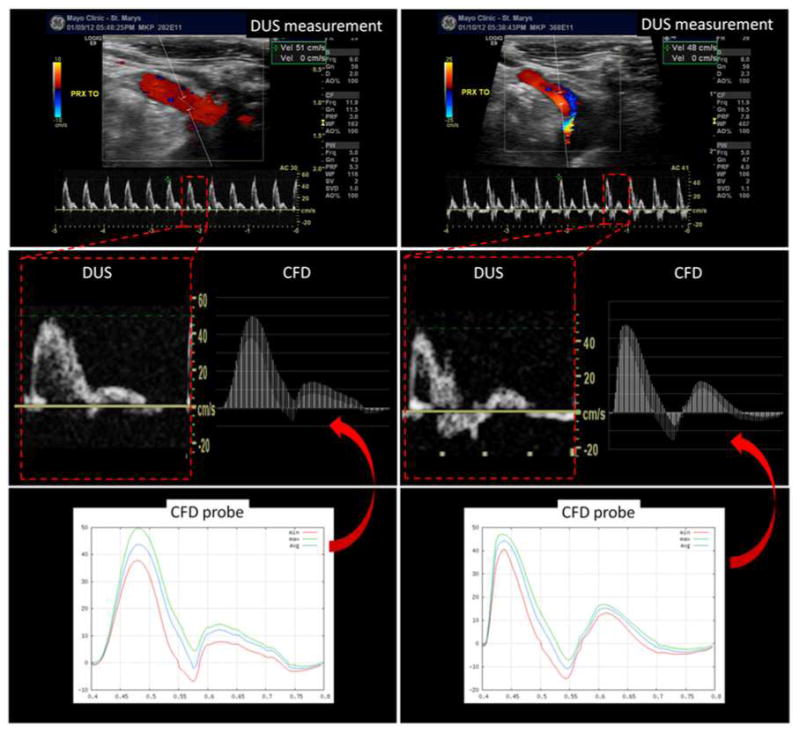
Doppler ultrasound and virtual ultrasound probes in the proximal parent artery.
Table 1.
Comparison of CFD and DUS peak velocity values in the parent artery and near the aneurysm orifice.
| Case | Parent artery | Aneurysm | ||||||||
|---|---|---|---|---|---|---|---|---|---|---|
| Max vel (cm/s) | Min vel (cm/s) | Max vel (cm/s) | ||||||||
| DUS | CFD | Diff | DUS | CFD | Diff | DUS | CFD | Diff | Remarks | |
| 1 | 36 | 35 | 2.7% | -15 | -14 | -6.7% | 27.5 | 24.4 | -11% | |
| 2 | 51 | 50 | 1.9% | -5 | -7 | -40% | N/A | 29.7 | - | |
| 3 | 40 | 35 | 12.5% | -10 | -12 | -20% | 17 | 18 | 5.8% | |
| 4 | 51 | 48 | 5.8% | -40 | -40 | -0% | 56 | 42.2 | -24.6% | |
| 5 | 48 | 48 | 0.0% | -18 | -16 | -11.1% | 29 | 28.3 | -2.4% | |
| 6 | 55 | 52 | 5.4% | -21 | -20 | -4.8% | 29 | 37 | 27.5% | DUS inside |
| 7 | 37 | 40 | -8.1% | -20 | -22 | -10% | 23 | 35.2 | 53% | DUS inside |
| 8 | 39 | 38 | 2.5% | -20 | -22 | -10% | [10-47] | 22.2 | - | DUS in/outside |
| 9 | 49 | 51 | -4.0% | -25 | -22 | -12% | 33 | 32.1 | -2.7% | |
| 10 | 47 | 45 | 4.2% | -20 | -18 | -10% | 33 | 23.4 | -29% | |
| 11 | 46 | 46 | 0.0% | -20 | -18 | -10% | 10 | 14.3 | 43% | DUS inside |
| 12 | 45 | 46 | -2.2% | -20 | -18 | -10% | 43 | 35.4 | -17% | DUS in PPA |
| 13 | 40 | 40 | 0.0% | -20 | -22 | -10% | 32 | 26.5 | -17% | |
| 14 | 54 | 56 | -3.7% | -35 | -25 | -28% | 28 | 30.8 | 10% | |
| 15 | 53 | 53 | 0.0% | -20 | -20 | 0.0% | [23-65] | 31.6 | - | |
| 16 | 39 | 38 | 2.5% | -30 | -38 | 26% | 49 | 75.8 | 54.6% | |
| 17 | 50 | 59 | -18% | -25 | -23 | -8% | 40 | 41 | 2.5% | |
| 18 | 44 | 45 | -2.2% | -25 | -23 | -8% | 43 | 16.7 | -61% | DUS in PPA |
| 19 | 78 | 70 | 10.2% | -50 | -45 | -10% | 40 | 37 | -7.5% | DUS inside |
| 20 | 54 | 54 | 0.0% | -30 | -42 | 40% | 33 | 31 | -6% | |
| 21 | 52 | 52 | 0.0% | -22 | -22 | 0% | 37 | 41 | 10.8% | |
The examples presented in Figure 6 and the values listed in Table 1 show that the blood velocity waveforms quantified from the CFD calculations and DUS measurements at similar locations along the parent artery are in good agreement, i.e. have similar shapes as well as peak values. This is a non-trivial result which implies that the CFD models, with the selected boundary conditions and geometrical approximations made, are able to reproduce the velocity values observed in vivo in the parent artery of the aneurysm.
CFD vs. DUS near the aneurysm neck
Velocity values at the aneurysm orifice obtained in the CFD models before treatment were compared to DUS measurements performed near the aneurysm. Two examples are presented in Figure 7. In the first case (top row), DUS measurement near the aneurysm neck (left) gave a peak inflow velocity of approximately 30 cm/s, while the corresponding CFD model (right) yielded a value of 25 cm/s. The location of the maximum inflow velocity seems to be in good agreement (towards the top and left of the orifice in this projection). In the second example (bottom row), the DUS measurement (left) shows the aneurysm inflow at the distal part of the aneurysm neck and a peak inflow velocity of approximately 28 cm/s. This observation is in good agreement with the CFD model (right) that also shows the inflow at the distal neck with a peak velocity of approximately 30 cm/s. Additionally, it can be seen that the velocity waveform near the aneurysm neck presents larger variability from cycle to cycle than in the parent artery (see DUS waveforms in Figure 6 and Figure 7).
Figure 7.
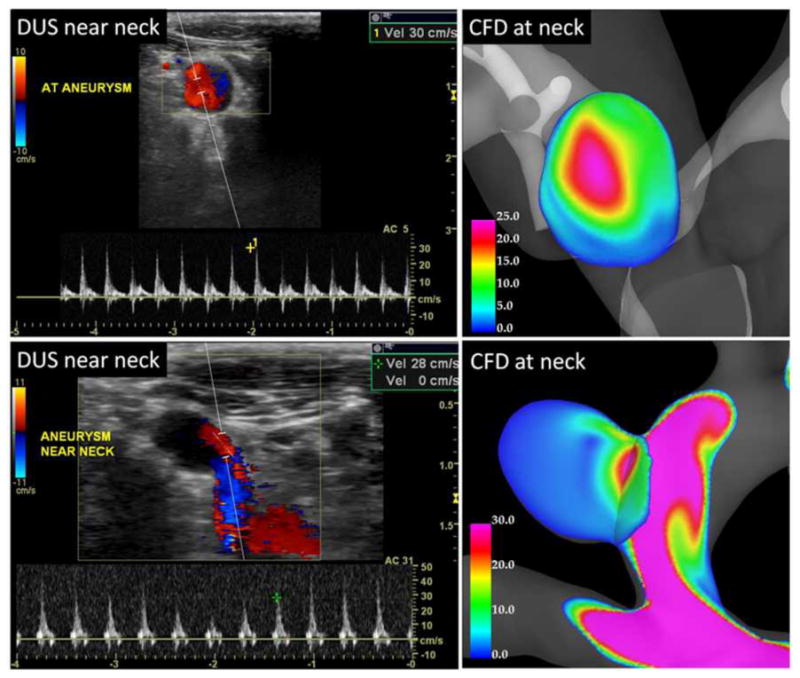
Doppler ultrasound and CFD velocity profiles at the aneurysm orifice.
Values of peak aneurysm velocity from the CFD models and DUS measurements are listed in Table 1 (right). The relative differences between the CFD and DUS velocities range from about 2% to 60%. However, as noted in the column labeled “remarks” several of the DUS measurements were obtained either further inside the aneurysm or outside the aneurysm in the parent artery. Therefore, in those cases an exact comparison is not possible. In two cases (8 and 15) a range of velocity values was obtained from one or more DUS measurements, and the corresponding CFD values were well within the measured range.
The results presented in Figure 7 and Table 1 suggest that the CFD models are consistent with in vivo observations and measurements of flow velocity obtained with DUS techniques prior to flow diversion treatment of the aneurysms.
Virtual stenting vs. gross anatomical images
Immediately after sacrificing the animals, the aneurysms were harvested and fixed in 10% neutral buffered formalin. Gross anatomical photographs of the harvested specimens with the implanted FD stents were then taken. Visualizations of the aneurysm models with the virtually deployed stents were then created in roughly the same orientations. Device cell angles were then quantified at selected locations (where the stent wires were visible in the anatomical images) and compared. Figure 8 shows six examples of the computational models (left) and harvested samples (right). The cell angles and the corresponding measurements are shown. Overall, the cell angles measured on the computational models and the anatomical images are in fairly good agreement, considering that the harvesting process may alter the in vivo vessel curvature (and thus the device angles), and that the measurements cannot be performed at the exact same locations (orientations are unknown). In one case (Figure 8 bottom right) the curvature of the parent artery changed significantly after harvesting the sample and it was not possible to compare the cell angles. Additionally, during the actual placement of the FD devices, the operator may compress or expand the device by pushing or pulling on the catheter affecting the final device geometry, a process that is very difficult to reproduce. Nevertheless, the results presented here suggest that the virtual stent deployment method used yields acceptable FD device geometries to approximate the in vivo blood flow dynamics after device implantation.
Figure 8.
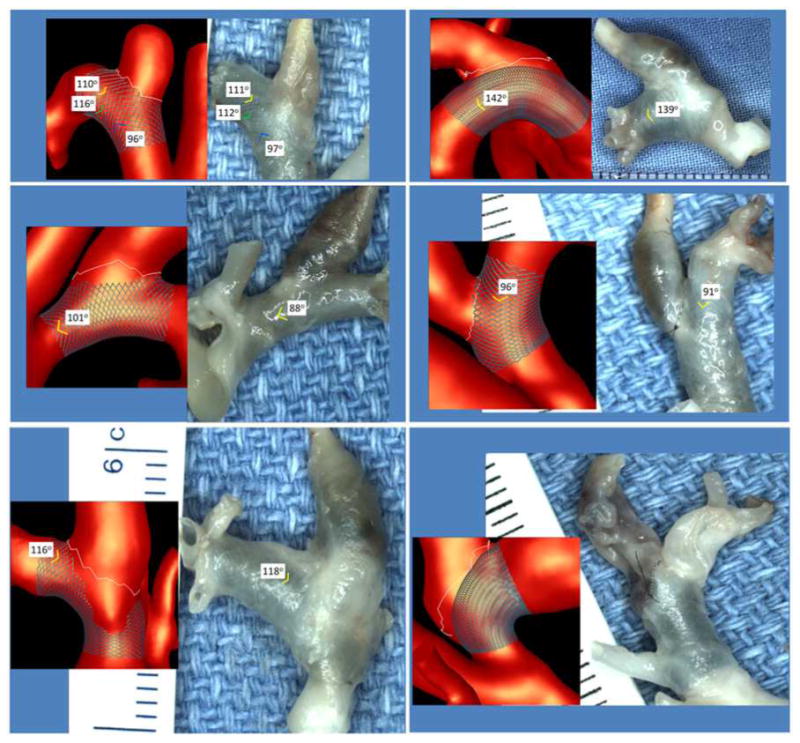
Virtual stent models and excised aneurysms with implanted stents.
CFD vs. DSA before and after treatment
Results from CFD models before and after FD treatment were qualitatively compared to in vivo observations made with 2D DSA immediately prior and immediately after deployment of the FD devices. Two examples are presented in Figure 9 to Figure 12. Each figure shows, from top to bottom, selected frames of the 2D DSA images, velocity magnitudes on a cut plane through the aneurysm, velocity isosurfaces, and flow streamlines.
Figure 9.
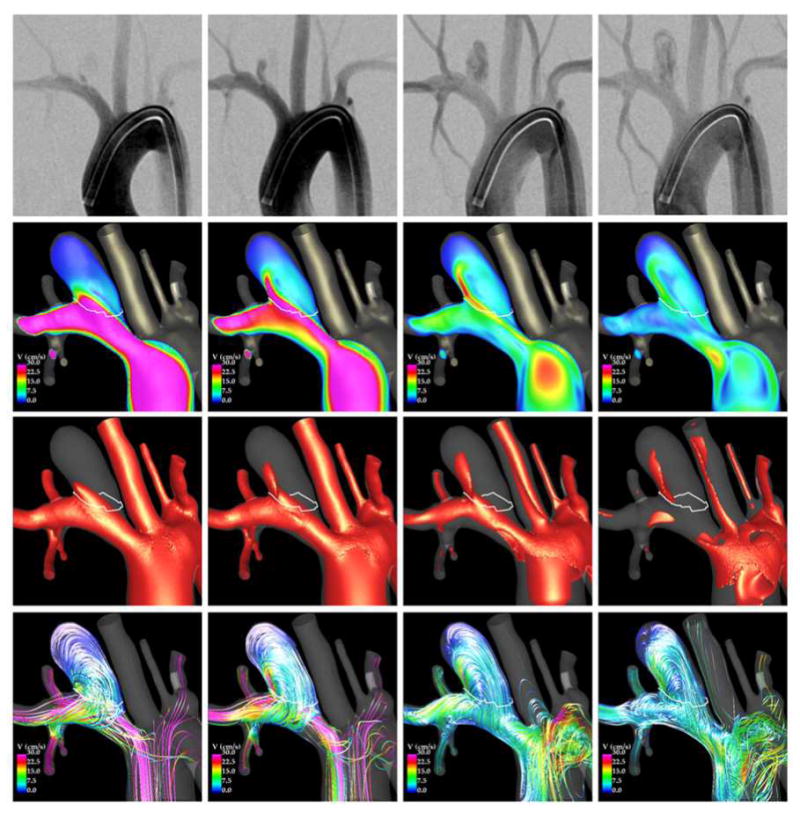
comparison of DSA and CFD prior to treatment.
Figure 12.
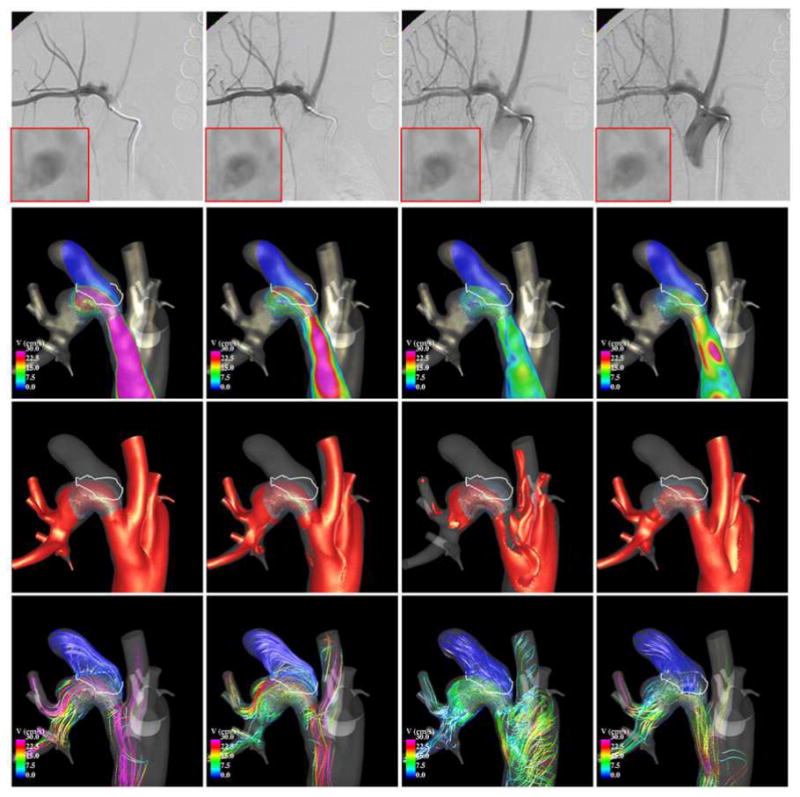
Comparison of DSA and CFD after stenting.
The first example is presented in Figure 9 and Figure 10. Before treatment (Figure 9), the aneurysm inflow stream is clearly visible in the two left DSA frames, while the outflow and the recirculating intra-aneurysmal flow structures can be seen in the two right DSA frames. The CFD visualizations presented in the same figure show that the inflow is located at the distal part of the aneurysm neck, while the outflow is located towards the proximal and posterior aspect of the aneurysm neck. They also show that during the flow acceleration phase (left two columns), the flow consists mainly of a single recirculation zone, while during the deceleration phase (right two columns) more complex vortical structures can be observed. These flow characteristics are consistent with the structures observed in the DSA images.
Figure 10.
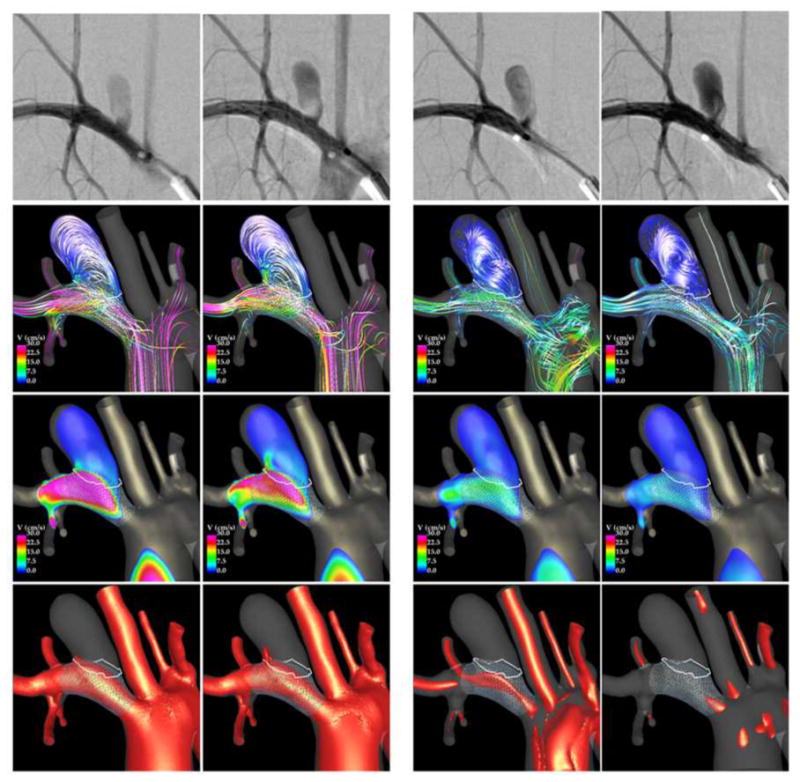
Comparison of DSA and CFD after stenting.
Selected frames from two DSA acquisitions after treatment are shown in Figure 10 (top row), along with CFD flow visualizations. The first DSA (left two columns) depict the filling of the aneurysm during the systolic phase. The second DSA (right two columns) depict the filling of the aneurysm during the flow reversal phase – notice the later filling of the branch proximal to the aneurysm. During the systolic phase it can be seen that the aneurysm inflow is located at the proximal end of the neck, while the outflow is located at the distal end, and that the intra-aneurysmal flow pattern is fairly simple and smooth. These observations are consistent with the corresponding DSA images. During the flow reversal phase, the aneurysm fills through a region located at the proximal end of the neck towards the posterior side of the parent artery, creating a more complex and less organized flow structure within the aneurysm. These characteristics are also consistent with the structures observed in the DSA images.
The second example is presented in Figure 11 and Figure 12. Visualizations of the blood flow dynamics before treatment (Figure 11) show that the blood flow enters the aneurysm through the right side of the orifice, recirculates within the aneurysm, and exits through the left side of the aneurysm. Larger flow activity, i.e. more swirling and more vortex structures, can be observed near the neck than near the dome, where the flow is slower and simpler. These features are consistent with the flow structures observed in the DSA images.
Figure 11.
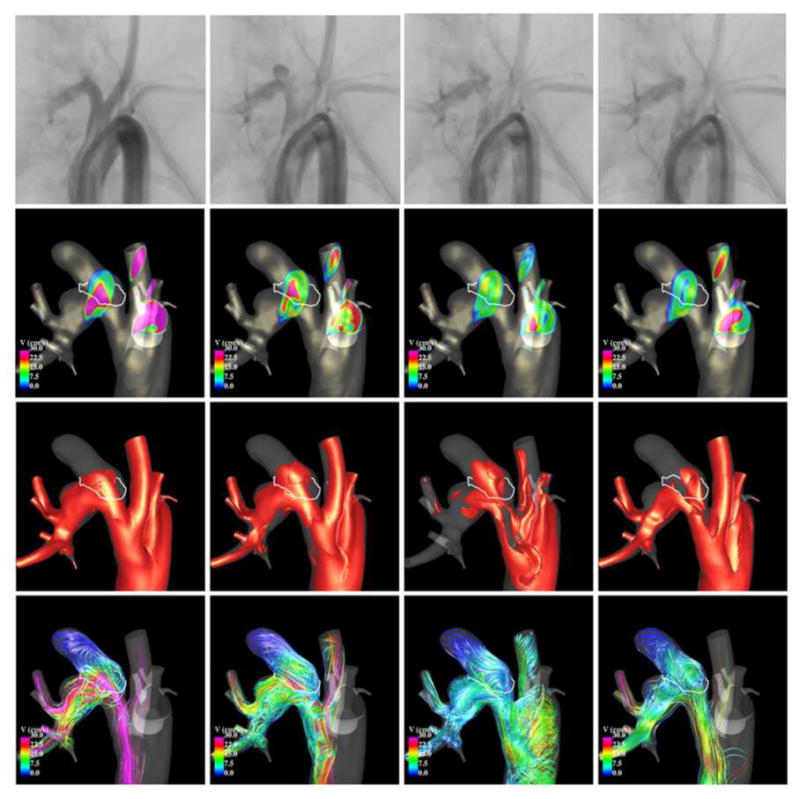
Comparison of DSA and CFD prior to treatment.
After implantation of the FD device (Figure 12), the blood flow becomes substantially slower and more organized (smoother streamlines). The inflow is now located towards the proximal side of the neck, and the outflow is located towards the distal side of the neck. There is significantly less flow activity than before treatment. The CFD flow visualizations are consistent with DSA observations. Additionally, a local enlargement of the parent artery distal from the aneurysm neck can be observed in the CFD model and in the DSA images. Close-up views of the DSA images in this region (boxes in the top row of Figure 12) demonstrate a region of flow recirculation at this location, which is consistent with the flow structures observed in the CFD visualizations.
In summary, the two examples presented here suggest that qualitatively, the flow structures obtained in the CFD models are consistent with in vivo DSA observations. In particular, the locations of the inflow and outflow regions as well as the complexity of the intra-aneurysmal flow structures seem to be in good agreement.
CFD vs. occlusion regions
Finally, blood flow structures obtained immediately after treatment were compared with the occlusion patterns observed at sacrifice. Four examples are presented in Figure 13. The top row of this figure shows the original vascular model (red) and the aligned follow-up model (yellow). The regions of the aneurysm were the two models overlap represent the regions that were still permeable (open) at the time of sacrifice. The non-overlap region (red only) represents the occluded or thrombosed part of the aneurysm. The bottom row of this figure shows the corresponding peak systole flow structures. The first example (left most panel) shows an aneurysm with almost no occlusion, only a small region near the dome has thrombosed. In this case substantial flow activity can be seen near the dome. The second example (second from left), shows a case of an aneurysm that has partially thrombosed at the dome. In this case, the flow in the occluded region was slower and smoother than the previous example. The third example (third from left), shows an aneurysm that has partially thrombosed at the dome and near the outflow region, the inflow region remains open. The fourth example (fourth from left), shows an aneurysm that has completely thrombosed. In this case, the entire aneurysm is in a state of slow flow and with a simple flow structure. These visualizations indicate that permeable regions coincide with the regions of highest flow immediately post-treatment, while occluded regions coincide with regions of slow and smooth flow. This is not surprising since thrombus formation is known to be associated to stagnant flows (slow velocity) and low shear rates (smooth flows). High flows on the other hand may act as deterrent of thrombus formation, and high shear stress can affect the thrombus progression by refreshing the thrombus and preventing or slowing down further growth.
Figure 13.
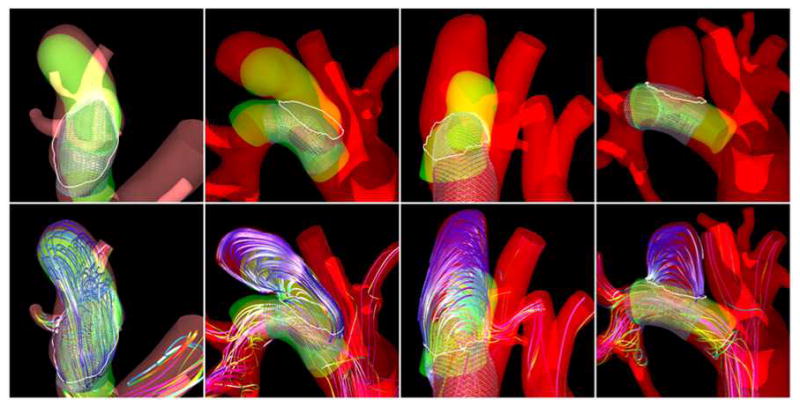
Flow patterns and occlusion regions.
Discussion
Quantification and characterization of the hemodynamic environment created after the implantation of flow diverting devices for the treatment of cerebral aneurysms is important to understand the effects of these devices and their interactions with the biology of the aneurysm wall and the thrombosis process that takes place subsequently. This article describes the construction of multi-modality image-based subject-specific CFD models of experimentally created aneurysms in animal models and subsequently treated with flow diverters. Briefly, anatomical models were constructed from 3D rotational angiography images, flow conditions were derived from Doppler ultrasound measurements, stent models were created and virtually deployed, and the results were compared to in vivo digital subtraction angiography and Doppler ultrasound images.
The use of animal models to investigate aneurysm treatments has a number of advantages, including: a) the possibility of performing a variety of image acquisitions and measurements before and after treatment as well as at the time of sacrifice; b) trying different devices or treatment options; c) harvesting samples after sacrifice for detailed biological analysis; and d) acquiring data at specified time points. However, animal models, as any model, also have limitations. For instance, the exact biological process responsible for the development of aneurysms in humans may be different from those used to induce aneurysms in the animals. Nevertheless, these models have been useful to better understand the processes that are induced by implantation of different devices such as flow diverters or coils [29-32].
The main limitation of the rabbit models used in this study is that since the aneurysms are created close to the aortic arch, there is a phase of flow reversal during the cardiac cycle after the systolic phase where the blood is flowing backwards in the parent artery. This complicates the modeling and requires paying special attention to the boundary conditions. In order to reproduce the back flow observed with ultrasound in the parent artery of the aneurysm, it was necessary to impose either a parabolic or uniform velocity profile at the model boundaries. The Womersley profile was not able to reproduce the back flow in the parent artery because it created regions of flow reversal near the walls instead of near the vessel centerline as observed in the ultrasound. In reality, at the model inlet the flow profile coming from the aortic valve is quite complex and not fully developed. Since we did not have flow profile information, we focused on reproducing the flow rates estimated from DUS measurements and more importantly the velocity waveforms measured with DUS in the aneurysm parent artery. The implicit assumption is that the vessel morphology (i.e. curvature, tapering, tortuosity, bifurcation characteristics, etc.) are the dominant factors determining the flow structure near the aneurysm [33].
In this study, flow divisions from the aorta were estimated using the peak velocity measured with ultrasound, the vessel diameter measured in the vascular model constructed from the 3DRA images, and the Poiseuille formula [24]. Although this approach may not be very accurate it was possible to reproduce the in vivo velocities measured with DUS in the parent artery. Furthermore, it was found that the flow division from the aorta to the main arteries branching off the aortic arch was fairly consistent and reproducible across subjects. The distal flow divisions were estimated following a principle of minimum work since it was not feasible to measure the flow in all the branches included in the models. Although it is unknown whether this principle applies to the rabbits, previous sensitivity studies suggested that the distal flow divisions do not have a large impact on the aneurysmal flow [17, 34].
Our selection of boundary conditions produced results that were consistent with DUS velocity measurements at the aneurysm neck as well as with observations of flow characteristics (e.g. inflow location, impingement region, main recirculation zones, etc.) made on DSA images. This seems to indicate that the most important parameters to realistically represent the aneurysmal flow are the vessel geometry and the flow conditions in the proximal parent artery. Flow divisions from the aorta to other major branches, distal flow divisions, and inlet velocity profiles seem to have less impact on the aneurysmal flow. This should be further investigated through sensitivity studies.
The methodology used to model the flow dynamics around FD devices consists in creating and virtually deploying a device model into the reconstructed vascular model, then adapting the mesh to resolve the device wires, and solving the flow equations using an immersed boundary method on unstructured grids. The virtual stent deployment technique employed does not attempt to model the exact structural dynamics of the device during its deployment. Instead, it tries to capture the main geometrical characteristics of the devices after implantation, including foreshortening effects due to oversizing [23, 35]. The effects of FD devices are mainly determined by their porosity, pore size and pore density. These parameters in turn depend on the device design. The design parameters of braided stents are the number of wires, the wire thickness and the cell angle. Once deployed only the cell angle can change as the stent stretched or compacts and bends, the number of wires and the wire thickness remain constant. The results presented in this study suggest that the geometries of the virtually implanted devices, in particular the cell angles, are consistent with ex vivo observations made on harvested samples. Our virtual deployment method does not take into account possible compaction or stretching of the device due to pushing or pulling of the delivery catheter during the actual deployment. This could have a large effect on the post-treatment hemodynamics if such maneuvers are performed during the interventions. Quantifying and/or controlling what is done during the release of the device is very difficult. However, device modeling could be improved as images of the devices after implantation become available, for example acquiring CT-like images with angiography scanners. These images could be used to drive and guide image-based deployment methods. The use of immersed or embedded grid techniques to solve the flow equations has the advantage of employing an h-refined version of the same mesh used for the pre-treatment calculation without having to perform intersections between the vascular and device geometries [27, 36]. Thus, this strategy is automatic and quite robust [37]. However, its main drawback is that it results in fairly large computational grids and increased compute times.
In addition, a number of other limitations, assumption and approximations may affect the results obtained with the models described in this paper and should be taken into account when interpreting the data generated with such models. These include: limited anatomical image resolution, neglecting vessel wall compliance, the assumption of fully developed flow profiles at the model boundaries, the estimation of flow rates from point velocity measurements, the uncertainty in the exact location of the ultrasound velocity measurements, the manual delineation of the aneurysm neck, the manual alignment of pre-treatment and follow up vascular models to quantify aneurysm occlusion, etc. The accuracy of DUS measurements depend mainly on the beam-flow angle and the size and location of the measurement window. All velocities within the measurement window are sampled and result in a “velocity spectrum”. We used the envolvent of this spectrum to estimate the maximum velocity within the measurement window which was placed at the center of the vessel. For highly skewed velocity profiles this can introduce inaccuracies in the estimations of flow rates. Although, DUS has high temporal resolution, it can only measure velocities at a single location. Thus, it is not possible to obtain accurate representations of velocity profiles. The 3D images used to construct our models had a resolution of approximately 0.27 mm in all directions (isotropic voxels). The ascending aortas measured approximately 8 mm in diameter, the descending aorta about 6 mm, and the aneurysm parent artery between 3 and 5 mm. Therefore there were between 10 and 30 voxels across the lumen of these arteries, which would imply a geometric error of no more than 10%.
Despite these many limitations and approximations, the models seem to yield results that are consistent with in vivo observations and measurements made during the interventions. These models allow comparisons of local hemodynamic conditions between different subjects and the corresponding outcomes, and therefore are useful to understand the long term effects of the flow diverting devices. Before attempting to further refine these models to more accurately represent the in vivo flow dynamics, it is necessary to identify the most clinically or biologically important hemodynamic characteristics that need to be quantified and to which degree of precision.
Conclusions
Subject-specific computational models constructed from 3D rotational angiography and Doppler ultrasound images of aneurysms experimentally created in rabbits are capable of reproducing in vivo observations, including velocity waveforms measured in the parent artery, peak velocity values measured in the aneurysm, and flow structures observed with digital subtraction angiography before and after treatment with flow diverters. Thus, these models can be used to study the relationship between the local hemodynamic conditions created immediately after implantation of flow diverting devices and the subsequent thrombosis and aneurysm occlusion.
The results of this study indicate that regions of aneurysm occlusion after flow diversion treatment coincide with slow and smooth flow patterns, while regions still permeable 8 weeks after treatment coincide with regions of larger flow activity, i.e. higher velocities, more swirling and more complex flow structures.
Acknowledgments
This work was supported by research grant NS076491 from the National Institutes of Health. We thank Covidien Inc. for generously providing the flow diverters for this study.
References
- 1.Kallmes DF, et al. A new endoluminal, flow disrupting device for treatment of saccular aneurysms. Stroke. 2007;38(8):2346–2352. doi: 10.1161/STROKEAHA.106.479576. [DOI] [PubMed] [Google Scholar]
- 2.Saatci I, et al. Treatment of Intracranial Aneurysms Using the Pipeline Flow-Diverter Embolization Device: A Single-Center Experience with Long-Term Follow-Up Results. AJNR Am J Neuroradiol. 2012;33(8):1436–1446. doi: 10.3174/ajnr.A3246. [DOI] [PMC free article] [PubMed] [Google Scholar]
- 3.Lylyk P, et al. Curative endovascular reconstruction of cerebral aneurysms with the pipeline embolization device: the Buenos Aires experience. Neurosurgery. 2009;64(4):632–642. doi: 10.1227/01.NEU.0000339109.98070.65. [DOI] [PubMed] [Google Scholar]
- 4.Nelson PK, et al. The pipeline embolization device for the intracranial treatment of aneurysms trial. AJNR Am J Neuroradiol. 2011;32(1):34–40. doi: 10.3174/ajnr.A2421. [DOI] [PMC free article] [PubMed] [Google Scholar]
- 5.Cebral JR, et al. Aneurysm Rupture Following Treatment with Flow-Diverting Stents: Computational Hemodynamics Analysis of Treatment. AJNR American Journal of Neuroradiology. 2011;32(1):27–33. doi: 10.3174/ajnr.A2398. [DOI] [PMC free article] [PubMed] [Google Scholar]
- 6.Kulcsar Z, et al. Intra-aneurysmal thrombosis as a possible cause of delayed aneurysm rupture after flow-diversion treatment. AJNR American Journal of Neuroradiology. 2011;32(1):20–25. doi: 10.3174/ajnr.A2370. [DOI] [PMC free article] [PubMed] [Google Scholar]
- 7.Lieber BB, Stancampiano AP, Wakhloo AK. Alteration of hemodynamics in aneurysm models by stenting: influence of stent porosity. Annals of Biomedical Engineering. 1997;25(3):460–469. doi: 10.1007/BF02684187. [DOI] [PubMed] [Google Scholar]
- 8.Lieber BB, et al. Particle image velocimetry assessment of stent design influence on intra-aneurysmal flow. Annals of Biomedical Engineering. 2002;30:768–777. doi: 10.1114/1.1495867. [DOI] [PubMed] [Google Scholar]
- 9.Seong J, Wakhloo AK, Lieber BB. In Vitro Evaluation of Flow Divertors in an Elastase-Induced Saccular Aneurysm Model in Rabbit. Journal of Biomechanical Engineering. 2007;129(6):863–872. doi: 10.1115/1.2800787. [DOI] [PubMed] [Google Scholar]
- 10.Kim M, et al. Comparison of Two Stents in Modifying Cerebral Aneurysm Hemodynamics. Annals of Biomedical Engineering. 2008;36(5):726–741. doi: 10.1007/s10439-008-9449-4. [DOI] [PMC free article] [PubMed] [Google Scholar]
- 11.Mut F, et al. Effects of foreshortening and oversizing of flow diverting stents for intracranial aneurysms. IX Argentinian Congress on Computational Mechanics (MECOM) and XXXI Iberian-Latin-American Congress on Computational Methods in Engineering (CILAMCE); 2010; Buenos Aires, Argentina. [Google Scholar]
- 12.Sadasivan C, et al. Angiographic quantification of contrast medium washout from cerebral aneurysms after stent placement. AJNR American Journal of Neuroradiology. 2002;23:1214–1221. [PMC free article] [PubMed] [Google Scholar]
- 13.Sadasivan C, et al. Treatment of rabbit elastase-induced aneurysm models by flow diverters: development of quantifiable indexes of device performance using digital subtraction angiography. IEEE Trans on Medical Imaging. 2009;28(7):1117–1125. doi: 10.1109/TMI.2008.2012162. [DOI] [PMC free article] [PubMed] [Google Scholar]
- 14.Pereira VM, et al. A DSA-Based Method Using Contrast-Motion Estimation for the Assessment of the Intra-Aneurysmal Flow Changes Induced by Flow-Diverter Stents. AJNR Am J Neuroradiol. 2013;34(3):805–815. doi: 10.3174/ajnr.A3322. [DOI] [PMC free article] [PubMed] [Google Scholar]
- 15.Altes TA, et al. 1999 ARRS Executive Council Award. Creation of saccular aneurysms in the rabbit: a model suitable for testing endovascular devices. American Roentgen Ray Society. American Journal of Roentgenology. 2000;174(2):349–54. doi: 10.2214/ajr.174.2.1740349. [DOI] [PubMed] [Google Scholar]
- 16.Ding YH, et al. Control of aneurysm volume by adjusting the position of ligation during creation of elastase-induced aneurysms: a prospective study. AJNR Am J Neuroradiol. 2007;28(5):857–9. [PMC free article] [PubMed] [Google Scholar]
- 17.Cebral JR, et al. Efficient pipeline for image-based patient-specific analysis of cerebral aneurysm hemodynamics: Technique and sensitivity. IEEE Transactions in Medical Imaging. 2005;24(1):457–467. doi: 10.1109/tmi.2005.844159. [DOI] [PubMed] [Google Scholar]
- 18.Löhner R. Automatic unstructured grid generators. Finite Elements in Analysis and Design. 1997;25:111–134. [Google Scholar]
- 19.Löhner R. Applied CFD techniques. John Wiley & Sons; 2001. [Google Scholar]
- 20.Radaelli A, et al. Reproducibility of haemodynamical simulations in a subject-specific stented aneurysm model--a report on the Virtual Intracranial Stenting Challenge 2007. Journal of Biomechanics. 2008;41(10):2069–2081. doi: 10.1016/j.jbiomech.2008.04.035. [DOI] [PubMed] [Google Scholar]
- 21.Raschi M, et al. CFD and PIV Analysis of Hemodynamics in a Growing Intracranial Aneurysm. Int j numer method biomed eng. 2012;28(2):214–228. doi: 10.1002/cnm.1459. [DOI] [PMC free article] [PubMed] [Google Scholar]
- 22.Mut F, et al. Computational hemodynamics framework for the analysis of cerebral aneurysms. Int J Num Meth Biomed Eng. 2011;27(6):822–839. doi: 10.1002/cnm.1424. [DOI] [PMC free article] [PubMed] [Google Scholar]
- 23.Mut F, Appanaboyina S, Cebral JR. Simulation of stent deployment in patient-specific cerebral aneurysm models for their hemodynamics analysis. ASME Summer Bioengineering Conference; 2008; Marco Island, Florida. [Google Scholar]
- 24.Kundu PK, Cohen IM. Fluid mechanics. New York: Academic Press (Elsevier); 2004. [Google Scholar]
- 25.Mut F, et al. Fast numerical solutions in patient-specific simulations of arterial models. IJNMBE Int J Num Meth Biomed Eng. 2010;26(1):73–85. doi: 10.1002/cnm.1235. [DOI] [PMC free article] [PubMed] [Google Scholar]
- 26.Cebral JR, Löhner R. Efficient simulation of blood flow past complex endovascular devices using an adaptive embedding technique. IEEE Transactions in Medical Imaging. 2005;24(4):468–477. doi: 10.1109/tmi.2005.844172. [DOI] [PubMed] [Google Scholar]
- 27.Appanaboyina S, et al. Computational Fluid Dynamics of Stented Intracranial Aneurysms using Adaptive Embedded Unstructured Grids. International Journal for Numerical Methods in Fluids. 2008;57:457–493. [Google Scholar]
- 28.Murray CD. The Physiological Principle Of Minimum Work Applied To The Angle Of Branching Of Arteries. J Gen Physiol. 1926;9(6):835–841. doi: 10.1085/jgp.9.6.835. [DOI] [PMC free article] [PubMed] [Google Scholar]
- 29.Struffert T, et al. Measurement of quantifiable parameters by time-density curves in the elastase-induced aneurysm model: first results in the comparison of a flow diverter and a conventional aneurysm stent. Eur Radiol. 2013;23(2):521–7. doi: 10.1007/s00330-012-2611-2. [DOI] [PubMed] [Google Scholar]
- 30.Ionita CN, et al. Evaluation of a second-generation self-expanding variable-porosity flow diverter in a rabbit elastase aneurysm model. AJNR Am J Neuroradiol. 2011;32(8):1399–407. doi: 10.3174/ajnr.A2548. [DOI] [PMC free article] [PubMed] [Google Scholar]
- 31.Sadasivan C, et al. Treatment of rabbit elastase-induced aneurysm models by flow diverters: development of quantifiable indexes of device performance using digital subtraction angiography. IEEE Trans Med Imaging. 2009;28(7):1117–25. doi: 10.1109/TMI.2008.2012162. [DOI] [PMC free article] [PubMed] [Google Scholar]
- 32.Krings T, et al. Treatment of experimentally induced aneurysms with stents. Neurosurgery. 2005;56(6):1347–59. doi: 10.1227/01.neu.0000159887.03290.d1. discussion 1360. [DOI] [PubMed] [Google Scholar]
- 33.Castro MA, Putman CM, Cebral JR. Computational fluid dynamics modeling of intracranial aneurysms: effects of parent artery segmentation on intra-aneurysmal hemodynamcis. AJNR American Journal of Neuroradiology. 2006;27:1703–1709. [PMC free article] [PubMed] [Google Scholar]
- 34.Naughton NM, et al. Impacts of waveforms on the fluid flow, wall shear stress, and flow distribution in cerebral aneurysms and the development of a auniversal reduced pressure. J Biomedical Science and Engineering. 2014;7:7–14. [Google Scholar]
- 35.Mut F, Cebral JR. Effects of Flow-Diverting Device Oversizing on Hemodynamics Alteration in Cerebral Aneurysms. AJNR Am J Neuroradiol. 2012;33(10):2010–2016. doi: 10.3174/ajnr.A3080. [DOI] [PMC free article] [PubMed] [Google Scholar]
- 36.Appanaboyina S, et al. Simulation of intracranial aneurysm stenting: techniques and challenges. Computer Methods in Applied Mechanics and Engineering. 2009;198(45-46):3567–3582. [Google Scholar]
- 37.Cebral JR, et al. Image-Based Computational Hemodynamics Methods and Their Application for the Analysis of Blood Flow Past Endovascular Devices. In: Leondes CT, editor. Biomechanical Systems Technology: (1) Computational Methods. World Scientific; 2007. pp. 29–85. [Google Scholar]


