

Abstract
Peroxisome proliferator-activated receptors (PPARs) are nuclear hormone receptors that act as ligand-activated transcription factors. Although prescribed for dyslipidemia and type-II diabetes, PPAR agonists also possess anti-addictive characteristics. PPAR agonists decrease ethanol consumption and reduce withdrawal severity and susceptibility to stress-induced relapse in rodents. However, the cellular and molecular mechanisms facilitating these properties have yet to be investigated. We tested three PPAR agonists in a continuous access two-bottle choice (2BC) drinking paradigm and found that tesaglitazar (PPARα/γ; 1.5 mg/kg) and fenofibrate (PPARα; 150 mg/kg) decreased ethanol consumption in male C57BL/6J mice while bezafibrate (PPARα/γ/β; 75 mg/kg) did not. We hypothesized that changes in brain gene expression following fenofibrate and tesaglitazar treatment lead to reduced ethanol drinking. We studied unbiased genomic profiles in areas of the brain known to be important for ethanol dependence, the prefrontal cortex (PFC) and amygdala, and also profiled gene expression in liver. Genomic profiles from the non-effective bezafibrate treatment were used to filter out genes not associated with ethanol consumption. Because PPAR agonists are anti-inflammatory, they would be expected to target microglia and astrocytes. Surprisingly, PPAR agonists produced a strong neuronal signature in mouse brain, and fenofibrate and tesaglitazar (but not bezafibrate) targeted a subset of GABAergic interneurons in the amygdala. Weighted gene co-expression network analysis (WGCNA) revealed co-expression of treatment-significant genes. Functional annotation of these gene networks suggested that PPAR agonists might act via neuropeptide and dopaminergic signaling pathways in the amygdala. Our results reveal gene targets through which PPAR agonists can affect alcohol consumption behavior.
1. Introduction
PPARs belong to the nuclear hormone receptor superfamily, one of the largest families of transcription factors 31. PPARs heterodimerize with Retinoid X Receptor (RXR), another nuclear hormone receptor, and act as ligand-regulated transcription factors 23. There are three known isotypes of PPARs: PPARα, PPARβ also named PPARδ (PPARβ/δ), and PPARγ that each have distinct expression patterns, tissue distribution and physiological functions 18, 35. Endogenous ligands of PPARs include endocannabinoids, fatty acids and fatty acid derivatives (e.g. polyunsaturated fatty acids, eicosanoids and oxidized phospholipids) 26, 61.
There is increased interest in PPAR agonists for the treatment of CNS diseases including Alzheimer’s, Parkinson’s and Huntington’s disease, ischemic brain injury, schizophrenia, obesity and metabolic disorders. Most research analyzing PPARs as therapeutics for brain disorders has focused on PPARγ, the most abundant isotype in microglia, because of its well-documented anti-inflammatory properties and its potential therapeutic use in neurodegenerative diseases and brain injury 18. All PPAR isotypes are expressed in neurons, oligodendrocytes, microglia and astrocytes 18, and PPAR activity in the brain is relatively high 13, 20. PPARγ and α are expressed in the midbrain, including tyrosine-hydroxylase positive neurons 40, 54. Although PPARβ/δ is the most abundant isotype in brain, we know the least about its physiological function.
Recent evidence suggests that drugs targeting PPARs might be effective in treating drug dependence (for review see 28). Retinoic acid is the only known RXR ligand and, interestingly, retinoic acid signaling was implicated in acute ethanol responses in mice 22. Also, pioglitazone and rosiglitazone (PPARγ agonists) reduced ethanol consumption in rats 58, 59. Intracerebroventricular administration of a PPARγ antagonist blocked the reduction in ethanol consumption, suggesting that this effect is mediated by central PPARγ receptors 59. Additionally, pioglitazone and rosiglitazone reduced ethanol withdrawal severity and stress-induced reinstatement of ethanol consumption in dependent rats without altering food or saccharine self-administration 59. Clofibrate, a PPARα agonist, prevented acquisition of nicotine dependence in naïve rats and monkeys and decreased nicotine self-administration in nicotine-dependent rats and monkeys 39. Thus, in addition to their known usefulness in cardiovascular disease and type II diabetes mellitus 49, PPAR agonists might be a potential treatment for alcohol dependence and other addictions.
Based on the evidence for PPARs in regulating ethanol intake in rodents, we assessed the effects of different PPAR agonists on voluntary ethanol consumption in a mouse strain that consumes large amounts of alcohol and examined their effects on gene expression in brain regions important for reducing ethanol consumption. We show that fenofibrate and tesaglitazar decrease ethanol consumption in mice without affecting overall fluid intake, while bezafibrate did not change ethanol consumption. We reasoned that the PPAR treatment-responsive transcript changes in the brain important for reducing ethanol consumption should reflect treatment effectiveness. To the best of our knowledge, this is the first study to demonstrate brain gene expression changes induced by PPAR agonists at doses that decrease alcohol consumption in the amygdala and PFC of mice, two key areas for alcohol dependence.
2. Methods
2.1 Animals
All studies were conducted in adult drug-naïve C57BL/6J (B6) male mice that were purchased at 8 weeks of age from Jackson Laboratories (Bar Harbor, ME). We chose this strain because of their propensity for voluntary ethanol consumption 6. Seventy-two mice between 8 and 12 weeks old were used: 32 for the ethanol experiment in which mice received ethanol and PPAR agonists or saline (4 groups with 8 mice each) and 40 for the microarray experiment in which mice received PPAR agonists or saline only (4 groups with 10 mice each). Mice were housed in the Animal Resources Center at The University of Texas at Austin with 12-h light/dark cycles (lights on at 10:00 AM) and had ad libitum access to rodent chow (Prolab RMH 180 5LL2 chow, TestDiet, Richmond, IN) and water. All efforts were made to minimize animal suffering, to reduce the number of animals used, and to utilize alternatives to in vivo techniques, if available. All experiments were approved by The University of Texas at Austin Institute for Animal Care and Use Committee and were conducted in accordance with NIH guidelines with regard to the use of animals in research.
2.2 Ethanol treatment
We used a two-bottle choice (2BC) voluntary ethanol consumption protocol as previously described 8. Briefly, two drinking bottles were continuously available to individually-housed mice. One contained water and the other 15% ethanol (v/v). Once stable ethanol consumptions were reached, we measured ethanol intake after two days of saline injections and grouped mice (8 mice per group) to provide similar levels of ethanol intake and preference. We administered PPAR agonists or saline depending on their group assignment. We measured consumption (g/kg body weight/24 hours) and calculated preference as the amount of ethanol consumed divided by the total amount of fluids consumed per day (a value > 50% indicates a preference for ethanol). Data are reported as the mean ± S.E.M. We used the statistics software program GraphPad Prism (Jandel Scientific, Costa Madre, CA) to perform a two-way ANOVA with repeated measurements and Bonferroni post hoc test.
2.3 Drugs
The PPARα agonist fenofibrate (feno) (Sigma-Aldrich, St. Louis, MO), pan-PPAR agonist bezafibrate (beza) (Sigma-Aldrich, St. Louis, MO) and dual PPARα-PPARγ agonist tesaglitazar (tesa) (Tocris Bioscience, Minneapolis, MN) were freshly prepared as suspensions in saline with 4–5 drops of Tween-80 and injected in a volume of 0.05 ml/10 g of body weight. We administered (p.o.) PPAR agonist (150 mg/kg, 75 mg/kg, or 1.5 mg/kg of feno, beza, and tesa, respectively) or saline for eight days. Doses of drugs and routes of administration were based on published biological activity in vivo. Tesa was only delivered for six days in the 2BC experiment because its decreased effect on ethanol drinking behavior plateaued at that time-point.
2.4 Tissue collection
Twenty-four hours after administration of the last PPAR agonist for the microarray study, mice were euthanized by cervical dislocation. Livers were removed and brains were placed in a petri dish on ice. After removal of olfactory bulbs, PFC was dissected by cutting the foremost 2 mm of the cortex on each side, at an approximate 50-degree angle from the midline of the brain. Brains were then placed in a coronal Zivic mouse brain slicer with a 0.5 mm resolution (Zivic Instruments, PA), and the amygdala was dissected from slices cut from the following coordinates: coronal level 56–66 [Bregma (−0.18)–(−1.155)] and 66–80 [Bregma (−1.155)–(−2.55)]. Tissue was immediately flash-frozen in liquid nitrogen and stored at −80°C until use. The amygdala and PFC were chosen for their importance in reward signaling and ethanol dependence 25. The liver was chosen in order to validate microarray results since PPAR agonists are known to change liver gene expression 47.
2.5 RNA preparation and microarray hybridization
We extracted RNA using the MagMAX-96 Total RNA Isolation Kit (Life Technologies, Grand Island, NY). Total RNA was quantified on a NanoDrop 8000 spectrophotometer (Thermo Fisher Scientific Inc., Rockford, IL) and assessed for quality using the Agilent TapeStation (Agilent Technologies, Inc., Santa Clara, CA). All samples passed quality control measures (RIN > 8). RNA was amplified and biotin-labeled using the Illumina® TotalPrepTM RNA Amplification kit (Ambion, Austin, TX), and aliquots of labeled cRNA were sent to the Yale Center for Genome Analysis (West Haven, CT), where they were hybridized to Illumina® MouseWG-6 v2 Expression BeadChips (Illumina, Inc., San Diego, CA). Each beadchip contains six independent arrays. Samples were counterbalanced to avoid batch effects. The amount of each transcript for each animal was measured by fluorescent intensity after scanning. Microarray data will be deposited in the NCBI Gene Expression Omnibus (GEO) database (http://www.ncbi.nlm.nih.gov/geo/) and described in accordance with MIAME guidelines.
We have used the Illumina platform frequently in the past with repeated validations using independent qRT-PCR experiments. Correspondence between the microarray and RT-PCR results exceeds 80% 17, 41, 42.
2.6 Microarray data processing
Microarray data were analyzed using R and Microsoft Excel. Each tissue was analyzed separately. Quality assessment of the data using Bioconductor array QualityMetrics package 21 resulted in the removal of 7 outliers: amygdala 16 (feno-treated) and 31 (beza-treated); PFC 6 (tesa-treated) and 36 (feno-treated); and liver 11 (beza-treated), 27 (tesa-treated) and 36 (feno-treated). Liver 11 and 36, amygdala 16 and 31, and PFC 6 and 36 were on a faulty beadchip. Variance stabilization transformation and quantile normalization were used to pre-process the data using the Bioconductor Lumi package 14. Groups being compared were normalized together, i.e., saline and beza, saline and tesa, and saline and feno. Lastly, outlier values for each gene within a group were removed using Grubbs’ test (p<0.05). After data processing, the total number of unique genes reliably expressed (i.e., detection p < 0.05 and detected on at least 80% of the samples) in each tissue region for each treatment is provided (Table 1).
Table 1.
Number of unique genes detected on microarrays and differentially expressed in the amygdala, PFC and liver following tesaglitazar, fenofibrate and bezafibrate treatment.
| Genes detected on array | # genes DE (p < 0.05) | ||
|---|---|---|---|
| Amygdala | Feno | 14164 | 2294 |
| Tesa | 14272 | 1273 | |
| Beza | 14179 | 1349 | |
| PFC | Feno | 13745 | 3996 |
| Tesa | 13704 | 1664 | |
| Beza | 13940 | 1112 | |
| Liver | Feno | 11364 | 5350 |
| Tesa | 11368 | 6259 | |
| Beza | 11441 | 2517 |
The first column displays the number of unique genes detected using the criteria that the gene must appear on 80% or more of the microarrays in the groups being compared, with a detection p-value cutoff < 0.05. The second column displays the number of unique differentially expressed (DE) genes in the amygdala, PFC and liver after fenofibrate (feno), tesaglitazar (tesa) and bezafibrate (beza) treatment at p < 0.05.
2.7 Differential Expression Analysis
To detect genes differentially expressed between treated and control mice, we used the Bioconductor package Limma to fit a linear model for each gene 57. Differential expression analysis produced a top-table, a list of Illumina IDs and their corresponding gene symbols, fold changes (expression level of treated relative to control mice) and p values for the t-test statistic. In order to mitigate the number of false positives but avoid discarding potentially important genes, we used a relaxed statistical significance cut-off value of p < 0.05 (uncorrected) for all analyses in combination with multiple bioinformatics approaches. This technique has been successfully applied in previous studies 7, 34, 42, 44, 48, 66. In all reported analyses, treatment-regulated genes are those differentially expressed at p < 0.05.
2.8 WGCNA
For a systems-level study of the transcriptome, we identified co-expressed genes using weighted gene co-expression network analysis (WGCNA) as described previously 42. Each tissue region was analyzed separately. All reliably detected genes were included in the network construction, and data from all treatments (feno, tesa, beza and saline) were used to detect co-expression patterns. Signed networks were constructed using R and custom functions available at http://www.genetics.ucla.edu/labs/horvath/CoexpressionNetwork/. The power was set to β=11, β=14 and β=7 for the amygdala, PFC and liver network, respectively, and minimum module size of 100, 150, and 100 genes for amygdala, PFC and liver, respectively 27. A dendrogram cut height of 0.99 was used for amygdala and PFC, and 0.995 was used for liver. Gene modules corresponding to branches of the dendrogram were labeled in unique colors. Genes whose profile failed to cluster in the network were labeled in grey. A module was treatment-responsive if it contained more genes with expression changes after PPAR agonist treatment than was expected by chance (hypergeometric p < 0.05).
2.9 Functional annotation of genesets
We used several complementary approaches to better understand the global interactions of the gene lists resulting from differential expression analysis and to characterize the treatment-responsive modules resulting from WGCNA.
WEB-based GEne SeT AnaLysis Toolkit (WebGestalt, http://www.webgestalt.org/) was used to conduct overrepresentation analysis (ORA) of pathways, gene ontologies, phenotypes and protein-protein interactions of the top-tables and treatment-responsive modules. For each list of differentially expressed genes and treatment-responsive modules, all unique genes in the list were submitted to WebGestalt based on gene symbol. The background list for each tissue region consisted of all genes that were used to construct the network.
Top-tables and treatment-responsive modules were further assessed for the overrepresentation of cell-type specific genes. Modules or top-tables that contained more cell-type specific genes than expected by chance (hypergeometric p < 0.05) were designated as enriched for that particular cell-type. Genes were matched by gene symbols. The lists of genes that are preferentially expressed in a particular cell type were from published data. Amygdala and PFC data were queried for the following brain cell types: microglia 37, oligodendrocytes 10, astrocytes 10, neurons 10, GABAergic neurons 60 and glutamatergic neurons 60. Liver was queried for liver cell types: Kupffer, hepatocytes and hepatic stellate cells 63. The list of PPAR targets were curated from the literature and target prediction (downloaded from tfacts.org). The list of ethanol-consumption related genes was curated from mouse gene knockout, gene overexpression and microarray data (found on the INIA IT-GED website at http://inia.icmb.utexas.edu/).
3. Results
3.1 Effect of PPAR agonists on ethanol and water consumption
We tested effects of PPAR agonists on ethanol consumption and preference in continuous 2BC drinking in male C57BL/6J mice. Figure 1 (left panel) shows the total ethanol consumption over 24 hours averaged for days 5 and 6. Feno and tesa decreased ethanol consumption by approximately 50% and 75%, respectively, while beza had no statistically significant effect (Figure 1). Ethanol preference followed the same pattern as ethanol consumption, and none of the treatments altered total fluid intake (Figure 1).
Figure 1. PPAR agonists decrease ethanol consumption and preference without changing water intake.
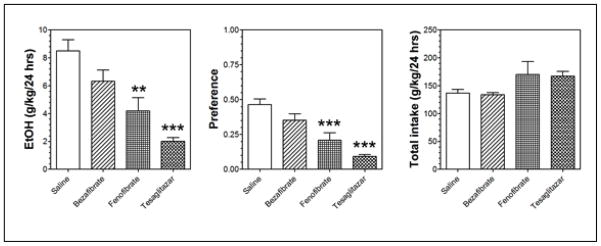
Ethanol consumption in grams per kilogram of mouse body weight over a 24-hour period averaged for days 5 and 6. We calculated preference as the amount of ethanol consumed divided by the total amount of fluids consumed per day (a value > 50% indicates a preference for ethanol). Values are expressed as mean ± S.E.M. N = 8 mice in each group: bezafibrate (pan-PPAR agonist), tesaglitazar (dual PPARα and γ agonist) and fenofibrate (PPARα agonist). Overall fluid intake is shown on the far right. Statistical analysis was performed by a two-way ANOVA with repeated measurements and Bonferroni post hoc test. *** p-value < 0.0001 and ** p-value < 0.001.
3.2 Genes differentially expressed by PPAR agonist treatment in mouse amygdala, PFC and liver
We used principle component analysis (PCA) to analyze gene expression values. The amygdala, PFC and liver samples clustered separately, indicating that tissue region was the largest source of variance in the data (Figure S1A). Hierarchical clustering (HCL) confirmed the PCA results (Figure S1B). Liver samples clustered into two groups: one containing beza and saline samples (not effective for reducing alcohol consumption) and the other containing tesa and feno samples (effective for reducing alcohol consumption) (Figure S1C).
Next we performed differential expression analysis to determine the genes that are regulated by each PPAR agonist in the amygdala, PFC and liver. The top-tables (Tables S1–S3) and the number of differentially expressed genes (Table 1) are shown. Fold changes after feno and tesa treatment are modest in brain relative to those in liver. Fold changes after beza treatment are similar across tissues (Table S4). Note that each Illumina ID maps to only one gene, but one gene can map to several Illumina IDs. Thus, it is possible to have the same gene both up- and down-regulated. This could indicate differential regulation of splice-variants or reflect false positives that are expected in whole-genome analyses. In some cases, the number of unique genes in the up- and down-regulated groups is thus higher than the total number of unique genes in the top-table.
We assessed cell-type specificity in the up- and down-regulated genes for each treatment by determining if there is an overrepresentation of cell-type specific genes in the regulated gene-sets (Figure 2). In the amygdala, each PPAR agonist regulated a large number of genes that are preferentially expressed in neurons (feno and tesa p < 0.002; beza p < 0.02) (Figure 2A). In order to classify potential targeted neurons, we used datasets of genes preferentially expressed in GABAergic and glutamatergic neurons. All treatments down-regulated glutamatergic genes, and feno and tesa (but not beza) up-regulated GABAergic genes in the amygdala (Figure 2A). There was not an overrepresentation of either neuronal subtype in the PFC (Figure 2b).
Figure 2. PPAR agonists alter gene expression in the amygdala and PFC and produce a strong neuronal signature in the amygdala.

The number of genes up- and down-regulated by fenofibrate (feno) (N=9), tesaglitazar (tesa) (N= 9 – 10) and bezafibrate (beza) (N=9 –10) as compared to saline control (N=9 – 10) in the amygdala (A) and PFC (B). The numbers above and below the bars represent numbers of up- and down-regulated genes, respectively. We used lists from previously published data containing genes that are preferentially expressed in certain cell types to examine the cell-type specificity of PPAR agonists and tested for enrichment of genes that are preferentially expressed in astrocytes, microglia, neurons, oligodendrocytes (oligos), glutamatergic neurons and GABAergic neurons. The boxes indicate the cell-types that are overrepresented (hypergeometric p-value < 0.05) in the corresponding gene-set.
In order to link PPAR agonist-regulated genes with changes in alcohol drinking, we tested the differentially expressed genes for overlap with a list of genes known to affect alcohol consumption (based on studies of mutant mice). In the amygdala, feno and tesa, but not beza treatment groups, contained more alcohol-related genes than expected by chance (hypergeometric p < 0.007 for feno and tesa; p = 0.46 for beza). We used the non-effective beza treatment to filter out non-related genes and found that genes regulated by both feno and tesa but not beza had a greater number of alcohol-related genes than expected by chance in both the amygdala and PFC (Figure 3). These genes have already been experimentally validated and shown to change alcohol consumption, thus supporting our approach of using the non-effective treatment to filter out non-related genes.
Figure 3. Genes implicated in alcohol consumption (from mutant mouse studies) that are in PPAR agonist-regulated genesets in the amygdala and PFC.
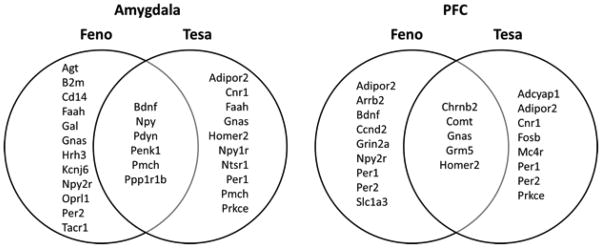
The diagrams show the alcohol-related genes regulated by PPAR agonists in the amygdala (left) and PFC (right). Genes were determined to be alcohol-related if mice lacking or over-expressing that gene showed differences in alcohol consumption compared to wild-type mice. Genes regulated by fenofibrate (feno) only, tesaglitazar (tesa) only, and both feno and tesa are shown on the left, right, and center of each diagram, respectively, excluding those genes also regulated by the ineffective bezafibrate treatment.
In the liver, tesa treatment produced the most genomic perturbations (Figure S2A). As expected, known PPAR targets were enriched for each PPAR agonist treatment in the liver (Figure S2A). Overrepresentation analysis (ORA) revealed enrichment of pathways and biological processes related to PPAR signaling, fatty acid metabolism and peroxisome signaling (Figure S2B). This corroborates previous data and also serves to validate our microarray experiments. Hepatic stellate cells were the only enriched cell type (other than hepatocytes) in liver genes that were up-regulated by tesa treatment (Figure S2A). The hypergeometric p-statistics for the cell-type enrichment analyses for all tissues are provided (Table S5).
3.3 Detailed gene expression analysis after PPAR agonist treatment
Tesa, feno and beza activate different combinations of PPAR isotypes with varying affinity (Table S6), and this is expected to produce unique genomic signatures. To understand the relationship between the feno-, tesa- and beza-regulated genes, we evaluated the degree of overlap between the top-tables (Figure 4) and found that it is greater than expected by chance for all overlapping gene regions (hypergeometric p < 0.05). There are many commonly regulated genes among the three PPAR agonists, but each also regulates a unique set of target genes.
Figure 4. Comparison of the transcriptomes in amygdala and PFC following fenofibrate, tesaglitazar and bezafibrate treatment.

The number of distinct and overlapping unique genes changed (p < 0.05) by treatment with fenofibrate (feno), tesaglitazar (tesa) and bezafibrate (beza) in the amygdala (A) and PFC (B). We assessed the gene-set containing feno- and tesa-responsive genes (excluding beza-responsive genes) for enriched pathways and gene ontologies because only feno and tesa decreased ethanol drinking. The boxes contain the overrepresented functional pathways and/or gene ontologies (hypergeometric p < 0.05). The number in parentheses beside the name of the pathway or ontology represents the number of genes in that category. Only selected pathways and ontologies are reported in this figure. Tables S7 – S9 provide the full list of the overrepresented KEGG/Wiki pathways and gene ontologies resulting from ORA of the key gene-sets for amygdala, PFC and liver.
We examined highly enriched categories that are most likely relevant in mediating the effects of the PPAR agonists. In order to emphasize the PPAR agonist-induced pathways and ontologies that might be regulating alcohol consumption, we chose a few genes from each enriched category, giving preference to those genes that have also been shown to be regulated by alcohol in the INIA IT-GED (http://inia.icmb.utexas.edu/).
We used the non-effective treatment as a filter to identify genes that were differentially expressed after feno and tesa but not beza treatment. There were 424 genes in this category in the amygdala and 467 in the PFC, and Table 2 highlights the top 20 up- and down-regulated genes in these key gene-sets. In general, if a transcript was changed by both feno and tesa, the change was in the same direction, especially in the amygdala.
Table 2.
The top 20 up- and down-regulated genes differentially expressed after treatment with tesaglitazar and fenofibrate but not bezafibrate.
| Gene Name | Description | feno FC | tesa FC | |
|---|---|---|---|---|
|
| ||||
| Up-regulated (amygdala) | Pdyn | prodynorphin | 1.56 | 1.55 |
| Tac1 | tachykinin 1 | 1.49 | 1.48 | |
| Scg2 | secretogranin II | 1.47 | 1.29 | |
| Avp | arginine vasopressin | 1.46 | 1.52 | |
| Tmem91 | transmembrane protein 91 | 1.43 | 1.22 | |
| Meis1 | Meis homeobox 1 | 1.43 | 1.27 | |
| Gpr88 | G-protein coupled receptor 88 | 1.41 | 1.85 | |
| Meis2 | Meis homeobox 2 | 1.40 | 1.42 | |
| C130007D14 | diacylglycerol kinase kappa | 1.40 | 1.26 | |
| LOC100046259 | calcium channel, voltage-dependent, alpha 2/delta subunit 2; similar to Cacna2d2 protein | 1.40 | 1.31 | |
| A230065H16Rik | RIKEN cDNA A230065H16 gene | 1.38 | 1.21 | |
| Rgs9 | regulator of G-protein signaling 9 | 1.38 | 1.65 | |
| Gng4 | guanine nucleotide binding protein (G protein), gamma 4 | 1.36 | 1.22 | |
| AW551984 | expressed sequence AW551984 | 1.35 | 1.20 | |
| Zfhx3 | zinc finger homeobox 3 | 1.35 | 1.18 | |
| Ppp1r1b | protein phosphatase 1, regulatory (inhibitor) subunit 1B | 1.34 | 1.67 | |
| Penk1 | preproenkephalin | 1.34 | 1.49 | |
| Zcchc12 | zinc finger, CCHC domain containing 12 | 1.33 | 1.18 | |
| Wfs1 | Wolfram syndrome 1 homolog (human) | 1.33 | 1.35 | |
| Dgkk | diacylglycerol kinase kappa | 1.33 | 1.21 | |
|
| ||||
| Down- regulated (amygdala) | C1ql2 | complement component 1, q subcomponent- like 2 | −2.28 | −1.83 |
| Hopx | HOP homeobox | −1.48 | −1.38 | |
| E030026I10Rik | E030026I10Rik | −1.47 | −1.25 | |
| Crhbp | corticotropin releasing hormone binding protein | −1.43 | −1.17 | |
| E030026I10Rik | E030026I10Rik | −1.42 | −1.27 | |
| Neurod2 | neurogenic differentiation 2 | −1.41 | −1.35 | |
| Nfix | nuclear factor I/X | −1.41 | −1.41 | |
| Nfib | nuclear factor I/B | −1.41 | −1.30 | |
| Gm484 | netrin 5 | −1.40 | −1.26 | |
| 9530064J02 | 9530064J02 | −1.40 | −1.20 | |
| Pvrl3 | poliovirus receptor-related 3 | −1.38 | −1.32 | |
| Hsd11b1 | hydroxysteroid 11-beta dehydrogenase 1 | −1.38 | −1.36 | |
| Syne1 | synaptic nuclear envelope 1 | −1.38 | −1.23 | |
| Hsd11b1 | hydroxysteroid 11-beta dehydrogenase 1 | −1.35 | −1.38 | |
| Adcy1 | adenylate cyclase 1 | −1.34 | −1.28 | |
| Fam131a | family with sequence similarity 131, member A | −1.33 | −1.25 | |
| Odz2 | odd Oz/ten-m homolog 2 (Drosophila) | −1.32 | −1.31 | |
| Pcdh20 | protocadherin 20 | −1.32 | −1.25 | |
| Cort | cortistatin | −1.30 | −1.20 | |
| Nrp | neuropilin 1 | −1.30 | −1.31 | |
|
| ||||
| Up-regulated (PFC) | Dusp1 | dual specificity phosphatase 1 | 1.33 | 1.32 |
| Inmt | indolethylamine N-methyltransferase | 1.13 | 1.24 | |
| Bhlhb2 | basic helix-loop-helix family, member e40 | 1.24 | 1.23 | |
| Asah3l | alkaline ceramidase 2 | 1.08 | 1.21 | |
| Cct8 | chaperonin containing Tcp1, subunit 8 (theta) | 1.14 | 1.20 | |
| Calm2 | calmodulin 3; calmodulin 2; calmodulin 1 | 1.23 | 1.19 | |
| Sntb2 | syntrophin, basic 2 | 1.15 | 1.19 | |
| Egr1 | early growth response 1 | 1.20 | 1.17 | |
| 1810030N24Rik | RIKEN cDNA 1810030N24 gene | 1.12 | 1.15 | |
| Terf2 | telomeric repeat binding factor 2 | 1.22 | 1.14 | |
| Hspb8 | heat shock protein 8 | 1.12 | 1.14 | |
| Sv2b | synaptic vesicle glycoprotein 2 b | 1.17 | 1.13 | |
| Ier5l | immediate early response 5-like | 1.11 | 1.13 | |
| Clk1 | CDC-like kinase 1 | 1.20 | 1.11 | |
| Idh2 | isocitrate dehydrogenase 2 (NADP+), mitochondrial | 1.15 | 1.11 | |
| Klhl21 | kelch-like 21 (Drosophila) | 1.13 | 1.11 | |
| 2010204O13Rik | 2010204O13Rik | 1.18 | 1.11 | |
| Chst10 | carbohydrate sulfotransferase 10 | 1.07 | 1.11 | |
| Lamp2 | lysosomal-associated membrane protein 2 | 1.14 | 1.10 | |
| Sertad1 | SERTA domain containing 1 | 1.07 | 1.10 | |
|
| ||||
| Down- regulated (PFC) | Opalin | oligodendrocytic myelin paranodal and inner loop protein | −1.31 | −1.15 |
| Mbp | myelin basic protein | −1.22 | −1.22 | |
| Ap2a1 | adaptor protein complex AP-2, alpha 1 subunit | −1.22 | −1.09 | |
| Hbb-b1 | hemoglobin, beta adult major chain; hemoglobin, beta adult minor chain | −1.22 | −1.47 | |
| 1110002E23Rik | hypothetical protein LOC100047839 | −1.21 | 1.06 | |
| Cldn5 | claudin 5 | −1.18 | −1.15 | |
| B930041F14Rik | RIKEN cDNA B930041F14 gene | −1.16 | −1.08 | |
| Rabac1 | Rab acceptor 1 (prenylated) | −1.16 | −1.07 | |
| Copz1 | coatomer protein complex, subunit zeta 1 | −1.15 | −1.08 | |
| Cops7a | constitutive photomorphogenic homolog, subunit 7a (Arabidopsis thaliana) | −1.15 | −1.08 | |
| Spna2 | spectrin alpha 2 | −1.15 | −1.07 | |
| Hras1 | Harvey rat sarcoma virus oncogene 1 | −1.14 | −1.09 | |
| Ext1 | exostoses (multiple) 1 | −1.14 | −1.08 | |
| Slc8a1 | solute carrier family 8 (sodium/calcium exchanger), member 1 | −1.13 | −1.08 | |
| LOC654842 | LOC654842 | −1.13 | −1.09 | |
| Fzr1 | fizzy/cell division cycle 20 related 1 (Drosophila) | −1.13 | −1.05 | |
| 1110034O24Rik | transportin 2 (importin 3, karyopherin beta 2b) | −1.12 | 1.05 | |
| Pgam5 | phosphoglycerate mutase family member 5 | −1.12 | −1.07 | |
| Tufm | predicted gene 9755; Tu translation elongation factor, mitochondrial | −1.12 | −1.07 | |
| Dvl1 | dishevelled, dsh homolog 1 (Drosophila) | −1.12 | −1.07 | |
Gene expression was measured in the amygdala and PFC after treatment with fenofibrate (feno), tesaglitazar (tesa) or bezafibrate (beza). The table displays the top 20 genes altered by feno and tesa but not beza, with the highest and lowest fold change (FC) (treated versus saline control) in the amygdala and PFC. The fold change values for feno and tesa are displayed in columns 3 and 4, respectively (for the up-regulated genes) and columns 7 and 8, respectively (for the down-regulated genes). The beza fold change is not displayed since these genes were not regulated by beza (i.e., p-value > 0.05).
The 424 genes regulated by feno and tesa in the amygdala are enriched for genes involved in synaptic transmission (e.g., Gabrg1, Abat and Bdnf) and dopaminergic synaptic transmission (e.g., Pmch, Drd1a, Ddc, Ppp1r1b and Crhbp). There was also an up-regulation of genes involved in anxiety-related responses (e.g., Npy, Tac1, Pdyn, Drd1a, Pde1b and Grm8).
In addition to the relationship of treatment-regulated genes within a single region, we were interested in the relationship of treatment-regulated genes between regions (Figure S3). The degree of overlap was greater than expected by chance between the amygdala and PFC for all three treatments (hypergeometric p < 0.05), suggesting that PPAR agonists differentially regulate genes in the brain versus the liver. Forty-one genes were regulated by both feno and tesa in both brain areas, including many genes involved in synaptic transmission (e.g., Nell2, Ppp2r5d, Rasgrf1, Syt1, Syn3, B3gat1, Sv2b, Sh3kbp1, Crhbp and Cldn5).
3.4 Systems level analysis of transcriptional organization using WGCNA
To gain a systems-level understanding of the transcriptome, we used WGCNA to build gene co-expression networks for each tissue region. It is thought that genes that co-express and co-vary perform similar biological functions or act in the same biological pathway (“guilty by association” principle) 29. WGCNA is a complementary approach to differential expression and provides a reference for interpretation and validation of differential expression analysis. We identified the gene–gene regulatory relationships that were activated by PPAR agonists, which we refer to as treatment-responsive modules. This approach has been validated by several independent research groups as a method for predicting genes that underlie a biological or molecular process 19, 36, 37, 53, 64, 67.
The networks for amygdala (Figure 5A), PFC (Figure 5B) and liver (Figure S2C) are displayed as dendrograms. Results from cell-type enrichment analyses for treatment-responsive modules are displayed in a column adjacent to the dendrogram. The p values from these analyses can be found in Tables S10 and S11 for amygdala and PFC, respectively. The arrows indicate the direction of fold-change induced by the PPAR agonist for the PPAR agonist-regulated genes in that module.
Figure 5. Weighted gene co-expression network analysis of the transcriptome in the amygdala and PFC after PPAR agonist treatment.
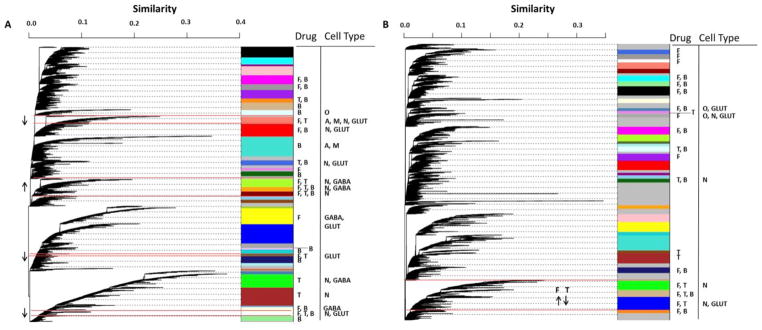
The networks are displayed as a dendrogram where each leaf is a gene and the branches represent genes clustered together based on similar expression patterns across all samples. Branches were cut (i.e. modules were defined) using dynamic TreeCut function in R based on a cut height of 0.99. Similarity indicates interconnectedness, with genes closer to 1 being the most highly correlated. Modules are indicated by the arbitrary color bars. Treatment-responsiveness is indicated by the letter adjacent to the module under Drug (T, tesaglitazar; F, fenofibrate; B, bezafibrate). The modules that are responsive to both fenofibrate and tesaglitazar are outlined in red, and the direction of fold-change of the regulated genes is indicated by the arrow. Cell-type specific enrichment analysis results are indicated by the letter under Cell Type (N, neuron; O, oligodendrocyte; A, astrocyte; M, microglia; GLUT, glutamate; GABA, gamma-aminobutyric acid). A=amygdala; B=PFC.
We identified 24 out of 39 modules that were treatment-responsive in the amygdala. The majority of genes clustered into co-expressed modules with only 1,352 out of 19,783 genes in the grey category (i.e., expression profiles that failed to cluster). Six modules were responsive to both working treatments. The up-regulated treatment-responsive modules (greenyellow, orange and darkred) were enriched with known neuronal and GABAergic genes (Table S11), corroborating the cell-type enrichment analysis of the tesa- and feno-regulated genesets from DE. About half of the co-expressed GABAergic genes were also up-regulated by feno and tesa; for example, Slc32a1, the GABA vesicular transporter was up-regulated 29% by feno and 24% by tesa and Abat, the enzyme responsible for catabolism of GABA into succinic semialdehyde was up-regulated 16% for feno and 13% for tesa. We tested the up-regulated modules for overlap with a list of genes known to affect alcohol consumption (based on studies of mutant mice), and found that two of these modules contained more alcohol consumption-related genes than expected by chance (hypergeometric p < 0.01). Over half of the co-expressed alcohol consumption-related genes were also regulated by feno and tesa; for example, Pdyn (up-regulated 23% by feno and 24% by tesa), Penk1 (up-regulated 34% by feno and 49% by tesa) and Ppp1r1b (up-regulated 34% by feno and 67% by tesa) modulate alcohol consumption and are changed (in a coordinated manner) by feno and tesa.
Webgestalt identified G-protein coupled receptor signaling pathways and neuro-active ligand receptor interaction pathways that were enriched in the up-regulated modules. Genes involved in neuropeptide signaling, neuropeptide receptor binding and neuropeptide hormone activity were also prominent. Study of the protein-protein interactions (PPI) identified several networks in the up-regulated modules, including adenylate cyclase activity and regulation of transcription processes. Genes critical for synaptic transmission dominated the up-regulated modules, including genes coding for ion channels such as voltage-gated potassium, calcium and sodium channels and GABA and glycine receptors.
The down-regulated treatment-responsive modules in the amygdala (salmon, white and darkolivegreen) were enriched for neuronal and glutamatergic genes (Table S11). The salmon module was also enriched for astrocytic and microglial genes. The down-regulated modules in the amygdala contained a large PPI network that included 76 genes in the glutamate receptor signaling pathway. Genes involved in cell surface receptor activity, including ion channel activity and tyrosine kinase signaling activity, were also prominent here.
We identified 20 out of 35 modules that were treatment-responsive in the PFC with 4,853 out of 19,400 genes in the grey category. Three modules (green, tan and blue) were responsive to both working treatments (Table S11) and were enriched for genes that are up-regulated by feno and down-regulated by tesa. This is in contrast to the amygdala where the treatment-responsive modules were enriched for feno- and tesa-regulated genes with the same direction of fold change. Two of the three modules were enriched with neuronal genes. We found PPI networks related to glutamate signaling pathways in two of the three modules, and glutamate receptor activity ontologies were enriched in all three treatment-responsive modules. Families of genes that were enriched included those involved in synaptic transmission (e.g., Kcna1, Kcnd2, Kcnj12, Scn3a, Cacna2d1, Gabrb2, Itpr1, Trpc1), especially as it pertains to learning (long-term depression), mostly due to the coordinated regulation of many glutamate receptors (e.g., Grm7, Gria1, Gria3, Grid2, Grin1). One module (tan) was enriched with genes known to be important for alcohol consumption (Bdnf, Ccnd2, Gabrb2, Gnas, Grin2a and Grm5) with a hypergeometric p < 0.02.
4. Discussion
PPARs are nuclear hormone receptors that act as ligand-activated transcription factors. PPAR agonists are anti-inflammatory, neuroprotective, hepatoprotective and have anti-addictive properties 9, 15, 39, 59. Little is known about the mechanisms underlying their CNS effects; thus, we used an unbiased genomic approach to characterize expression profiles in amygdala and PFC by two PPAR agonist treatments that are effective (feno and tesa), and one that is not effective (beza), in reducing alcohol consumption. The transcriptomes were examined using several bioinformatic approaches, including differential expression analysis and WGCNA. All transcripts were analyzed simultaneously, providing a detailed molecular phenotype of brain responses following activation of the PPAR signaling pathway. A dataset of expression levels for most genes in the mouse genome has been made publicly available in Gene Expression Omnibus. This profile will also aid researchers studying other brain diseases that are responsive to PPAR agonists (Alzheimer’s, Parkinson’s, and Huntington’s disease, ischemic brain injury, and schizophrenia), and help define neural mechanisms (and therefore potential treatment) of several CNS diseases.
We demonstrate that tesaglitazar and fenofibrate decrease alcohol consumption in male C57BL/6J mice in a 2BC paradigm. Tesaglitazar and fenofibrate predominantly activate PAPRα and γ and PPARα, respectively 30, 65. Consistent with our results for tesaglitazar, other PPARγ agonists (pioglitazone and rosiglitazone) decreased alcohol consumption in a 2BC paradigm in rats 58, 59. However, different effects of PPARα agonists on alcohol consumption have been reported. Consistent with our results for fenofibrate, Barson et al. (2009) found that the PPARα agonist gemfibrozil (50 mg/kg i.g.) decreased voluntary alcohol consumption in male Sprague Dawley rats in a 2BC test using 7% alcohol 5. However, Schlicht et al. (1987) reported that clofibrate (0.5% diet, approximately 300 mg/kg/day) increased voluntary alcohol consumption in male spontaneous hypertensive rats in a 2BC paradigm using 30% alcohol 55. These conflicting results may be due to the different experimental parameters, including differences in drugs, dosages, rat strains and ethanol concentrations.
Bezafibrate (α/β,δ/γ agonist) did not decrease alcohol consumption in our study. There are a few considerations that might account for this. β/δ activation might oppose or prevent action at α and γ subunits. Testing a PPAR agonist with specificity for β/δ will be necessary to help determine why bezafibrate was not effective. Furthermore, it should be noted that α/β/γ isotypes function as a triad, and β/δ regulates the expression level and activity of PPAR α and γ 2, making it difficult to determine the role of a single PPAR isotype in alcohol drinking behavior following bezafibrate treatment. Finally, it is important to consider the doses of the drugs used for our studies. We compared the drug dosages in two ways: 1) in comparison to the human dose calculated as mg/body surface area, a validated measure for human-mouse comparisons 46 and 2) as a ratio of dose to the half maximal effective concentration (EC50) required for subtype-specific action 30, 65 (Table S6). Fenofibrate and tesaglitazar were used at about 5–7 times the human dose whereas bezafibrate was equivalent to the human dose. We did not use higher doses of bezafibrate because liver changes in mice have been reported with 20 mg/kg body weight 24. The dose/EC50 ratio shows that fenofibrate has selectivity for PPARα (8.3) over γ (0.6), and tesaglitazar has selectivity for γ (6) over α (0.05). In contrast, the ratios for bezafibrate are lower for all three PPARs (0.8 for α, 1.4 for γ and 0.7 for β/δ) (Table S6). It is possible that the dose of bezafibrate used provided less activation of PPARs, possibly accounting for its weaker effects.
PPAR agonists induced both up- and down-regulated genes in the amygdala, PFC and liver. Many of these genes have not been previously implicated in PPAR actions, including some that are regulated by all three PPAR agonists in multiple tissues and contain a PPAR response element in the promoter region (e.g., Dbp, Gm129 and Tsc22d3). Therefore this study reveals potentially novel PPAR agonist targets which may be relevant for other pathological conditions. Because bezafibrate is a pan-PPAR agonist, we expected it to produce the greatest number of gene expression changes, especially considering that the PPARβ/δ subunit is the most abundant isotype in brain 35. However, beza produced the fewest expression changes in all tissues studied, while feno produced the most changes in amygdala and PFC, and tesa produced the most changes in liver. These findings are consistent with the behavioral results showing that bezafibrate was ineffective while fenofibrate and tesaglitazar decreased alcohol consumption.
Cell-type enrichment analysis of the differentially expressed genes indicates that the effective treatments (feno and tesa) target a subset of GABAergic interneurons in the amygdala that beza does not. Results from WGCNA show that GABAergic signaling is regulated in a coordinated manner by feno and tesa in the amygdala. The change in expression of GABA neurons is consistent with long-standing evidence for the GABAergic system in alcohol actions 62. A potential increase in GABAergic signaling resulting from expression changes of multiple GABA-related transcripts could play a role in the anticonvulsant properties of PPAR agonists 43, 45 and the ability of these drugs to suppress alcohol withdrawal signs 59.
WGCNA identified several coordinately-expressed groups of genes (modules) that were treatment-responsive. Six modules in the amygdala and three in the PFC were responsive to both effective treatments (feno and tesa). The direction of change for the feno- and tesa-regulated genes is in the same direction for amygdala (but not for PFC), suggesting that the expression changes in amygdala are more crucial for mediating decreased ethanol consumption at the time point analyzed. In the amygdala, many of the differentially expressed (up-regulated) neuropeptide signaling genes were also coordinately regulated by feno and tesa, respectively, as follows: Avp (46%; 52%), Pdyn (23%; 24%), Penk1 (34%; 49%), Tac1 (49%; 48%), Tac2 (16%; 12%), Scg2 (47%; 29%), Gnas (7%; 6%), Npy (6%; 7%) and Pmch (8%; 7%). There were 14 other neuropeptide genes that were co-expressed in the same module, but not significantly regulated by feno and tesa. Neuropeptide signaling in the amygdala has established roles in stress/anxiety and alcohol drinking behavior. Pioglitazone and rosiglitazone (PPARγ agonists) demonstrated anti-depressant-like effects in rodents 1, 51 and rosiglitazone reduced physiological responses to psychological stress in rats 50. This evidence, in combination with our gene expression results, suggests that the role of PPAR agonists in stress/anxiety response might be important for their effects on ethanol consumption and is a promising area of study.
Dysregulation of the dopaminergic system has been linked to addiction 16. In our study, several components of dopaminergic transmission in the amygdala were up-regulated by feno and tesa, respectively, as follows: Pmch (8%; 6%), Drd1a (32%; 32%), Drd2 (7%; 20%), Ddc (28%; 11%), Ppp1r1b (34%; 67%), Rasd2 (18%; 19%), Rgs9 (38%; 65%) and Slc10a4 (13%; 17%). Furthermore, WGCNA revealed that all of these genes were co-expressed in the same module (greenyellow), which was responsive to the effective treatments and contained many genes linked to alcohol consumption. This substantiates previous findings that PPARα activation modulates activity of dopamine cells 33 and further supports a role of dopamine in alcohol-drinking behavior.
Given the evidence that neuroimmune signaling contributes to alcohol consumption and dependence (for review see 32), these drugs might be expected to decrease alcohol consumption through their anti-inflammatory effects. However, our data do not support prominent neuroimmune regulation by PPAR agonists. Instead these drugs seem to be targeting neurons and affecting synaptic transmission since there are more genes preferentially expressed in neurons than expected by chance within the PPAR agonist-regulated gene-sets. Moreover, there was a lack of genes associated with microglia in the regulated gene-sets. However, one of the treatment-responsive modules in the amygdala (salmon) was also enriched with microglial, astrocytic and cytokine receptor signaling genes. Overall, the results from WGCNA corroborated the strong neuronal signature of PPAR agonists in the CNS. This neuronal signature was unexpected and represents a surprising and significant finding.
There are two published microarray analyses of brain gene expression after PPAR agonist treatment. First, Chikahisa and colleagues fed mice a beza diet and analyzed brain gene expression in the hypothalamus to assess the effects of PPAR activation on circadian rhythm 11. Several genes were commonly regulated by beza in their dataset and in our amygdala and PFC datasets, including Arpp21, Chmp4b, Crem, Psmc3ip and Dtnb. Second, Searcy and colleagues delivered pioglitazone, a PPARγ agonist, to triple transgenic Tg mice (a line used to model Alzheimer’s disease) and analyzed its effect on brain gene expression in the hippocampus 56. Despite many experimental differences between this study and ours, there are remarkable similarities in the gene expression profiles. The overlap between their top-table and ours was greater than expected by chance for all PPAR agonist treatments in the amygdala, especially tesa (p=9.5e-08), and for tesa treatment in the PFC (p=3.09e-05). This is consistent with the activity of tesa at PPARγ (Table S6). ORA of the Searcy dataset did not support an overall pioglitazone-mediated suppression of inflammatory processes, which is consistent with our findings. Additionally, their dataset and ours both exhibit alterations in genes involved in glutamatergic signaling. Functional studies further support a role for PPPAR agonists in glutamatergic signaling. For example, pioglitazone reduced NMDA-mediated calcium currents in brain38, and the antidepressant effects of pioglitazone (mentioned above) were enhanced by co-administration of MK-801, an NMDA receptor blocker, and reversed by administration of NMDA 52. Moreover, the partial rescue of scopolamine-induced memory impairment by pioglitazone in mice was decreased by sub-effective doses of MK-801 and increased by NMDA3.
An important consideration is whether PPAR agonists decrease alcohol consumption via central or peripheral PPAR activation. The effective treatments increase Adh1 and decrease Aldh2 mRNA in the liver. This combination of changes (at the level of enzyme activity) leads to a build-up of acetaldehyde which is protective against developing alcohol dependence. Therefore it’s possible that the effects on the liver might contribute to the decreased alcohol consumption. However, Stopponi et al. (2011) found that a PPARγ agonist did not affect blood alcohol levels and blockade of central PPARs abrogated the anti-alcohol drinking effects, establishing the importance of central PPARs in this effect. The blood brain barrier penetrance of PPAR agonists is not well-studied, so the amount of drug reaching the brain is unknown. However, even if PPAR agonists do not have a direct effect in brain (because of lack of penetration), the fact that PPAR agonists change behavior suggests that there must be some change in brain signaling induced by PPAR agonists, whether it be direct or indirect. Thus, results from this study are still helpful in defining gene targets in brain to manipulate addiction-like behaviors.
A remaining question is whether the effects on alcohol consumption are mediated by PPAR-dependent or -independent mechanisms. A comparison of wild-type endothelial cells and endothelial cells lacking PPARα showed that only 26% of differentially expressed genes were PPARα-dependent after 18 hours of fenofibrate treatment 4. PPAR-independent mechanisms have also been implicated in other brain disorders. For example, inhibition of Cdk5 via a PPARγ-independent pathway decreased tau phosphorylation, a mechanism implicated in the positive effects of PPARγ agonists in Alzheimer’s disease 12. Evidence also points to a non-transcriptional (phosphorylation-mediated) interaction between PPARα and the nAChR that at least partly mediates PPARα agonist effects on nicotine dependence 33. Experiments using PPAR subunit knock-out strategies are needed to determine if the effects of feno and tesa on alcohol-consumption are PPAR-dependent or -independent.
In conclusion, these results demonstrate that changes in alcohol drinking behavior in mice following PPAR agonist administration are accompanied by changes in expression of brain genes, including many of those previously linked with regulation of alcohol consumption. Some of the gene expression changes observed in all three tissues had not been previously implicated in PPAR action. The transcriptional changes in neurons were unexpected and may be important in the behavioral effects of PPAR agonists on ethanol consumption. GABAergic interneurons, neuropeptide systems and dopaminergic signaling pathways may play a role in decreased alcohol drinking since these pathways are important for alcohol action and are associated with the effective PPAR treatments but absent in the non-effective treatment. This is the first microarray analysis of the amygdala and PFC after administration of selective PPAR agonists and will help determine the pharmacogenomic processes by which PPAR agonists decrease alcohol consumption, a critical step if these agents have a future as therapeutics for alcohol dependence.
Supplementary Material
(A) PCA was performed on the expression values of all samples. There are three distinct clusters of expression values that correspond to the three tissues used in the analyses along the first two principle components. (B) HCL of the expression data separates samples into two main groups: brain and liver. The brain samples are further subdivided into amygdala and PFC samples. (C) HCL of the expression data from liver separates samples into two main groups that correspond to treatment effectiveness. The only exceptions are the samples liver_saline- 4, which is grouped with the tesa and feno liver samples, and liver_tesa- 6, which is grouped with the saline and beza liver samples.
Figure S2: Differentially expressed genes and detailed enrichment analysis of the genes regulated by tesaglitazar, fenofibrate and bezafibrate in the liver.
(A) The number of genes up- and down-regulated by fenofibrate (feno), tesaglitazar (tesa) and bezafibrate (beza) in the liver. Numbers above and below the bars represent the number of up- and down-regulated genes, respectively. We used lists from previously published data containing genes regulated by PPAR agonists and genes preferentially expressed in hepatocytes, Kupffer cells and hepatic stellate cells to examine cell-type specificity of PPAR agonists. The boxes contain the overrepresented category (hypergeometric p-value < 0.05) in the genes corresponding to the adjacent bar. (B) The distinct and overlapping genes that are regulated by feno, tesa and beza treatment (p-value < 0.05). The boxes contain the overrepresented functional pathways and gene ontologies of the regulated genes in its corresponding gene set (hypergeometric p-value < 0.05). The number in parentheses beside the name of the pathway or ontology represents the number of genes in that category. (C) The network is displayed as a dendrogram where each leaf is a gene and the branches represent genes that are clustered together based on similar expression patterns across all samples. Branches were cut (i.e., modules were defined) using dynamic TreeCut function in R based on a cut height of 0.995. Similarity indicates interconnectedness, with genes closer to 1 being the most connected. Modules are indicated by the arbitrary color bars. Treatment-responsiveness is indicated based on which letter is next to the module (T is tesaglitazar, F is fenofibrate and B is bezafibrate). Cell-type specific enrichment analysis was performed on treatment-responsive modules (H=hepatocyte; K=Kupffer cell). Enrichment analysis was also performed to determine if known PPAR targets were enriched, and this result is also displayed under the cell-type column.
Figure S3: Common and unique gene targets regulated by PPAR agonists in the amygdala, PFC and liver.
The Venn diagrams show the distinct and overlapping genes that are regulated in the amygdala, PFC and liver by (A) fenofibrate (feno), (B) tesaglitazar (tesa) and (C) bezafibrate (beza) treatment at a p-value < 0.05. The boxes contain the overrepresented functional pathways and/or gene ontologies of the regulated genes in the corresponding gene set (hypergeometric p-value < 0.05). The number in parentheses beside the name of the pathway or ontology represents the number of genes in that category.
Highlights.
PPAR agonists decrease ethanol consumption and preference in mice.
PPAR agonists change gene expression in the amygdala and PFC of mice.
PPAR agonists target neuronal and synaptic genes in mouse amygdala and PFC.
PPAR agonists mainly up-regulate GABAergic genes in mouse amygdala.
PPAR agonists mainly down-regulate glutamatergic genes in mouse amygdala.
Acknowledgments
Funding
This work was supported by grants from the National Institutes of Health/National Institute on Alcohol Abuse and Alcoholism (NIH/NIAAA) Integrated Neuroscience Initiative on Alcoholism (INIA-West, http://www.scripps.edu/california/research/inia/; AA013520) and NIH grant AA013518 to RAH (NIH, http://www.nih.gov/).
Special thanks to Jill Benavidez and Mendy Black for performing the behavioral experiments, Igor Ponomarev for scientific editing, Jody Mayfield for editing, and Michael Arends for compiling the list of alcohol-related genes from mutant mouse data.
Abbreviations
- PPAR
Peroxisome proliferator-activated receptor
- RXR
Retinoid X receptor
- CNS
central nervous system
- VTA
ventral tegmental area
- PFC
prefrontal cortex
- WGCNA
weighted gene co-expression network analysis
- ORA
overrepresentation analysis
- GABA
gamma-aminobutyric acid
- INIA IT-GED
INIA Texas gene expression database
- 2BC
two-bottle choice
- PPI
protein-protein interaction
Footnotes
Disclosure
The authors declare no conflict of interest.
Supplementary information is available at the Neuropharmacology website.
The funders had no role in study design, data collection and analysis, decision to publish, or preparation of the manuscript. No additional external funding was received for this study.
Publisher's Disclaimer: This is a PDF file of an unedited manuscript that has been accepted for publication. As a service to our customers we are providing this early version of the manuscript. The manuscript will undergo copyediting, typesetting, and review of the resulting proof before it is published in its final citable form. Please note that during the production process errors may be discovered which could affect the content, and all legal disclaimers that apply to the journal pertain.
References
- 1.Ahmed M, Neville MJ, Edelmann MJ, Kessler BM, Karpe F. Proteomic Analysis of Human Adipose Tissue after Rosiglitazone Treatment Shows Coordinated Changes to Promote Glucose Uptake. Obesity (Silver Spring) 2010;18:27–34. doi: 10.1038/oby.2009.208. [DOI] [PubMed] [Google Scholar]
- 2.Aleshin S, Strokin M, Sergeeva M, Reiser G. Peroxisome Proliferator-Activated Receptor (Ppar)Beta/Delta, a Possible Nexus of Pparalpha- and Ppargamma-Dependent Molecular Pathways in Neurodegenerative Diseases: Review and Novel Hypotheses. Neurochem Int. 2013;63:322–30. doi: 10.1016/j.neuint.2013.06.012. [DOI] [PubMed] [Google Scholar]
- 3.Almasi-Nasrabadi M, Javadi-Paydar M, Mahdavian S, Babaei R, Sharifian M, Norouzi A, Dehpour AR. Involvement of Nmda Receptors in the Beneficial Effects of Pioglitazone on Scopolamine-Induced Memory Impairment in Mice. Behav Brain Res. 2012;231:138–45. doi: 10.1016/j.bbr.2012.03.006. [DOI] [PubMed] [Google Scholar]
- 4.Araki H, Tamada Y, Imoto S, Dunmore B, Sanders D, Humphrey S, Nagasaki M, Doi A, Nakanishi Y, Yasuda K, Tomiyasu Y, Tashiro K, Print C, Charnock-Jones DS, Kuhara S, Miyano S. Analysis of Pparalpha-Dependent and Pparalpha-Independent Transcript Regulation Following Fenofibrate Treatment of Human Endothelial Cells. Angiogenesis. 2009;12:221–9. doi: 10.1007/s10456-009-9142-8. [DOI] [PubMed] [Google Scholar]
- 5.Barson JR, Karatayev O, Chang GQ, Johnson DF, Bocarsly ME, Hoebel BG, Leibowitz SF. Positive Relationship between Dietary Fat, Ethanol Intake, Triglycerides, and Hypothalamic Peptides: Counteraction by Lipid-Lowering Drugs. Alcohol. 2009;43:433–41. doi: 10.1016/j.alcohol.2009.07.003. [DOI] [PMC free article] [PubMed] [Google Scholar]
- 6.Belknap JK, Richards SP, O’Toole LA, Helms ML, Phillips TJ. Short-Term Selective Breeding as a Tool for Qtl Mapping: Ethanol Preference Drinking in Mice. Behav Genet. 1997;27:55–66. doi: 10.1023/a:1025615409383. [DOI] [PubMed] [Google Scholar]
- 7.Blednov YA, Ponomarev I, Geil C, Bergeson S, Koob GF, Harris RA. Neuroimmune Regulation of Alcohol Consumption: Behavioral Validation of Genes Obtained from Genomic Studies. Addict Biol. 2012;17:108–20. doi: 10.1111/j.1369-1600.2010.00284.x. [DOI] [PMC free article] [PubMed] [Google Scholar]
- 8.Blednov YA, Walker D, Alva H, Creech K, Findlay G, Harris RA. Gabaa Receptor Alpha 1 and Beta 2 Subunit Null Mutant Mice: Behavioral Responses to Ethanol. J Pharmacol Exp Ther. 2003;305:854–63. doi: 10.1124/jpet.103.049478. [DOI] [PubMed] [Google Scholar]
- 9.Bordet R, Ouk T, Petrault O, Gele P, Gautier S, Laprais M, Deplanque D, Duriez P, Staels B, Fruchart JC, Bastide M. Ppar: A New Pharmacological Target for Neuroprotection in Stroke and Neurodegenerative Diseases. Biochem Soc Trans. 2006;34:1341–6. doi: 10.1042/BST0341341. [DOI] [PubMed] [Google Scholar]
- 10.Cahoy JD, Emery B, Kaushal A, Foo LC, Zamanian JL, Christopherson KS, Xing Y, Lubischer JL, Krieg PA, Krupenko SA, Thompson WJ, Barres BA. A Transcriptome Database for Astrocytes, Neurons, and Oligodendrocytes: A New Resource for Understanding Brain Development and Function. J Neurosci. 2008;28:264–78. doi: 10.1523/JNEUROSCI.4178-07.2008. [DOI] [PMC free article] [PubMed] [Google Scholar]
- 11.Chikahisa S, Tominaga K, Kawai T, Kitaoka K, Oishi K, Ishida N, Rokutan K, Sei H. Bezafibrate, a Peroxisome Proliferator-Activated Receptors Agonist, Decreases Body Temperature and Enhances Electroencephalogram Delta-Oscillation During Sleep in Mice. Endocrinology. 2008;149:5262–71. doi: 10.1210/en.2008-0285. [DOI] [PubMed] [Google Scholar]
- 12.Cho DH, Lee EJ, Kwon KJ, Shin CY, Song KH, Park JH, Jo I, Han SH. Troglitazone, a Thiazolidinedione, Decreases Tau Phosphorylation through the Inhibition of Cyclin-Dependent Kinase 5 Activity in Sh-Sy5y Neuroblastoma Cells and Primary Neurons. J Neurochem. 2013;126:685–95. doi: 10.1111/jnc.12264. [DOI] [PubMed] [Google Scholar]
- 13.Ciana P, Biserni A, Tatangelo L, Tiveron C, Sciarroni AF, Ottobrini L, Maggi A. A Novel Peroxisome Proliferator-Activated Receptor Responsive Element-Luciferase Reporter Mouse Reveals Gender Specificity of Peroxisome Proliferator-Activated Receptor Activity in Liver. Mol Endocrinol. 2007;21:388–400. doi: 10.1210/me.2006-0152. [DOI] [PubMed] [Google Scholar]
- 14.Du P, Kibbe WA, Lin SM. Lumi: A Pipeline for Processing Illumina Microarray. Bioinformatics. 2008;24:1547–8. doi: 10.1093/bioinformatics/btn224. [DOI] [PubMed] [Google Scholar]
- 15.Fischer M, You M, Matsumoto M, Crabb DW. Peroxisome Proliferator-Activated Receptor Alpha (Pparalpha) Agonist Treatment Reverses Pparalpha Dysfunction and Abnormalities in Hepatic Lipid Metabolism in Ethanol-Fed Mice. J Biol Chem. 2003;278:27997–8004. doi: 10.1074/jbc.M302140200. [DOI] [PubMed] [Google Scholar]
- 16.George O, Le Moal M, Koob GF. Allostasis and Addiction: Role of the Dopamine and Corticotropin-Releasing Factor Systems. Physiol Behav. 2012;106:58–64. doi: 10.1016/j.physbeh.2011.11.004. [DOI] [PMC free article] [PubMed] [Google Scholar]
- 17.Harris RA, Osterndorff-Kahanek E, Ponomarev I, Homanics GE, Blednov YA. Testing the Silence of Mutations: Transcriptomic and Behavioral Studies of Gaba(a) Receptor Alpha1 and Alpha2 Subunit Knock-in Mice. Neurosci Lett. 2011;488:31–5. doi: 10.1016/j.neulet.2010.10.075. [DOI] [PMC free article] [PubMed] [Google Scholar]
- 18.Heneka MT, Landreth GE. Ppars in the Brain. Biochim Biophys Acta. 2007;1771:1031–45. doi: 10.1016/j.bbalip.2007.04.016. [DOI] [PubMed] [Google Scholar]
- 19.Horvath S, Zhang B, Carlson M, Lu KV, Zhu S, Felciano RM, Laurance MF, Zhao W, Qi S, Chen Z, Lee Y, Scheck AC, Liau LM, Wu H, Geschwind DH, Febbo PG, Kornblum HI, Cloughesy TF, Nelson SF, Mischel PS. Analysis of Oncogenic Signaling Networks in Glioblastoma Identifies Aspm as a Molecular Target. Proc Natl Acad Sci U S A. 2006;103:17402–7. doi: 10.1073/pnas.0608396103. [DOI] [PMC free article] [PubMed] [Google Scholar]
- 20.Kao CH, Hsiang CY, Ho TY. Assessment of Chitosan-Affected Metabolic Response by Peroxisome Proliferator-Activated Receptor Bioluminescent Imaging-Guided Transcriptomic Analysis. PLoS One. 2012;7:e34969. doi: 10.1371/journal.pone.0034969. [DOI] [PMC free article] [PubMed] [Google Scholar]
- 21.Kauffmann A, Gentleman R, Huber W. Array qualitymetrics--a Bioconductor Package for Quality Assessment of Microarray Data. Bioinformatics. 2009;25:415–6. doi: 10.1093/bioinformatics/btn647. [DOI] [PMC free article] [PubMed] [Google Scholar]
- 22.Kerns RT, Ravindranathan A, Hassan S, Cage MP, York T, Sikela JM, Williams RW, Miles MF. Ethanol-Responsive Brain Region Expression Networks: Implications for Behavioral Responses to Acute Ethanol in Dba/2j Versus C57bl/6j Mice. J Neurosci. 2005;25:2255–66. doi: 10.1523/JNEUROSCI.4372-04.2005. [DOI] [PMC free article] [PubMed] [Google Scholar]
- 23.Kliewer SA, Forman BM, Blumberg B, Ong ES, Borgmeyer U, Mangelsdorf DJ, Umesono K, Evans RM. Differential Expression and Activation of a Family of Murine Peroxisome Proliferator-Activated Receptors. Proc Natl Acad Sci U S A. 1994;91:7355–9. doi: 10.1073/pnas.91.15.7355. [DOI] [PMC free article] [PubMed] [Google Scholar]
- 24.Knapik-Czajka M. Stimulation of Rat Liver Branched-Chain Alpha-Keto Acid Dehydrogenase Activity by Low Doses of Bezafibrate. Toxicology. 2013;306:101–7. doi: 10.1016/j.tox.2013.02.011. [DOI] [PubMed] [Google Scholar]
- 25.Koob GF, Volkow ND. Neurocircuitry of Addiction. Neuropsychopharmacology. 2010;35:217–38. doi: 10.1038/npp.2009.110. [DOI] [PMC free article] [PubMed] [Google Scholar]
- 26.Krey G, Braissant O, L’Horset F, Kalkhoven E, Perroud M, Parker MG, Wahli W. Fatty Acids, Eicosanoids, and Hypolipidemic Agents Identified as Ligands of Peroxisome Proliferator-Activated Receptors by Coactivator-Dependent Receptor Ligand Assay. Mol Endocrinol. 1997;11:779–91. doi: 10.1210/mend.11.6.0007. [DOI] [PubMed] [Google Scholar]
- 27.Langfelder P, Zhang B, Horvath S. Defining Clusters from a Hierarchical Cluster Tree: The Dynamic Tree Cut Package for R. Bioinformatics. 2008;24:719–20. doi: 10.1093/bioinformatics/btm563. [DOI] [PubMed] [Google Scholar]
- 28.Le Foll B, Di Ciano P, Panlilio LV, Goldberg SR, Ciccocioppo R. Peroxisome Proliferator-Activated Receptor (Ppar) Agonists as Promising New Medications for Drug Addiction: Preclinical Evidence. Curr Drug Targets. 2013;14:768–76. doi: 10.2174/1389450111314070006. [DOI] [PMC free article] [PubMed] [Google Scholar]
- 29.Lee I, Ambaru B, Thakkar P, Marcotte EM, Rhee SY. Rational Association of Genes with Traits Using a Genome-Scale Gene Network for Arabidopsis Thaliana. Nat Biotechnol. 2010;28:149–56. doi: 10.1038/nbt.1603. [DOI] [PMC free article] [PubMed] [Google Scholar]
- 30.Ljung B, Bamberg K, Dahllof B, Kjellstedt A, Oakes ND, Ostling J, Svensson L, Camejo G. Az 242, a Novel Pparalpha/Gamma Agonist with Beneficial Effects on Insulin Resistance and Carbohydrate and Lipid Metabolism in Ob/Ob Mice and Obese Zucker Rats. J Lipid Res. 2002;43:1855–63. doi: 10.1194/jlr.m200127-jlr200. [DOI] [PubMed] [Google Scholar]
- 31.Mangelsdorf DJ, Thummel C, Beato M, Herrlich P, Schutz G, Umesono K, Blumberg B, Kastner P, Mark M, Chambon P, Evans RM. The Nuclear Receptor Superfamily: The Second Decade. Cell. 1995;83:835–9. doi: 10.1016/0092-8674(95)90199-x. [DOI] [PMC free article] [PubMed] [Google Scholar]
- 32.Mayfield J, Ferguson L, Harris RA. Neuroimmune Signaling: A Key Component of Alcohol Abuse. Curr Opin Neurobiol. 2013;23:513–20. doi: 10.1016/j.conb.2013.01.024. [DOI] [PMC free article] [PubMed] [Google Scholar]
- 33.Melis M, Carta S, Fattore L, Tolu S, Yasar S, Goldberg SR, Fratta W, Maskos U, Pistis M. Peroxisome Proliferator-Activated Receptors-Alpha Modulate Dopamine Cell Activity through Nicotinic Receptors. Biol Psychiatry. 2010;68:256–64. doi: 10.1016/j.biopsych.2010.04.016. [DOI] [PMC free article] [PubMed] [Google Scholar]
- 34.Miller JA, Woltjer RL, Goodenbour JM, Horvath S, Geschwind DH. Genes and Pathways Underlying Regional and Cell Type Changes in Alzheimer’s Disease. Genome Med. 2013;5:48. doi: 10.1186/gm452. [DOI] [PMC free article] [PubMed] [Google Scholar]
- 35.Moreno S, Farioli-Vecchioli S, Ceru MP. Immunolocalization of Peroxisome Proliferator-Activated Receptors and Retinoid X Receptors in the Adult Rat Cns. Neuroscience. 2004;123:131–45. doi: 10.1016/j.neuroscience.2003.08.064. [DOI] [PubMed] [Google Scholar]
- 36.Mulligan MK, Rhodes JS, Crabbe JC, Mayfield RD, Harris RA, Ponomarev I. Molecular Profiles of Drinking Alcohol to Intoxication in C57bl/6j Mice. Alcohol Clin Exp Res. 2011;35:659–70. doi: 10.1111/j.1530-0277.2010.01384.x. [DOI] [PMC free article] [PubMed] [Google Scholar]
- 37.Oldham MC, Konopka G, Iwamoto K, Langfelder P, Kato T, Horvath S, Geschwind DH. Functional Organization of the Transcriptome in Human Brain. Nat Neurosci. 2008;11:1271–82. doi: 10.1038/nn.2207. [DOI] [PMC free article] [PubMed] [Google Scholar]
- 38.Pancani T, Phelps JT, Searcy JL, Kilgore MW, Chen KC, Porter NM, Thibault O. Distinct Modulation of Voltage-Gated and Ligand-Gated Ca2+ Currents by Ppar-Gamma Agonists in Cultured Hippocampal Neurons. J Neurochem. 2009;109:1800–11. doi: 10.1111/j.1471-4159.2009.06107.x. [DOI] [PMC free article] [PubMed] [Google Scholar]
- 39.Panlilio LV, Justinova Z, Mascia P, Pistis M, Luchicchi A, Lecca S, Barnes C, Redhi GH, Adair J, Heishman SJ, Yasar S, Aliczki M, Haller J, Goldberg SR. Novel Use of a Lipid-Lowering Fibrate Medication to Prevent Nicotine Reward and Relapse: Preclinical Findings. Neuropsychopharmacology. 2012;37:1838–47. doi: 10.1038/npp.2012.31. [DOI] [PMC free article] [PubMed] [Google Scholar]
- 40.Plaza-Zabala A, Berrendero F, Suarez J, Bermudez-Silva FJ, Fernandez-Espejo E, Serrano A, Pavon FJ, Parsons LH, De Fonseca FR, Maldonado R, Robledo P. Effects of the Endogenous Ppar-Alpha Agonist, Oleoylethanolamide on Mdma-Induced Cognitive Deficits in Mice. Synapse. 2010;64:379–89. doi: 10.1002/syn.20733. [DOI] [PubMed] [Google Scholar]
- 41.Ponomarev I, Rau V, Eger EI, Harris RA, Fanselow MS. Amygdala Transcriptome and Cellular Mechanisms Underlying Stress-Enhanced Fear Learning in a Rat Model of Posttraumatic Stress Disorder. Neuropsychopharmacology. 2010;35:1402–11. doi: 10.1038/npp.2010.10. [DOI] [PMC free article] [PubMed] [Google Scholar]
- 42.Ponomarev I, Wang S, Zhang L, Harris RA, Mayfield RD. Gene Coexpression Networks in Human Brain Identify Epigenetic Modifications in Alcohol Dependence. J Neurosci. 2012;32:1884–97. doi: 10.1523/JNEUROSCI.3136-11.2012. [DOI] [PMC free article] [PubMed] [Google Scholar]
- 43.Porta N, Vallee L, Lecointe C, Bouchaert E, Staels B, Bordet R, Auvin S. Fenofibrate, a Peroxisome Proliferator-Activated Receptor-Alpha Agonist, Exerts Anticonvulsive Properties. Epilepsia. 2009;50:943–8. doi: 10.1111/j.1528-1167.2008.01901.x. [DOI] [PubMed] [Google Scholar]
- 44.Presson AP, Sobel EM, Papp JC, Suarez CJ, Whistler T, Rajeevan MS, Vernon SD, Horvath S. Integrated Weighted Gene Co-Expression Network Analysis with an Application to Chronic Fatigue Syndrome. BMC Syst Biol. 2008;2:95. doi: 10.1186/1752-0509-2-95. [DOI] [PMC free article] [PubMed] [Google Scholar]
- 45.Puligheddu M, Pillolla G, Melis M, Lecca S, Marrosu F, De Montis MG, Scheggi S, Carta G, Murru E, Aroni S, Muntoni AL, Pistis M. Ppar-Alpha Agonists as Novel Antiepileptic Drugs: Preclinical Findings. PLoS One. 2013;8:e64541. doi: 10.1371/journal.pone.0064541. [DOI] [PMC free article] [PubMed] [Google Scholar]
- 46.Reagan-Shaw S, Nihal M, Ahmad N. Dose Translation from Animal to Human Studies Revisited. FASEB J. 2008;22:659–61. doi: 10.1096/fj.07-9574LSF. [DOI] [PubMed] [Google Scholar]
- 47.Rogue A, Lambert C, Josse R, Antherieu S, Spire C, Claude N, Guillouzo A. Comparative Gene Expression Profiles Induced by Ppargamma and Pparalpha/Gamma Agonists in Human Hepatocytes. PLoS One. 2011;6:e18816. doi: 10.1371/journal.pone.0018816. [DOI] [PMC free article] [PubMed] [Google Scholar]
- 48.Rosen EY, Wexler EM, Versano R, Coppola G, Gao F, Winden KD, Oldham MC, Martens LH, Zhou P, Farese RV, Jr, Geschwind DH. Functional Genomic Analyses Identify Pathways Dysregulated by Progranulin Deficiency, Implicating Wnt Signaling. Neuron. 2011;71:1030–42. doi: 10.1016/j.neuron.2011.07.021. [DOI] [PMC free article] [PubMed] [Google Scholar]
- 49.Rosenson RS, Wright RS, Farkouh M, Plutzky J. Modulating Peroxisome Proliferator-Activated Receptors for Therapeutic Benefit? Biology, Clinical Experience, and Future Prospects. Am Heart J. 2012;164:672–80. doi: 10.1016/j.ahj.2012.06.023. [DOI] [PMC free article] [PubMed] [Google Scholar]
- 50.Ryan KK, Grayson BE, Jones KR, Schneider AL, Woods SC, Seeley RJ, Herman JP, Ulrich-Lai YM. Physiological Responses to Acute Psychological Stress Are Reduced by the Ppargamma Agonist Rosiglitazone. Endocrinology. 2012;153:1279–87. doi: 10.1210/en.2011-1689. [DOI] [PMC free article] [PubMed] [Google Scholar]
- 51.Sadaghiani MS, Javadi-Paydar M, Gharedaghi MH, Fard YY, Dehpour AR. Antidepressant-Like Effect of Pioglitazone in the Forced Swimming Test in Mice: The Role of Ppar-Gamma Receptor and Nitric Oxide Pathway. Behav Brain Res. 2011;224:336–43. doi: 10.1016/j.bbr.2011.06.011. [DOI] [PubMed] [Google Scholar]
- 52.Salehi-Sadaghiani M, Javadi-Paydar M, Gharedaghi MH, Zandieh A, Heydarpour P, Yousefzadeh-Fard Y, Dehpour AR. Nmda Receptor Involvement in Antidepressant-Like Effect of Pioglitazone in the Forced Swimming Test in Mice. Psychopharmacology (Berl) 2012;223:345–55. doi: 10.1007/s00213-012-2722-0. [DOI] [PubMed] [Google Scholar]
- 53.Saris CG, Horvath S, van Vught PW, van Es MA, Blauw HM, Fuller TF, Langfelder P, DeYoung J, Wokke JH, Veldink JH, van den Berg LH, Ophoff RA. Weighted Gene Co-Expression Network Analysis of the Peripheral Blood from Amyotrophic Lateral Sclerosis Patients. BMC Genomics. 2009;10:405. doi: 10.1186/1471-2164-10-405. [DOI] [PMC free article] [PubMed] [Google Scholar]
- 54.Sarruf DA, Yu F, Nguyen HT, Williams DL, Printz RL, Niswender KD, Schwartz MW. Expression of Peroxisome Proliferator-Activated Receptor-Gamma in Key Neuronal Subsets Regulating Glucose Metabolism and Energy Homeostasis. Endocrinology. 2009;150:707–12. doi: 10.1210/en.2008-0899. [DOI] [PMC free article] [PubMed] [Google Scholar]
- 55.Schlicht I. Enhancement of Voluntary Alcohol Consumption in Rats by Clofibrate Feeding. Alcohol. 1987;4:199–206. doi: 10.1016/0741-8329(87)90043-7. [DOI] [PubMed] [Google Scholar]
- 56.Searcy JL, Phelps JT, Pancani T, Kadish I, Popovic J, Anderson KL, Beckett TL, Murphy MP, Chen KC, Blalock EM, Landfield PW, Porter NM, Thibault O. Long-Term Pioglitazone Treatment Improves Learning and Attenuates Pathological Markers in a Mouse Model of Alzheimer’s Disease. J Alzheimers Dis. 2012;30:943–61. doi: 10.3233/JAD-2012-111661. [DOI] [PMC free article] [PubMed] [Google Scholar]
- 57.Smyth GK. Linear Models and Empirical Bayes Methods for Assessing Differential Expression in Microarray Experiments. Stat Appl Genet Mol Biol. 2004;3:Article3. doi: 10.2202/1544-6115.1027. [DOI] [PubMed] [Google Scholar]
- 58.Stopponi S, de Guglielmo G, Somaini L, Cippitelli A, Cannella N, Kallupi M, Ubaldi M, Heilig M, Demopulos G, Gaitanaris G, Ciccocioppo R. Activation of Ppargamma by Pioglitazone Potentiates the Effects of Naltrexone on Alcohol Drinking and Relapse in Msp Rats. Alcohol Clin Exp Res. 2013;37:1351–60. doi: 10.1111/acer.12091. [DOI] [PubMed] [Google Scholar]
- 59.Stopponi S, Somaini L, Cippitelli A, Cannella N, Braconi S, Kallupi M, Ruggeri B, Heilig M, Demopulos G, Gaitanaris G, Massi M, Ciccocioppo R. Activation of Nuclear Ppargamma Receptors by the Antidiabetic Agent Pioglitazone Suppresses Alcohol Drinking and Relapse to Alcohol Seeking. Biol Psychiatry. 2011;69:642–9. doi: 10.1016/j.biopsych.2010.12.010. [DOI] [PubMed] [Google Scholar]
- 60.Sugino K, Hempel CM, Miller MN, Hattox AM, Shapiro P, Wu C, Huang ZJ, Nelson SB. Molecular Taxonomy of Major Neuronal Classes in the Adult Mouse Forebrain. Nat Neurosci. 2006;9:99–107. doi: 10.1038/nn1618. [DOI] [PubMed] [Google Scholar]
- 61.Sun Y, Bennett A. Cannabinoids: A New Group of Agonists of Ppars. PPAR Res. 2007;2007:23513. doi: 10.1155/2007/23513. [DOI] [PMC free article] [PubMed] [Google Scholar]
- 62.Tabakoff B, Hoffman PL. The Neurobiology of Alcohol Consumption and Alcoholism: An Integrative History. Pharmacol Biochem Behav. 2013;113:20–37. doi: 10.1016/j.pbb.2013.10.009. [DOI] [PMC free article] [PubMed] [Google Scholar]
- 63.Takahara Y, Takahashi M, Wagatsuma H, Yokoya F, Zhang QW, Yamaguchi M, Aburatani H, Kawada N. Gene Expression Profiles of Hepatic Cell-Type Specific Marker Genes in Progression of Liver Fibrosis. World J Gastroenterol. 2006;12:6473–99. doi: 10.3748/wjg.v12.i40.6473. [DOI] [PMC free article] [PubMed] [Google Scholar]
- 64.Torkamani A, Dean B, Schork NJ, Thomas EA. Coexpression Network Analysis of Neural Tissue Reveals Perturbations in Developmental Processes in Schizophrenia. Genome Res. 2010;20:403–12. doi: 10.1101/gr.101956.109. [DOI] [PMC free article] [PubMed] [Google Scholar]
- 65.Willson TM, Brown PJ, Sternbach DD, Henke BR. The Ppars: From Orphan Receptors to Drug Discovery. J Med Chem. 2000;43:527–50. doi: 10.1021/jm990554g. [DOI] [PubMed] [Google Scholar]
- 66.Winden KD, Karsten SL, Bragin A, Kudo LC, Gehman L, Ruidera J, Geschwind DH, Engel J., Jr A Systems Level, Functional Genomics Analysis of Chronic Epilepsy. PLoS One. 2011;6:e20763. doi: 10.1371/journal.pone.0020763. [DOI] [PMC free article] [PubMed] [Google Scholar]
- 67.Winden KD, Oldham MC, Mirnics K, Ebert PJ, Swan CH, Levitt P, Rubenstein JL, Horvath S, Geschwind DH. The Organization of the Transcriptional Network in Specific Neuronal Classes. Mol Syst Biol. 2009;5:291. doi: 10.1038/msb.2009.46. [DOI] [PMC free article] [PubMed] [Google Scholar]
Associated Data
This section collects any data citations, data availability statements, or supplementary materials included in this article.
Supplementary Materials
(A) PCA was performed on the expression values of all samples. There are three distinct clusters of expression values that correspond to the three tissues used in the analyses along the first two principle components. (B) HCL of the expression data separates samples into two main groups: brain and liver. The brain samples are further subdivided into amygdala and PFC samples. (C) HCL of the expression data from liver separates samples into two main groups that correspond to treatment effectiveness. The only exceptions are the samples liver_saline- 4, which is grouped with the tesa and feno liver samples, and liver_tesa- 6, which is grouped with the saline and beza liver samples.
Figure S2: Differentially expressed genes and detailed enrichment analysis of the genes regulated by tesaglitazar, fenofibrate and bezafibrate in the liver.
(A) The number of genes up- and down-regulated by fenofibrate (feno), tesaglitazar (tesa) and bezafibrate (beza) in the liver. Numbers above and below the bars represent the number of up- and down-regulated genes, respectively. We used lists from previously published data containing genes regulated by PPAR agonists and genes preferentially expressed in hepatocytes, Kupffer cells and hepatic stellate cells to examine cell-type specificity of PPAR agonists. The boxes contain the overrepresented category (hypergeometric p-value < 0.05) in the genes corresponding to the adjacent bar. (B) The distinct and overlapping genes that are regulated by feno, tesa and beza treatment (p-value < 0.05). The boxes contain the overrepresented functional pathways and gene ontologies of the regulated genes in its corresponding gene set (hypergeometric p-value < 0.05). The number in parentheses beside the name of the pathway or ontology represents the number of genes in that category. (C) The network is displayed as a dendrogram where each leaf is a gene and the branches represent genes that are clustered together based on similar expression patterns across all samples. Branches were cut (i.e., modules were defined) using dynamic TreeCut function in R based on a cut height of 0.995. Similarity indicates interconnectedness, with genes closer to 1 being the most connected. Modules are indicated by the arbitrary color bars. Treatment-responsiveness is indicated based on which letter is next to the module (T is tesaglitazar, F is fenofibrate and B is bezafibrate). Cell-type specific enrichment analysis was performed on treatment-responsive modules (H=hepatocyte; K=Kupffer cell). Enrichment analysis was also performed to determine if known PPAR targets were enriched, and this result is also displayed under the cell-type column.
Figure S3: Common and unique gene targets regulated by PPAR agonists in the amygdala, PFC and liver.
The Venn diagrams show the distinct and overlapping genes that are regulated in the amygdala, PFC and liver by (A) fenofibrate (feno), (B) tesaglitazar (tesa) and (C) bezafibrate (beza) treatment at a p-value < 0.05. The boxes contain the overrepresented functional pathways and/or gene ontologies of the regulated genes in the corresponding gene set (hypergeometric p-value < 0.05). The number in parentheses beside the name of the pathway or ontology represents the number of genes in that category.