

Abstract
The objectives of this study were to investigate the seasonal changes in pituitary gonadotropins, growth hormone (GH), and estrogen receptor (ER) isoform mRNA in wild female and male largemouth bass (LMB) (Micropterus salmoides) from an unpolluted habitat to better understand reproductive physiology in this ecologically important species. Female pituitary luteinizing hormone (LH) β subunit and follicle-stimulating hormone (FSH) β subunit mRNA showed significant seasonal variation with levels peaking from January to April and were lowest from May through August. Male LMB showed more variation in gonadotropin subunit expression from month to month. Females had approximately 2–3 times higher gonadotropin mRNA levels in the pituitary when compared to males. All three gonadotropin mRNAs in females were positively correlated to gonadosomatic index (GSI), but only LHβ mRNA was correlated to GSI in males. Gonadotropin mRNA expression also increased with increasing oocyte and sperm maturation. Gonadotropin β subunit mRNA expression was positively correlated to GH mRNA in both sexes. The expression of all three ER isoforms was significantly correlated to each other in both sexes. The concurrent increase in all three ER mRNA isoforms with increasing gonadotropin mRNA in females and males suggests a prominent role for E2 feedback on pituitary gonadotropin synthesis in both sexes and that each of the three ER isoforms are likely to play a role in the pituitary during teleost reproduction.
Keywords: estrogen receptors, gonad stage, wild population, gene expression, reproduction
Introduction
Gonadal growth, gamete maturation, and steroidogenesis in vertebrates are predominantly under the control of luteinizing hormone (LH; teleost GHT-II) and follicle stimulating hormone (FSH; teleost GTH-I). LH and FSH are both glycoproteins that share a common gonadotropin hormone alpha subunit (GTHα) and are composed of a beta subunit specific to each gonadotropin that provides specificity of the hormone. The functions of LH and FSH in fish have been found to be vitellogenesis/spermatogenesis and maturation, respectively (Jalabert, 2005). However, in teleost fish unlike in mammals, LH and FSH are more promiscuous and are capable of binding to the other gonadotropin receptor (Bogerd et al., 2005).
Gonadotropins have been sequenced and characterized in a number of teleost fish representing anguilliformes, salmoniforms, perciforms, cypriniformes, and siluriformes in addition to other species (summarized in Mateos et al., 2003). The expression profiles of gonadotropin mRNA in the pituitary throughout the reproductive season have previously been described for many species including black porgy (Acanthopagrus schlegeli) (Du et al., 2005), European sea bass (Dicentrarchus labrax L.) (Moles et al. 2007), channel catfish (Ictalurus punctatus) (Kumar and Trant, 2004), rainbow trout (Oncorhynchus mykiss) (Santos et al., 2001), and red seabream (Pagrus major) (Gen et al. 2000). Although the majority of studies report that gonadotropin mRNA synthesis increases throughout oocyte and sperm maturation, reaching a peak prior to ovulation and spermiation, there are significant temporal differences in gonadotropin expression across species. For example, in the channel catfish, a synchronous seasonal spawner, FSHβ mRNA in the female pituitary shows two distinct peaks. The first peak occurs during September-October and the second peak occurs in January-February (Kumar and Trant, 2004). Female channel catfish LHβ mRNA peaks later in the reproductive cycle in May and June. In female three-spine stickleback (Gasterosteus aculeatus), a multiple spawner, FSHβ mRNA expression significantly increases in January, and gradually decreases as LHβ mRNA increases in the pituitary just before the breeding season in April-June (Hellqvist et al., 2006). Therefore, there are marked temporal differences in teleost fishes in the expression of pituitary gonadotropins.
Although the gonadotropins are considered the primary regulators of gonad development and steroid production, other pituitary hormones such as growth hormone (GH), have a prominent role in teleost reproduction (reviewed in Canosa et al., 2007). The crosstalk between the gonadotropic and somatotropic axes in fish is complex and interactions between the two axes are largely dependent upon whether the individual is sexually immature or mature (Gomez et al., 1999). The modulation of the gonadotropic and somatotropic axes is regulated in part by estrogen (E2) feedback as the mRNA transcription of both gonadotropins (Huggard-Nelson et al., 2002; Mateos et al., 2002; Banerjee and Khan, 2008) and GH (Trudeau et al., 1992; Zou et al., 1997) in the teleost pituitary is responsive to E2. Thus, there are multiple hormonal systems mediating gonad development and maturation which are sensitive to sex steroid feedback, providing tight regulation and fine control of the reproductive axis.
Largemouth bass (Micropterus salmoides) (LMB) are an important recreational and commercial species in the continental United States and are top predators in the ecosystem. The reproductive cycle in LMB is relatively synchronous, and spawning begins when temperatures increase to about 62 °F or slightly higher (Clugston 1966). Spawning can occur as early as December for LMB in south Florida and as late as June in the northern part of the state, but spawning peaks during February-April for many populations in central Florida (Clugston 1966; Chew 1974; Rogers et. al. 2006; Rogers and Allen, 2009). Currently, there are no data on pituitary gonadotropin synthesis in wild populations of this important economic and ecological species.
Given the importance of E2 feedback on pituitary gonadotropin and GH mRNA expression, this study examined the seasonal expression profiles of gonadotropin subunits (LHβ, FSHβ, and GTHα) and GH mRNA in relation to ER isoform mRNA expression in the pituitary of both female and male LMB from a wild population in the St. John’s River in the vicinity of Welaka, FL USA. Previous studies in LMB liver and gonad have demonstrated marked differences in ER isoform regulation and abundance in the liver and ovary of female fish throughout different LMB reproductive stages (Sabo-Attwood et al., 2004). In the current study, the hypotheses being tested were 1) ER isoform mRNA expression shows seasonal variation in the pituitary and correlates to gonadotropin and GH mRNA expression and 2) pituitary transcripts positively correlate with changes in gonad phases of development in both female and male LMB.
Materials and methods
2.1 Animal collection and sampling
Adult female and male LMB were collected by electroshocking from October 2005 to September 2006 from the St. John’s River in Welaka, FL USA. Welaka is located approximately 20 miles south of Palatka, FL in an area of the river that is considered to be relatively free from the influence of industrial effluent and agricultural runoff (Sepulveda et al., 2002). The period between sampling events ranged from 4–5 weeks and amounted to one sampling event per month.
Approximately 10 males and 10 females were collected during each sampling period. At the time of capture, approximately 3–5 ml of blood was drawn from the caudal vein using a heparinized vacutainer and stored on ice for later studies. Body weight (g), body total length (tip of the mouth to tip of the tail; mm), and gonad weight (0.01 g) were recorded. Gonadosomatic index (GSI) was later calculated for all individuals in this study as [gonad weight/absolute body weight] × 100. Fish were euthanized with a blow to the head and the pituitary, along with other tissues (brain, liver, gonad, and kidney) was rapidly dissected. All tissue was frozen in liquid nitrogen as soon as possible and stored at −80°C until processed.
A gonad sample was also collected for histological examination shortly after the fish was euthanized. The gonad was placed in a buffered formalin 1:20 dilution (Protocol®, Fisher Scientific, MI, USA), and quickly chilled on ice, to determine reproductive stage of the animal. Gonads were plastic embedded and cut to 4 micron sections. Staining of the gonad sample was done with standard hematoxylin (basophilic dye) and eosin (acidophilic dye) staining protocols. Vitellogenic oocytes are acidic and stain more red with eosin. Ovarian tissue throughout the year was categorized into six predominant stages; Primary growth perinuclear (PG pn), primary growth cortical alveoli (PG ca), secondary growth early (Sg early), secondary growth late (Sg late), oocyte maturation (OM), and atresia (AT) (Grier, manuscript in preparation). The primary growth phase has also been called endogenous growth associated with preparation for vitellogenin uptake. Secondary growth or exogenous growth is due to the accumulation of plasma vitellogenin. Testes were categorized into four general stages; IM- Immature or non-reproductive; EM- early sperm maturation; MM- mid sperm maturation (<50% of tissue = mature sperm); LM- late sperm maturation (>50% of tissue = mature sperm). Each gonad stage is illustrated by representative micrographs of histological sections in Figure 1 (females) and Figure 2 (males). In additional to describing monthly changes in pituitary transcript levels, gonad stage was also used to evaluate mRNA changes in relation to sexual maturation.
Figure 1.
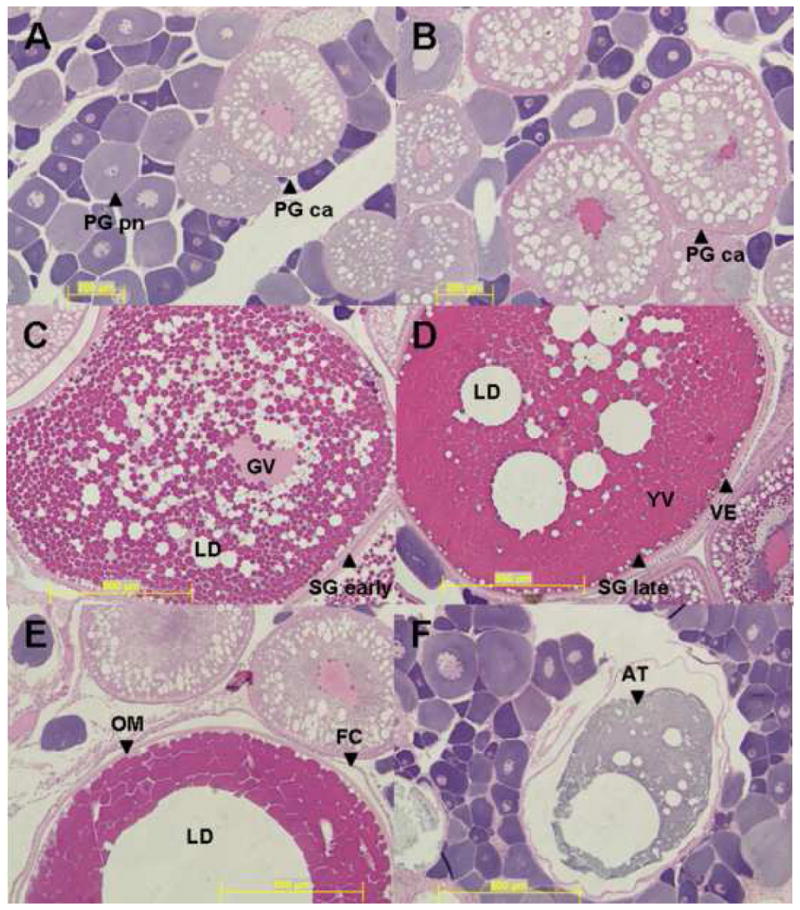
Representative micrographs of female largemouth bass ovarian stages. Female stages are as follows; A) Primary growth perinuclear (PG pn); B) primary growth cortical alveoli (PG ca); C) Secondary growth early (Sg early); D) Secondary growth late (Sg late); E) Oocyte maturation (OM); and F) Atresia (AT). Additional abbreviations are as follows: Follicle Cells (FC), Germinal Vesicle (GV), Lipid Droplet (LD), Vitelline Envelope (VE), and Yolk Vesicles (YV). Scale bars correspond to 200 μm (A–B) and 500 μm (C–F).
Figure 2.
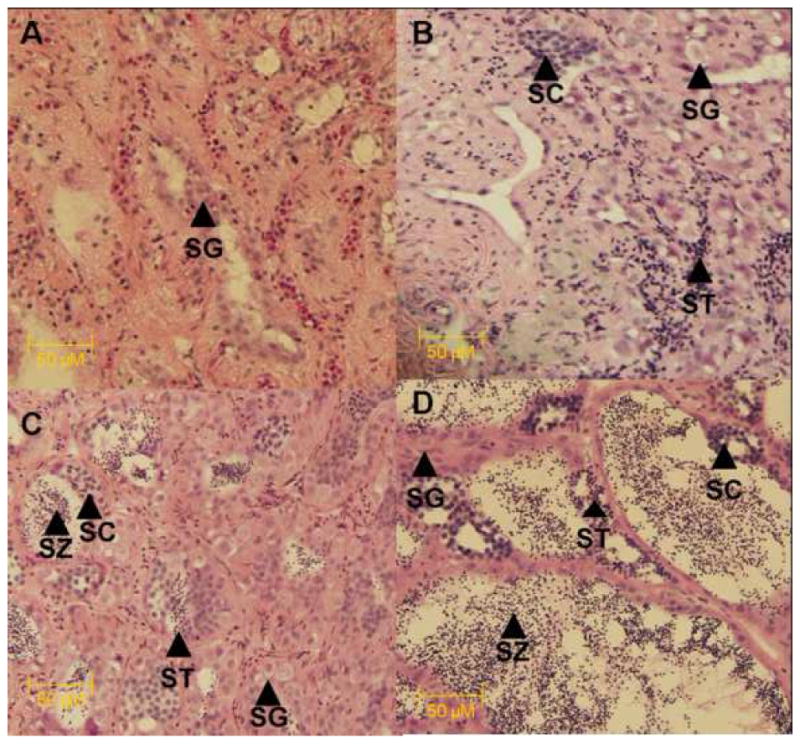
Representative micrographs of male largemouth bass testicular stages. Male stages were classified based on the predominant stage and are as follows; A) IM- Immature or non-reproductive; B) EM- early sperm maturation; C) MM- mid sperm maturation (<50% of tissue = mature sperm); D) LM- late sperm maturation. Abbreviations are as follows; spermatocytes (SC), spermatogonia (SG), spermatids (SD), spermatozoa (SZ). Scale bars correspond to 50 μm (A–D).
It should be noted that it was not possible to recover a pituitary sample from each individual. Pituitary samples collected for each sex ranged from 3–10/sampling and up to 8/month were used in this study. Sample sizes for female pituitaries collected per month were as follows; January (n=4), February (n=6), March (n=5), April (n=7), May (n=3), June (n=4), July (n=2), August (n=4), September (n=3), October (n=8), November (n=4), and December (n=5). Total female pituitaries used for seasonal data was n=55. Sample sizes for female pituitaries according to gonad stage were as follows; PG pn (n=8), PG ca (n=8), SG early (n=5), SG late (n=9), OM (n=5), and AT (n=2). Number of females used in the stage specific analysis was n=37. Sample sizes for male pituitaries collected per month were as follows; January (n=5), February (n=4), March (n=3), April (n=5), May (n=4), June (n=2), July (n=1), August (n=3), September (n=2), October (n=2), November (n=4), and December (n=6). Total male pituitaries used for seasonal data was n=41. Sample sizes for male pituitaries according to gonad stage were as follows; IM (n=5), EM (n=4), MM (n=22), LM (n=6). Number of males that were used in the stage specific analysis was n=37.
2.2 Cloning of LMB LHβ, FSHβ, and GTHα subunits
LMB pituitaries were homogenized on ice and total RNA was extracted using STAT 60™ (Teltest, Friendswood, TX, USA). RNA was resuspended in 25 μl RNAsecure™ Reagent (Ambion, Austin, TX, USA). Total RNA was quantified using an Eppendorf ® Biophotometer. First-strand cDNA synthesis was performed with 3 μg of total RNA in a reaction tube containing 1 μl random hexamers (250 ng/μl) and 1 μl 10 mM dNTPs (Invitrogen Life Technologies, Carlsbad, CA, USA) in a final volume of 10 μl DEPC treated water. The reaction components were heated to 70 °C for 10 minutes and quickly chilled on ice. After a brief centrifugation, 4 μl 5X reaction buffer, 2 μl 0.1M DTT, and 1 μl RNAse inhibitor (40 U/μl) (Invitrogen) were added, gently mixed, and heated at 42 °C for 2 minutes. 1 μl Superscript™ II (200 U/μl) (Invitrogen) was added and the reaction was allowed to continue at 42 °C for 1 hour. The reaction was inactivated at 70 °C for 15 minutes and stored at −20 °C.
Nucleic acid sequence information for teleost gonadotropins was obtained from the National Center for Biotechnology Information (NCBI) and aligned using ClustalW (EMBL-EBI; http://www.ebi.ac.uk/clustalw/). Primer3 (Rozen and Skaletsky, 2000) was used to design gene specific primers for both cloning partial sequences and designing real-time PCR primers. Primer sets used in this study are provided in Table 1. Note that all primers are reported in the 5′ to 3′ direction. Partial sequences for LMB gonadotropins were first cloned for this study and additional information about the gonadotropin subunits is described in the results section. LMB gene sequences for GH (DQ666528), ERα (AF253062), ERβb (AY211021), and ERβa (AY211022) have been cloned previously and are available from the NCBI database.
Table 1.
List of primers used in the study of the seasonal relationships of gonadotropin, growth hormone, and estrogen receptor mRNA expression in the pituitary of wild largemouth bass. Note that primer sets are given in 5′ to 3′ direction. The real time PCR (qPCR) ER primers have previously been shown to be specific to each ER subtype (Sabo-Attwood et al., 2004).
| Forward 5′-3′ | Reverse 5′ to 3′ | base pairs | |
|---|---|---|---|
| LHβ | CCA GAG AGG ATG ATG GCT GT | AAC CGT CAC CTA CCC CG | 349 |
| FSHβ | ACC CAG CAG AGG ATG CAG | CCT ACC CTG TGG CCA GAA | 292 |
| GTHα | CCA GCA TGG ACT TAT CAA ACA | GTA GCA ATT CTG TGT CTG TGA TGT | 434 |
| GH | GTC TGT TCT CCA TCG CTG TC | GAC GAA CCT ACG AAC TGC TG | 452 |
| qPCR | |||
| LHβ | TGC CAG CTC ATC AAC CAG | TGT CTT CCT GGC GTG GAC | 207 |
| FSHβ | CAT CTC ACC AAC ATC AGC ATC | ACG ACT GGG CTG AAC AGA A | 131 |
| GTH-α | CGA TCC CAA AGA ACA TCA CC | GGA AAG TGG AAA GTG GAG ACC | 160 |
| GH | GAG CAG CGT CAA CTC AAC AA | TTC TCT GTC TGG AGG TTC TGC | 176 |
| ERα | CGA CGT GCT GGA ACC AAT GAC AGA G | AGG AGG AAA ATC ATC AGT GAC CGG AGG T | 71 |
| ERβb | CCG ACA CCG CCG TGG TGG ACT C | TTG AGG CTC CCC TTG CCC CGC T | 96 |
| ERβa | GTG ACC CGT CTG TCC ACA | TCT CCT GCA CTG ACC CCA GA | 84 |
PCR amplification for cloning was done using 100 ng cDNA template in 36.3 μl PCR water, 5 μl 10X PCR reaction buffer, 1.5 μl 50 mM MgCl2, 1 μl 10 mM dNTPs, 2 μl 10 mM forward and reverse primers, and 0.2 μl Taq DNA polymerase (1 U/ μl) (Invitrogen). Initial denaturation occurred at 95 °C for 4 minutes followed by 35 cycles at 95 °C for 30 seconds, 56 °C for 30 seconds, and 72 °C for 1 minute. Amplification products were visualized on an ethidium bromide 1% agarose gel, ligated directly into pGEM-®T easy vector (Promega, Madison, WI, USA) and transformed into One Shot TOP 10® chemically competent E. coli (Invitrogen). Wizard® Plus SV Minipreps DNA Purification System (Promega, Madison, WI, USA) was used to isolate plasmids containing insert, and sequencing was done in the Interdisciplinary Center for Biotechnology Research (ICBR; University of Florida, USA).
2.3 Real-Time PCR
Total RNA was DNase treated using the RNeasy® Micro Kit (Qiagen) and first strand cDNA synthesis was performed using 2 μg of RNA as described above. Primers used to amplify the LMB ER isoforms have been previously described in Sabo-Attwood et al. (2004), and these primer sets have been determined to be specific to each isoform. Primer3 was used to design primers for real-time PCR assays for LHβ, FSHβ, GTHα, and GH. Primers of 18–22 base pairs (bp) with optimal annealing temperature ~60 °C were designed to amplify sequences between 130–210 bp (Table 1). Primers for real-time PCR were initially tested using LMB pituitary cDNA and the amplicons were sequenced as described above to verify specificity. Standard curves relating initial template copy number to fluorescence and amplification cycle were generated using pGEM-®T easy vector containing the gene of interest as a template. The equation used was as follows; number of copies = (X * 6.022 × 10²³) / (Y * 1×109 * 650), where X is the template amount (ng of vector + insert), Y is the template length (bp vector + insert), and 650 (kDa) is the average weight of a base pair. Standard curves ranged from 1 × 10⁹ to 1 × 10² copy number. Standard curves ranged between 95–105% efficiency and were linear at R2 > 0.995. Two controls that did nto receive reverse transcriptase from separate cDNA sample pools and four no cDNA template controls (water) were run on every plate to ensure genomic DNA contamination was negligible after DNAse treatment. Melt curves were also performed for all genes in all runs and verified for a single product/dissociation curve.
Real-time PCR analysis of gene expression was carried using 1X iQ SYBR Green Supermix (Bio-Rad, Hercules, CA) and 1 μl 10 mM dNTPs, and 100 ng first-strand cDNA derived from DNase treated RNA samples. The two step thermal cycling parameters were as follows; initial 1 cycle Taq polymerase activation at 95°C for 3 minutes, followed by 40 cycles of 95°C for 15 seconds and 60°C for 1 minute. After 40 cycles, a dissociation curve was produced starting at 55°C (+1°C/30 seconds) to 95°C. Real-time PCR expression was assayed on an iClycler Thermal Cycler (Bio-Rad). All expression data is normalized to 18 rRNA (IQ Supermix, Bio-Rad) as per Blum et al. (2008).
2.4 Statistical analysis
The data were analyzed by one-way analysis of variance (ANOVA) followed by a Tukey’s HSD post hoc pairwise multiple comparison on log transformed expression data (JMP v7, SAS, Cary, NC, USA) in order to determine if there were statistical differences between time and gonad stage. The same test was also done to evaluate sex differences in expression across time. Both female and male expression data in June and July (JJ) were combined in the analysis because of smaller sample numbers compared to other months. This was also the case for September and October (SO) males. All results are plotted as mean copy number ± SEM of untransformed data (n=3–8/month/sex). LMB were grouped according to gonad stage and results are plotted as mean copy number ± SEM. Body weight, body total length, absolute gonad weight, GSI, and expression data for each transcript throughout the year was determined to be normally distributed (KS test for normality) and multivariate pairwise correlations were performed for all variables. All differences were considered statistically significant when P < 0.05.
Results
3.1 Gonadosomatic index (GSI)
Both female (d.f.=1; F=20.3, p<0.0001) and male (d.f.=1; F=30.8, p<0.0001) LMB GSI significantly varied with water temperature changes in the St. John’s River, Welaka (Figure 3). Peak female GSI (approximately 3.5–4.0% ± 0.4%) occurred in February and March when the water temperature was between 60–70 °F, while peak male GSI (approximately 0.44 % ± 0.04%) occurred in February. As expected, both females and males had small gonads in the summer months (July-September) when water temperature was at its highest (85–88 °F). The range of GSIs for females across the year was 0.04–4.5% and for males it was 0.01–0.53%. These data included only LMB for which a pituitary was used in this study.
Figure 3.

Gonadosomatic index (bars) throughout the year of female and male largemouth bass in the St John’s River near Welaka, FL. Statistical differences in GSI across months are indicated by different letters as determined by ANOVA followed by a Tukey’s HSD post hoc test. P < 0.05 was considered significantly different. Average water temperature (line graph) in the St Johns River over a 1-year period (October, 2005-September 2006) is shown.
3.2 Cloning of LMB LHβ, FSHβ, and GTHα subunits
The partial LMB LHβ sequence(FJ030931; 349 bp) shows 92% nucleotide (nt) identity and the predicted amino acid (aa) sequence shows 90% identity with European sea bass (Dicentrarchus labrax; nt, AF543315; aa, AAN40507) based on information in the NCBI database. The partial LMB FSHβ sequence (FJ030932; 292 bp) shows 91% nt identity and the predicted amino acid sequence shows 78% identity with European sea bass (nt, AF543314; aa, AAN40506). The partial LMB GTHα sequence (FJ030933; 160 bp) shows 90% nt identity and the predicted amino acid sequence shows 97% identity with European sea bass (nt, AF269157; aa, AAK49431).
3.3 Gonadotropin, GH and ER isoform mRNA expression throughout the year in females and males
For all transcript analysis by month, both June/July and September/October were grouped together for both sexes because of the low sample size for these months in males. Females LHβ mRNA levels showed significant changes throughout the year (d.f.=9; F=4.04; p<0.001) (Figure 4A). This was also the case for FSHβ mRNA levels (d.f.=9; F=4.45; p<0.001) (Figure 4B). When considering the entire year, GTHα showed less variation in relative mRNA abundance in the pituitary and expression changes from month to month were moderate and less pronounced (d.f.=9; F=1.8; p=0.075) (Figure 4C). Male gonadotropin mRNA expression in the pituitary did not significantly change over the season and showed high variation when month was considered (Figure 4A–C). When comparing the sexes, there was a trend for females to have 2–3-fold higher LHβ and FSHβ mRNA levels in the pituitary than males whereas GTHα appeared to have similar levels of expression in each sex. Due to the large number of comparisons and small sample numbers of pituitaries analyzed in some months, few significant differences were detected across each month with a multiple comparison post hoc correction.
Figure 4.

Gonadotropin mRNA expression in female and male largemouth bass pituitary as determined by real-time PCR. Each bar represents the mean copy number of the gene ± S.E.M. of untransformed data followed by ANOVA with a Tukey’s post hoc test (n=3–8/month/sex). Each calculated gene copy number is divided by 18s copy number and is a relative copy number on the y-axis. Graphs are as follows: A) Luteinizing hormone (LH)β mRNA female and male; B) Follicle stimulating hormone (FSH) β mRNA female and male; and C) gonadotropin hormone (GTH) α mRNA female and male. Both female and male expression data in June and July (JJ) were combined in the analysis as was the case for September and October (SO) males. Sample sizes for female pituitaries collected per month were as follows; January (n=4), February (n=6), March (n=5), April (n=7), May (n=3), June (n=4), July (n=2), August (n=4), September (n=3), October (n=8), November (n=4), and December (n=5). Total female pituitaries used for seasonal data was n=55. Sample sizes for male pituitaries collected per month were as follows; January (n=5), February (n=4), March (n=3), April (n=5), May (n=4), June (n=2), July (n=1), August (n=3), September (n=2), October (n=2), November (n=4), and December (n=6). Total male pituitaries used for seasonal data was n=41. Different letters indicate statistical differences among groups (p<0.05).
GH mRNA also varied significantly over the year in females (d.f. =9; F=3.48; p<0.01) (Figure 5) and followed closely gonadotropin expression in the pituitary. GH mRNA was approximately 5-fold higher (January-April) during secondary growth and maturation in females than primary growth stages and abruptly decreased 10-fold in the summer (May-August). Male GH mRNA expression in the pituitary did not significantly change over the season and showed high variation when month was considered (Figure 5). Relative GH mRNA did not statistically differ between the sexes when all months were considered in the analysis. However, GH mRNA levels were approximately 5–10-fold higher in pituitaries of females compared to males during gonadal maturation and pre-spawning (January-April).
Figure 5.
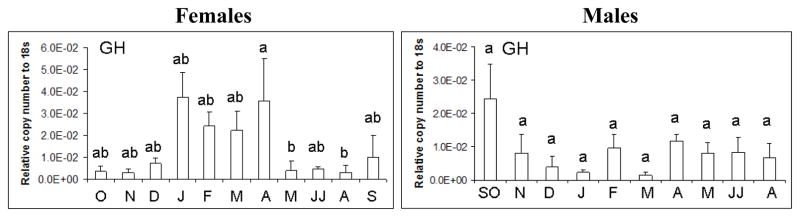
GH mRNA expression in female and male largemouth bass pituitary as determined by real-time PCR. Each bar represents the mean copy number of the gene ± S.E.M of untransformed data followed by ANOVA with a Tukey’s post hoc test (n=3–8/month/sex). Each calculated gene copy number is divided by 18s copy number and is a relative copy number on the y-axis. Both female and male expression data in June and July (JJ) were combined in the analysis as was the case for September and October males (SO). Different letters indicate statistical differences among groups (p<0.05).
In females, ERα (d.f. =9; F=4.67; p<0.001) and ERβb mRNA (d.f. =9; F=2.83; p<0.01) showed significant seasonal variation (Figure 6A,B), but the expression levels of ERβa mRNA were not significantly different across months (Figure 6C). In males, ERα mRNA varied seasonally (d.f.=9; F=2.46; p=0.02), but ERβb and ERβa mRNA did not differ across all months. There were no significant sex differences in the expression of ER isoforms in LMB pituitary.
Figure 6.

ER isoform mRNA expression in female and male largemouth bass pituitary as determined by real-time PCR. Each bar represents the mean copy number of the gene ± S.E.M. of untransformed data followed by ANOVA with a Tukey’s post hoc test (n=3–8/month/sex). Each calculated gene copy number is divided by 18s copy number and is a relative copy number on the y-axis. Both female and male expression data in June and July (JJ) were combined in the analysis as was the case for September and October (SO) males. Different letters indicate statistical differences among groups (p<0.05).
3.4 Relationship between pituitary gene expression and gonad stage
In addition to monthly changes in pituitary gene expression, we also grouped GSI and pituitary expression data according to gonad stage. Female GSI (d.f.=5, F=27.08, p<0.0001) varied significantly with gonad stage (Figure 7A). Transcript levels for female LMB LHβ (d.f.=5, F=2.81, p<0.05), FSHβ (d.f.=5, F=3.34, p<0.05), GH (d.f.=5, F=2.78, p<0.05), and ERα (d.f.=5, F=3.03, p<0.05), significantly varied across gonad stage (Figure 7 B,C,E, and F). In females, the gonadotropin β subunits and GH mRNA increased dramatically in the secondary growth (late) and oocyte maturation phases.
Figure 7.


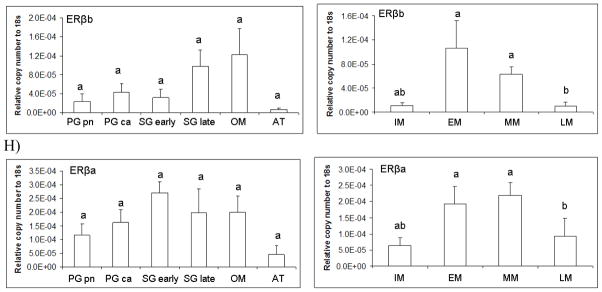
Pituitary transcript abundance in relation to largemouth bass gonad phase. Each bar represents the mean copy number of the gene ± S.E.M. of untransformed data followed by ANOVA with a Tukey’s post hoc test (n=3–15/stage). Each calculated gene copy number is divided by 18s copy number and is a relative copy number on the y-axis. Abbreviations for female phases are as follows; Primary growth perinuclear (PG pn); Primary growth cortical alveoli (PG ca); Secondary growth early (Sg early); Secondary growth late (Sg late); Oocyte maturation (OM); and Atresia (AT). Graphs are A) LHβ mRNA female and male; B) FSHβ mRNA female and male; C) GTHα mRNA female and male; D) GH mRNA female and male; E) ERα mRNA female and male; F) ERβb mRNA female and male; and G) ERβa mRNA female and male. Sample sizes for female pituitaries according to gonad stage were as follows; PG pn (n=8), PG ca (n=8), SG early (n=5), SG late (n=9), OM (n=5), and AT (n=2). Number of females that were staged and used in the stage specific analysis was n=. Sample sizes for male pituitaries according to gonad stage were as follows; IM (n=5), EM (n=4), MM (n=22), and LM (n=6). Number of males that were staged and used in the stage specific analysis was n=37. Different letters indicate statistical differences among groups (p<0.05).
Male GSI (d.f.=3, F=21.37, p<0.0001) varied significantly with gonad stage. All transcript levels in males significantly varied across gonad stage. LMB LHβ (d.f.=3, F=3.71, p<0.05), FSHβ (d.f.=3, F=5.02, p<0.01), GTHα (d.f.=3, F=3.51, p<0.05), GH (d.f.=3, F=4.11, p<0.05), ERα (d.f.=3, F=7.07, p<0.001), ERβb (d.f.=3, F=8.14, p<0.001), and ERβa (d.f.=3, F=5.68, p<0.01) (Figure 7A–G). Males in mid-maturation (approximately 50% or less mature sperm) had the highest mRNA levels of gonadotropin beta subunits.
3.5 Correlations of phenotypic characteristics and pituitary gene expression in LMB
We also investigated the relationship between phenotypic measures and pituitary mRNA expression. Female absolute body weight was significantly correlated to body length and to gonad weight (Table 2). GSI, LHβ mRNA, and FSHβ mRNA expression was significantly correlated to the expression of all pituitary transcripts examined except ERβa mRNA steady state levels in females. GH mRNA levels were correlated to gonadotropin mRNA, but not significantly to ER isoform mRNA in general. All ER isoform mRNA levels were significantly correlated to each other. All correlations between phenotypes and pituitary transcript levels were positive relationships in females.
Table 2.
Pairwise correlations for seasonal transcript levels in the pituitary of female and male bass collected from the St John’s River
| Females | |||||||||||
|---|---|---|---|---|---|---|---|---|---|---|---|
| BW | length | gonad | GSI | LHβ | FSHβ | GTHα | GH | ERα | ERβb | ERβa | |
| BW | 1 | ||||||||||
| Length | ***0.960 | 1 | |||||||||
| Gonad | 0.592*** | 0.552** | 1 | ||||||||
| GSI | 0.294 | 0.272 | 0.913*** | 1 | |||||||
| LHβ | 0.321* | 0.329* | 0.738*** | 0.798*** | 1 | ||||||
| FSHβ | 0.120 | 0.162 | 0.483*** | 0.600*** | 0.886*** | 1 | |||||
| GTHα | 0.144 | 0.162 | 0.295 | 0.370* | 0.564*** | 0.478*** | 1 | ||||
| GH | 0.168 | 0.231 | 0.443*** | 0.458*** | 0.741*** | 0.838*** | 0.391* | 1 | |||
| ERα | 0.200 | 0.193 | 0.568*** | 0.582*** | 0.624*** | 0.398* | 0.188 | 0.312 | 1 | ||
| ERβb | 0.100 | 0.124 | 0.443*** | 0.485*** | 0.600*** | 0.476*** | 0.327* | 0.357* | 0.847*** | 1 | |
| ERβa | 0.188 | 0.155 | 0.270 | 0.219 | 0.239 | 0.036 | 0.221 | 0.048 | 0.625*** | 0.618*** | 1 |
| Males | |||||||||||
|---|---|---|---|---|---|---|---|---|---|---|---|
| BW | length | gonad | GSI | LHβ | FSHβ | GTHα | GH | ERα | ERβb | ERβa | |
| BW | 1 | ||||||||||
| Length | 0.980*** | 1 | |||||||||
| Gonad | 0.205 | 0.086 | 1 | ||||||||
| GSI | −.135 | −0.187 | 0.812*** | 1 | |||||||
| LHβ | −0.044 | −0.051 | 0.274 | 0.355* | 1 | ||||||
| FSHβ | −0.021 | −0.002 | 0.100 | 0.253 | 0.890*** | 1 | |||||
| GTHα | 0.242 | 0.178 | 0.428* | 0.185 | 0.475*** | 0.222 | 1 | ||||
| GH | −0.142 | −0.044 | −0.336* | −0.215 | 0.360* | 0.457** | 0.083 | 1 | |||
| ERα | −0.040 | −0.021 | 0.118 | 0.331* | 0.805*** | 0.836*** | 0.031 | 0.201 | 1 | ||
| ERβb | −0.038 | 0.074 | −0.205 | −0.029 | 0.481** | 0.637*** | 0.009 | 0.751*** | 0.453** | 1 | |
| ERβa | −0.014 | 0.030 | 0.008 | 0.148 | 0.812*** | 0.792*** | 0.350* | 0.664*** | 0.695*** | 0.666*** | 1 |
p<0.05,
p<0.01,
p<0.001
In males, there were few phenotypic measures which correlated to gene expression changes in the pituitary. Male absolute body weight was only correlated to body length whereas absolute gonad weight was correlated to GSI (Table 2). LHβ and FSHβ mRNA expression were highly correlated in male pituitary. Gonadotropin β subunit mRNA was significantly correlated to ER mRNA levels. GTHα mRNA levels were not correlated to any phenotypic parameter, but was strongly correlated to the expression of LHβ subunit mRNA. GH mRNA levels in males were significantly associated with the expression of the ER isoforms. Similar to females, all three ER isoforms also showed significant relationships in mRNA expression levels in the male pituitary. All significant correlations between phenotypes and pituitary transcript levels were also positive relationships in males except for the expression of GH mRNA and absolute gonad weight that showed a negative relationship.
Discussion
4.1 LMB seasonal GSI
We observed comparable changes of female and male LMB GSI throughout the year in the St. John’s River as previously reported by Sepúlveda et al. (2002). In that study, the average GSI (± S.E.M.) in February at spawning for females was reported to be approximately 4.1 ± 0.6 (n=8) whereas for males, the GSI was 0.3 ± 0.02 (n=15). In the present study, both females and males had comparable GSIs in the summer months when water temperatures were highest in the St. John’s River. At higher water temperatures, LMB gonadal tissue regresses and gamete production is reduced. The majority of individuals from the LMB Welaka population were regressed in June, when water temperatures were approximately 85 °F.
4.2 Seasonal pituitary gonadotropin mRNA expression
The expression levels of all three gonadotropins in female LMB pituitary were significantly correlated to each other and were correlated to GSI in females. In males, FSHβ mRNA and GTHα mRNA expression did not show a significant relationship and were not correlated to GSI. This lack of a significant relationship may reflect differential regulation of the α subunit by additional hormonal systems. For example, thyroid stimulating hormone is also synthesized in the pituitary and regulates growth, metabolism, and osmoregulation in fish. Similar to the gonadotropins, this glycoprotein consists of a specific β subunit that also shares the gonadotropin α subunit. There is evidence that thyroid hormone levels in fish also vary over the reproductive cycle (Mylonas et al., 1997; Biswas et al., 2006) and the patterns observed in GTHα mRNA expression across the year in female and male LMB pituitary may also be due to the role of GTHα mRNA in the production of thyroid hormone as opposed to solely reproductive hormones.
In contrast to wild male LMB, Mateos et al. (2003) showed a concomitant increase in each of the three gonadotropins that correlated with GSI in male European sea bass. LHβ, FSHβ, and GTHα mRNA significantly increased during spermatogenesis and reach peak expression in the pituitary at full spermiation. After spermiation, all subunit mRNA levels declined and only GTHα subunit mRNA was detected in male European sea bass. In male LMB, there appeared to be a more gradual decline in gonadotropin mRNA levels through the summer, reaching low levels in August. This gradual decrease may be related to water temperature and other environmental cues such as seasonal changes in photoperiod. During the summer months, the males are in an immature or regressed stage of development. We were able to detect mRNA levels of each gonadotropin subunit in both sexes throughout the year, suggesting that there is active transcription of gonadotropins in the pituitary during each stage of gonad development in LMB, although mRNA steady state abundance is low with sexual immaturity.
Variation in gonadotropin synthesis across teleost species can be considerable. There is also high variation in the reproductive ecology among species of teleosts. Some fish, such as LMB, are nest builders and provide parental care. Many of these fish have low fecundity (spawning only 5,000 to 10,000 eggs per nest), but use tremendous amount of energy in reproduction due to nest preparation and parental care. Other species may be broadcast spawners that produce more than a million eggs while others have compressed or protracted spawning seasons. This variation in reproductive strategies may result in differences in gonadotropin expression and synthesis among teleost species. It would be interesting for future papers to explore how differences in the physiological processes of hormone production differ among species with different reproductive strategies.
LMB have significant variation in the stage of gametes at any one time, and active vitellogenesis and maturation can occur simultaneously within an egg clutch, adding complexity in the regulation and expression of gonadotropins. Therefore, grouping animals based on stage rather than month may be a more accurate measure for studying gene expression patterns and both approaches are recommended.
In wild female LMB, LHβ and FSHβ mRNA were significantly higher during active vitellogenesis or secondary oocyte growth while GTHα mRNA did not change dramatically across gonad stages. In female channel catfish, all three gonadotropins showed a parallel elevation during early oocyte development, but during secondary growth and oocyte maturation, both FSHβ and GTHα mRNA peaked when LHβ mRNA levels were low (Kumar and Trant, 2004). In addition, gonadotropins in female catfish showed a second elevation in pituitary mRNA synthesis during ooctye development. In female sticklebacks, FSHβ mRNA expression significantly increased in January during early secondary oocyte growth when there was active vitellogenesis and decreased as LHβ mRNA increased in the pituitary (Hellqvist et al., 2006). In female rainbow trout, LHβ (GTH IIβ) and GTHα transcription increased moderately throughout most of gametogenesis and then more dramatically during the periovulatory period (Gomez et al., 1999); whereas FSHβ (GTH Iβ) mRNA increased first during early secondary oocyte growth with vitellogenesis and again around ovulation (Gomez et al., 1999).
Male LMB pituitary mRNA changes were not significantly correlated to gonad stage and males of similar stages of maturation had varied levels of pituitary mRNA steady state levels. Sexual maturity in fish is highly dependent upon environmental factors and is influenced by photoperiod and temperature. Compared to laboratory-reared fish, wild LMB are likely to experience higher variation in temperature and photoperiod leading to increased variation in pituitary mRNA synthesis. In addition, wild LMB will show larger variation in size, age, and nutritional state compared to laboratory animals. Despite this, there was a trend for wild, mature males to have higher levels of gonadotropin β subunit mRNA in the spring months versus summer. In maturing male striped bass, FSHβ mRNA increased during pre-spermiation and reached a peak in January, earlier than LHβ and GTHα mRNA levels whereas LHβ and GTHα mRNA increased during spermiation and reached a peak in March (Hassin et al. 2000). In the same study, circulating levels of plasma LH in males was relatively low and did not change throughout spermatogenesis. This follows our observation in LMB that gonadotropin mRNA in males does not change dramatically throughout the year and is less abundant compared to females. Hassin et al. (2000) suggested that low levels of LH are sufficient to promote spermatogenesis in male striped bass in contrast to salmonid species that show marked elevation in plasma LH during spermatogenesis (Prat et al., 1996). In male sticklebacks, FSHβ mRNA levels peaked earlier than LHβ mRNA and interestingly, when spermatogenesis is active, LHβ mRNA levels were relatively low (Hellqvist et al., 2006). With LMB, less variation in mRNA expression may be observed in northern populations due to shortened breeding seasons and colder temperatures. Therefore, caution must be taken when comparing gonadotropin synthesis in different species and within a species that has a wide geographical distribution and latitudinal gradient.
4.3 Seasonal pituitary GH mRNA expression
Females grouped according to gonad stage showed increased GH mRNA levels during secondary oocyte growth and maturation. Males, when grouped according to gonad stage, did not show significant changes in GH mRNA levels. However, both female and male LMB GH mRNA expression followed closely the expression of LHβ and FSHβ mRNA expression throughout the year. Meiri et al. (2004) reported a significant correlation between LHβ mRNA and GH mRNA, but no relationship between FSHβ mRNA and GH mRNA levels in male gilthead seabream (Sparus auratus). Therefore, GH synthesis and production in female and male LMB is likely important for gonad development and sexual maturation.
There is both in vitro and in vivo evidence from other teleost fish that GH is important in both gonadal gametogenesis (Loir et al., 1999) and steroidogenesis (Singh et al. 1988) and that there is crosstalk between the gonadotropic and somatotropic axes in fish. The control of GH secretion is mediated in part by gonadotropin-releasing hormone (GnRH) as GnRH receptors are present on both gonadotrophs and somatotrophs in the goldfish pituitary (Cook et al., 1991). This finding supports previous data demonstrating that there can be a significant release of both LH and GH during spawning in male goldfish (Yu et al., 1991). Marchant et al. (1989) demonstrated in female goldfish that both cGnRH-II and sGnRH increased circulating LH and GH plasma levels. In dispersed goldfish pituitary cells, cGnRH-II stimulated GH mRNA synthesis (Klausen et al., 2001) and dispersed pituitary cells from pre-spawning female Masu salmon incubated with 1–10 nM sGnRH showed increased pituitary GH mRNA levels (Onuma et al., 2005). In vivo implantation of a GnRH capsule in Masu salmon increased GH synthesis in the pituitary during sexual maturation in both females and males (Bhandari et al., 2003). GH is an important regulator of reproductive processes in fish and increased transcription of GH mRNA in the LMB pituitary concomitantly with increasing gonadotropins suggests this may also be the case for LMB.
4.4 Seasonal pituitary ER isoform mRNA expression
There is a close association in the expression of the ER isoforms in the pituitary of both female and male LMB, thus it is likely each ER isoform plays some role in mediating the effects of E2 on pituitary hormone synthesis and release. Both LMB females and males had comparable mRNA levels of each ER isoform in the pituitary and there were no notable differences in the expression of the ERs between the sexes. In sturgeon, Barannikova et al. (2002) demonstrated that both females and males had similar E2 binding in the pituitary after ovulation and spermiation. This suggests that the pituitary is a target for E2 feedback in both female and male teleost fish.
In wild female and male LMB, the expression of ERα mRNA varied across the year. ERβa mRNA did not significantly vary across the year in either sex or when considering gonad phase. In the female LMB liver, ERα mRNA levels are significantly higher during late secondary growth with active vitellogenesis (Feb-March) compared to early secondary growth (pre-vitellogenesis) (Oct-Dec) while showing relatively constant but low expression in the ovary (Sabo-Attwood et al., 2004). In contrast, ERβa expression is relatively low in the liver and is highest in the gonad during pre-vitellogenesis. The regulation of ERs mRNA by E2 is complex and the mechanisms are not well understood. There are also specific tissue responses in the regulation of ERs to E2 injection or implantation (Sabo-Attwood et al., 2004; Marlatt et al., 2008).
Transcript levels of ER isoforms were significantly correlated to gonadotropin and GH mRNA levels in both sexes of LMB. There is evidence that E2 both inhibits and stimulates gonadotropin mRNA synthesis in the pituitary of fish depending upon sexual state and maturity of the animal. In vitro treatment of goldfish pituitary cells with varying doses of E2 largely stimulated the expression of all three gonadotropin subunits, however FSHβ was 50-fold less responsive than LHβ (Huggard-Nelson, 2002). In dispersed Masu salmon primary pituitary cells, E2 incubation for 72 hours increased LHβ mRNA levels, predominantly during the sexual maturation phase when compared to the pre-pawning and spawning stages (Ando et al., 2004). In the same study, female pituitary cells showed a higher induction of LHβ mRNA following E2 incubation than male pituitary cells at certain times of the year. In early-pubertal female and male Atlantic croaker, a single i.p. injection of 1 or 5 μg E2/g body weight resulted in 50–70% decrease in FSHβ mRNA after 120 hours while high E2 injection increased LHβ mRNA 3.5-fold (Banerjee and Khan, 2008).
Promoter characterization also provides some evidence that E2 directly regulates gonadotropin subunit gene expression. In chinook salmon (Oncorhynchus tschawytscha), there are estrogen response elements (EREs) present in the promoter of the gonadotropin II β (LHβ) subunit gene (Liu et al., 1995) and in the FSHβ promoter, there are half EREs (Chong et al., 2004). In the FSHβ subunit gene in tilapia, a full consensus sequence for the estrogen response elements (ERE) was not observed within the 5′ flanking region although there were three ERE half sites identified (Rosenfeld et al., 2001), suggesting there are DNA binding sites for ER regulation in the promoters of teleost gonadotropin genes.
ER expression was also correlated to GH mRNA levels in female and male LMB. Similar to pituitary gonadotropin synthesis, GH mRNA levels in teleost fish can also be modulated by E2 feedback in vitro (Onuma et al., 2005) and in vivo (Trudeau et al., 1992; Zou et al., 1997). In rainbow trout, there are EREs present in the promoter of the GH 1 gene (Yang et al., 1997) but it is not known if this is the case in LMB. Although there is good evidence that E2 regulates gonadotropin and GH mRNA expression, what remains to be determined is how each of the ER isoforms contributes to GH transcriptional control.
Conclusions
In summary, this study describes transcript levels for genes important for reproduction in the pituitary of both wild female and male LMB throughout the year and characterizes the seasonal and sex differences in gonadotropin, GH, and ER isoform pituitary levels. This study provides novel information of the relationship between ER expression and reproductive pituitary hormone transcripts in teleost fish and suggests that E2 regulation of transcripts in the pituitary may be equally important in female and male bass.
Acknowledgments
This research was funded in part by a Canadian Natural Sciences and Engineering Research Council (NSERC) PDF to CJM and the National Institute of Environmental Health Sciences RO1 ES015449 to ND. The authors also thank employees of the Florida Wildlife Research Institute (FWRI) for sampling fish from the St. John’s River, particularly G. Delpizzo, B. Thompson, and H. Smith. They also want to thank N. Perry, T. Piacenza and Y. Waters of the FWRI for completing the histological procedures.
Footnotes
Publisher's Disclaimer: This is a PDF file of an unedited manuscript that has been accepted for publication. As a service to our customers we are providing this early version of the manuscript. The manuscript will undergo copyediting, typesetting, and review of the resulting proof before it is published in its final citable form. Please note that during the production process errors may be discovered which could affect the content, and all legal disclaimers that apply to the journal pertain.
References
- Ando H, Swanson P, Kitani T, Koide N, Okada H, Ueda H, Urano A. Synergistic effects of salmon gonadotropin-releasing hormone and estradiol-17beta on gonadotropin subunit gene expression and release in masu salmon pituitary cells in vitro. Gen Comp Endocrinol. 2004;137:109–121. doi: 10.1016/j.ygcen.2004.02.012. [DOI] [PubMed] [Google Scholar]
- Banerjee A, Khan IA. Molecular cloning of FSH and LH beta subunits and their regulation by estrogen in Atlantic croaker. Gen Comp Endocrinol. 2008;155:827–837. doi: 10.1016/j.ygcen.2007.09.016. [DOI] [PubMed] [Google Scholar]
- Barannikova IA, Dyubin VP, Bayunova LV, Semenkova TB. Steroids in the control of reproductive function in fish. Neurosci Behav Physiol. 2002;32:141–148. doi: 10.1023/a:1013923308125. [DOI] [PubMed] [Google Scholar]
- Bhandari RK, Taniyama S, Kitahashi T, Ando H, Yamauchi K, Zohar Y, Ueda H, Urano A. Seasonal changes of responses to gonadotropin-releasing hormone analog in expression of growth hormone/prolactin/somatolactin genes in the pituitary of masu salmon. Gen Comp Endocrinol. 2003;130:55–63. doi: 10.1016/s0016-6480(02)00536-1. [DOI] [PubMed] [Google Scholar]
- Biswas A, Kundu S, Roy S, De J, Pramanik M, Ray AK. Thyroid hormone profile during annual reproductive cycle of diploid and triploid catfish, Heteropneustes fossilis (Bloch) Gen Comp Endocrinol. 2006;147:126–132. doi: 10.1016/j.ygcen.2005.12.012. [DOI] [PubMed] [Google Scholar]
- Blum JL, Nyagode BA, James MO, Denslow ND. Effects of the pesticide methoxychlor on gene expression in the liver and testes of the male largemouth bass (Micropterus salmoides) Aquat Toxicol. 2008;86:459–69. doi: 10.1016/j.aquatox.2007.12.008. [DOI] [PMC free article] [PubMed] [Google Scholar]
- Bogerd J, Granneman JC, Schulz RW, Vischer HF. Fish FSH receptors bind LH: how to make the human FSH receptor to be more fishy? Gen Comp Endocrinol. 2005;142:34–43. doi: 10.1016/j.ygcen.2004.12.008. [DOI] [PubMed] [Google Scholar]
- Canosa LF, Chang JP, Peter RE. Neuroendocrine control of growth hormone in fish. Gen Comp Endocrinol. 2007;151:1–26. doi: 10.1016/j.ygcen.2006.12.010. [DOI] [PubMed] [Google Scholar]
- Chew RL. Early life history of the Florida largemouth bass. Florida Game and Freshwater Fish Commission; Tallahassee, Florida: 1974. Fishery Bulletin No. 7. [Google Scholar]
- Choi CY, Habibi HR. Molecular cloning of estrogen receptor alpha and expression pattern of estrogen receptor subtypes in male and female goldfish. Mol Cell Endocrinol. 2003;204:169–177. doi: 10.1016/s0303-7207(02)00182-x. [DOI] [PubMed] [Google Scholar]
- Chong KL, Wang S, Melamed P. Isolation and characterization of the follicle-stimulating hormone beta subunit gene and 5′ flanking region of the Chinook salmon. Neuroendocrinology. 2004;80:158–170. doi: 10.1159/000082357. [DOI] [PubMed] [Google Scholar]
- Clugston JP. Centrarchid spawning in the Florida Everglades. Quarterly J Florida Acad Sciences. 1966;29:137–143. [Google Scholar]
- Cook H, Berkenbosch JW, Fernhout MJ, Yu KL, Peter RE, Chang JP, Rivier JE. Demonstration of gonadotropin releasing-hormone receptors on gonadotrophs and somatotrophs of the goldfish: an electron microscope study. Regul Pept. 1991;36:369–378. doi: 10.1016/0167-0115(91)90070-w. [DOI] [PubMed] [Google Scholar]
- Du JL, Lee YH, Yueh WS, Chang CF. Seasonal profiles of brain and pituitary gonadotropin-releasing hormone and plasma luteinizing hormone in relation to sex change of protandrous black porgy, Acanthopagrus schlegeli. Biol Reprod. 2005;72:922–931. doi: 10.1095/biolreprod.104.033159. [DOI] [PubMed] [Google Scholar]
- Gen K, Okuzawa K, Senthilkumaran B, Tanaka H, Moriyama S, Kagawa H. Unique expression of gonadotropin-I and -II subunit genes in male and female red seabream (Pagrus major) during sexual maturation. Biol Reprod. 2000;63:308–319. doi: 10.1095/biolreprod63.1.308. [DOI] [PubMed] [Google Scholar]
- Gomez JM, Weil C, Ollitrault M, Le Bail PY, Breton B, Le Gac F. Growth hormone (GH) and gonadotropin subunit gene expression and pituitary and plasma changes during spermatogenesis and oogenesis in rainbow trout (Oncorhynchus mykiss) Gen Comp Endocrinol. 1999;113:413–28. doi: 10.1006/gcen.1998.7222. [DOI] [PubMed] [Google Scholar]
- Halm S, Martinez-Rodriguez G, Rodriguez L, Prat F, Mylonas CC, Carrillo M, Zanuy S. Cloning, characterisation, and expression of three oestrogen receptors (ERalpha, ERbeta1 and ERbeta2) in the European sea bass, Dicentrarchus labrax. Mol Cell Endocrinol. 2004;223:63–75. doi: 10.1016/j.mce.2004.05.009. [DOI] [PubMed] [Google Scholar]
- Hassin S, Holland MC, Zohar Y. Early maturity in the male striped bass, Morone saxatilis: follicle-stimulating hormone and luteinizing hormone gene expression and their regulation by gonadotropin-releasing hormone analogue and testosterone. Biol Reprod. 2000;63:1691–1697. doi: 10.1095/biolreprod63.6.1691. [DOI] [PubMed] [Google Scholar]
- Hellqvist A, Schmitz M, Mayer I, Borg B. Seasonal changes in expression of LH-beta and FSH-beta in male and female three-spined stickleback, Gasterosteus aculeatus. Gen Comp Endocrinol. 2006;145:263–269. doi: 10.1016/j.ygcen.2005.09.012. [DOI] [PubMed] [Google Scholar]
- Huggard-Nelson DL, Nathwani PS, Kermouni A, Habibi HR. Molecular characterization of LH-beta and FSH-beta subunits and their regulation by estrogen in the goldfish pituitary. Mol Cell Endocrinol. 2002;188:171–193. doi: 10.1016/s0303-7207(01)00716-x. [DOI] [PubMed] [Google Scholar]
- Jalabert B. Particularities of reproduction and oogenesis in teleost fish compared to mammals. Reprod Nutr Dev. 2005;45:261–79. doi: 10.1051/rnd:2005019. [DOI] [PubMed] [Google Scholar]
- Klausen C, Chang JP, Habibi HR. The effect of gonadotropin-releasing hormone on growth hormone and gonadotropin subunit gene expression in the pituitary of goldfish, Carassius auratus. Comp Biochem Physiol B Biochem Mol Biol. 2001;129:511–516. doi: 10.1016/s1096-4959(01)00351-7. [DOI] [PubMed] [Google Scholar]
- Kumar RS, Trant JM. Hypophyseal gene expression profiles of FSH-beta, LH-beta, and glycoprotein hormone-alpha subunits in Ictalurus punctatus throughout a reproductive cycle. Gen Comp Endocrinol. 2004;136:82–89. doi: 10.1016/j.ygcen.2003.12.006. [DOI] [PubMed] [Google Scholar]
- Liu D, Xiong F, Hew CL. Functional analysis of estrogen-responsive elements in chinook salmon (Oncorhynchus tschawytscha) gonadotropin II beta subunit gene. Endocrinology. 1995;136:3486–3493. doi: 10.1210/endo.136.8.7628385. [DOI] [PubMed] [Google Scholar]
- Loir M. Spermatogonia of rainbow trout: II. in vitro study of the influence of pituitary hormones, growth factors and steroids on mitotic activity. Mol Reprod Dev. 1999;53:434–342. doi: 10.1002/(SICI)1098-2795(199908)53:4<434::AID-MRD9>3.0.CO;2-L. [DOI] [PubMed] [Google Scholar]
- Marchant TA, Chang JP, Nahorniak CS, Peter RE. Evidence that gonadotropin-releasing hormone also functions as a growth hormone-releasing factor in the goldfish. Endocrinology. 1989;124:2509–2518. doi: 10.1210/endo-124-5-2509. [DOI] [PubMed] [Google Scholar]
- Marlatt VL, Martyniuk CJ, Zhang D, Xiong H, Watt J, Xia X, Moon T, Trudeau VL. Auto-regulation of estrogen receptor subtypes and gene expression profiling of 17beta-estradiol action in the neuroendocrine axis of male goldfish. Mol Cell Endocrinol. 2008;283:38–48. doi: 10.1016/j.mce.2007.10.013. [DOI] [PubMed] [Google Scholar]
- Mateos J, Mañanós E, Carrillo M, Zanuy S. Regulation of follicle-stimulating hormone (FSH) and luteinizing hormone (LH) gene expression by gonadotropin-releasing hormone (GnRH) and sexual steroids in the Mediterranean Sea bass. Comp Biochem Physiol B Biochem Mol Biol. 2002;132:75–86. doi: 10.1016/s1096-4959(01)00535-8. [DOI] [PubMed] [Google Scholar]
- Mateos J, Mañanós E, Martínez-Rodríguez G, Carrillo M, Querat B, Zanuy S. Molecular characterization of sea bass gonadotropin subunits (alpha, FSHbeta, and LHbeta) and their expression during the reproductive cycle. Gen Comp Endocrinol. 2003;133:216–232. doi: 10.1016/s0016-6480(03)00164-3. [DOI] [PubMed] [Google Scholar]
- Meiri I, Knibb WR, Zohar Y, Elizur A. Temporal profile of beta follicle-stimulating hormone, beta luteinizing hormone, and growth hormone gene expression in the protandrous hermaphrodite, gilthead seabream, Sparus aurata. Gen Comp Endocrinol. 2004;137:288–299. doi: 10.1016/j.ygcen.2004.04.002. [DOI] [PubMed] [Google Scholar]
- Moles G, Carrillo M, Mañanós E, Mylonas CC, Zanuy S. Temporal profile of brain and pituitary GnRHs, GnRH-R and gonadotropin mRNA expression and content during early development in European sea bass (Dicentrarchus labrax L.) Gen Comp Endocrinol. 2007;150:75–86. doi: 10.1016/j.ygcen.2006.07.012. [DOI] [PubMed] [Google Scholar]
- Mylonas CC, Scott AP, Zohar Y. Plasma gonadotropin II, sex steroids, and thyroid hormones in wild striped bass (Morone saxatilis) during spermiation and final oocyte maturation. Gen Comp Endocrinol. 1997;108:223–236. doi: 10.1006/gcen.1997.6967. [DOI] [PubMed] [Google Scholar]
- Onuma T, Ando H, Koide N, Okada H, Urano A. Effects of salmon GnRH and sex steroid hormones on expression of genes encoding growth hormone/prolactin/somatolactin family hormones and a pituitary-specific transcription factor in masu salmon pituitary cells in vitro. Gen Comp Endocrinol. 2005;143:129–141. doi: 10.1016/j.ygcen.2005.03.003. [DOI] [PubMed] [Google Scholar]
- Prat F, Sumpter JP, Tyler CR. Validation of radioimmunoassays for two salmon gonadotropins (GTH I and GTH II) and their plasma concentrations throughout the reproductive cycle in male and female rainbow trout (Oncorhynchus mykiss) Biol Reprod. 1996;54:1375–1382. doi: 10.1095/biolreprod54.6.1375. [DOI] [PubMed] [Google Scholar]
- Rogers MW, Allen MS, Porak WF. Separating genetic and environmental influences on temporal spawning distributions of largemouth bass (Micropterus salmoides) Can J Fish Aquat Sci. 2006;63:2391–2399. [Google Scholar]
- Rogers MW, Allen MS. Exploring the generality of recruitment hypotheses for largemouth bass along a latitudinal gradient in Florida lakes. Trans Am Fish Soc. 2009;138:23–37. [Google Scholar]
- Rosenfeld H, Levavi-Sivan B, Gur G, Melamed P, Meiri I, Yaron Z, Elizur A. Characterization of tilapia FSHbeta gene and analysis of its 5′ flanking region. Comp Biochem Physiol B Biochem Mol Biol. 2001;129:389–398. doi: 10.1016/s1096-4959(01)00331-1. [DOI] [PubMed] [Google Scholar]
- Rozen S, Skaletsky HJ. Primer3 on the WWW for general users and for biologist programmers. In: Krawetz S, Misener S, editors. Bioinformatics Methods and Protocols: Methods in Molecular Biology. Humana Press; Totowa, NJ: 2000. pp. 365–386. [DOI] [PubMed] [Google Scholar]
- Sabo-Attwood T, Kroll KJ, Denslow ND. Differential expression of largemouth bass (Micropterus salmoides) estrogen receptor isotypes alpha, beta, and gamma by estradiol. Mol Cell Endocrinol. 2004;218:107–118. doi: 10.1016/j.mce.2003.12.007. [DOI] [PubMed] [Google Scholar]
- Santos EM, Rand-Weaver M, Tyler CR. Follicle-stimulating hormone and its alpha and beta subunits in rainbow trout (Oncorhynchus mykiss): purification, characterization, development of specific radioimmunoassays, and their seasonal plasma and pituitary concentrations in females. Biol Reprod. 2001;65:288–294. doi: 10.1095/biolreprod65.1.288. [DOI] [PubMed] [Google Scholar]
- Sepúlveda MS, Johnson WE, Higman JC, Denslow ND, Schoeb TR, Gross TS. An evaluation of biomarkers of reproductive function and potential contaminant effects in Florida largemouth bass (Micropterus salmoides floridanus) sampled from the St. Johns River Sci Total Environ. 2002;289:133–144. doi: 10.1016/s0048-9697(01)01029-4. [DOI] [PubMed] [Google Scholar]
- Singh H, Griffith RW, Takahashi A, Kawauchi H, Thomas P, Stegeman JJ. Regulation of gonadal steroidogenesis in Fundulus heteroclitus by recombinant salmon growth hormone and purified salmon prolactin. Gen Comp Endocrinol. 1988;72:144–153. doi: 10.1016/0016-6480(88)90190-6. [DOI] [PubMed] [Google Scholar]
- Trudeau VL, Somoza GM, Nahorniak CS, Peter RE. Interactions of estradiol with gonadotropin-releasing hormone and thyrotropin-releasing hormone in the control of growth hormone secretion in the goldfish. Neuroendocrinology. 1992;56(4):483–490. doi: 10.1159/000126265. [DOI] [PubMed] [Google Scholar]
- Yang BY, Chan KM, Lin CM, Chen TT. Characterization of rainbow trout (Oncorhynchus mykiss) growth hormone 1 gene and the promoter region of growth hormone 2 gene. Arch Biochem Biophys. 1997;340:359–368. doi: 10.1006/abbi.1997.9930. [DOI] [PubMed] [Google Scholar]
- Yu KL, Peng C, Peter RE. Changes in brain levels of gonadotropin-releasing hormone and serum levels of gonadotropin and growth hormone in goldfish during spawning, Can. J Zool. 1991;69:182–188. [Google Scholar]
- Zou JJ, Trudeau VL, Cui Z, Brechin J, Mackenzie K, Zhu Z, Houlihan DF, Peter RE. Estradiol stimulates growth hormone production in female goldfish. Gen Comp Endocrinol. 1997;106:102–112. doi: 10.1006/gcen.1996.6857. [DOI] [PubMed] [Google Scholar]