

Abstract
Solid pseudopapillary tumor of the pancreas (SPTP) is a low-grade malignant tumor with a favorable prognosis after surgery. Many previous studies have focused on clinical features or pathological biomarkers of the disease, but a better understanding of the molecular mechanisms underlying SPTP may help guide future therapeutic strategies. Here, we used isobaric tags for relative and absolute quantitation (iTRAQ) technology integrated with liquid chromatography-tandem mass spectrometry (LC-MS/MS) analysis to identify differentially expressed proteins in SPTP specimens. A total of 1171 proteins with a threshold of a 1.5-fold change and a p value ≤ 0.05 between SPTP tissue and matched normal pancreas tissue were identified for bioinformatics analysis. Mass spectrometry results were then further confirmed by assessing six representative proteins (ACADL, EPHX2, MSI2, DKK4, JUP, and DAD1) in individual specimens with immunohistochemistry. Upon mapping of the differentially expressed proteins to the Kyoto Encyclopedia of Genes and Genomes pathways database, we found several new cell-adhesion molecules that could be used as pathologic biomarkers. Furthermore, we observed that many endoplasmic reticulum-associated proteins were altered, suggesting that endoplasmic reticulum stress may play an important role in SPTP tumorigenesis. Seven proteins (ERO1LB, TRIM1, GRP94, BIP, SEC61B, P4HB, and PDIA4) in this pathway were further validated by immunohistochemistry, and six of them (except SEC61B) coincided to the LC-MS/MS results. This first comprehensive analysis of the SPTP proteome confirms proteins that have been implicated in earlier reports and reveals novel candidates and pathways that could be investigated further for clinical applications.
Solid pseudopapillary tumor of the pancreas (SPTP)1 is an uncommon epithelial neoplasm of low malignant potential that occurs predominantly in young women. It was first described by Frantz in 1959 as a solid and cystic lesion that was previously misdiagnosed as a rare islet tumor or as an acinar cell carcinoma (1). The incidence of SPTP is relatively low and accounts for ∼1–2% of all pancreatic tumors. Most patients with the disease do not have significant symptoms until the volume of the tumor is very large or present with other complications. In 1996, the World Health Organization (WHO) reclassified SPTP as a low-grade malignant tumor because of its biological behavior (2). Fortunately, the tumor is confined to the pancreas in 85% of patients. Patients with SPTP have a favorable prognosis after complete excision, with a 5-year survival rate of 85%. Even the 15% of patients with recurrent SPTP or with liver or peritoneal metastasis or invasion generally have good long-term survival (3–5).
The reported incidence of SPTP has increased with improved detection methods in the last decade, and much pathologic and clinical effort has been aimed at understanding the origin and development of SPTP. In a large-scale study at Ruijin Hospital, a total of 82 cases of SPTP were studied retrospectively. The authors concluded that SPTP with incomplete capsules often presented with malignant behavior and hypothesized that SPTP was probably caused by disordered pancreatic stem cell development (6). Another group at the University of Kiel analyzed 59 patients and postulated that SPTP might be derived from genital ridge/ovarian anlage-related cells (7). Moreover, sex hormone receptors, such as progesterone receptor (PR), have been evaluated by IHC. Nearly 80% of the SPTP specimens (22/28) have high positive staining for PR (8), indicating that abnormal activation of the progesterone pathway may contribute to the disease. At the molecular level, most findings have centered on aberrant WNT pathway activity. For example, mutations of CTNNB1 were the only apparent mutations identified by whole-exome sequencing of tumors from eight patients with SPTP (9). Muller-Hocker et al. have also shown via IHC that some cell-cycle associated proteins are down-regulated in SPTP tissue (10). However, the SPTP proteome has not yet been systemically analyzed.
Current SPTP diagnosis and treatment methods are based on traditional histopathologic examination and clinical features. Although some useful SPTP biomarkers such as CD99, CD10, and E-cadherin have been identified in previous studies (11–14), there are still many problematic cases in which a panel of these pathologic markers is insufficient to distinguish SPTP. Furthermore, proteomic characterization of SPTP will allow both researchers and clinicians to understand the disease much better, which may be useful to develop nonsurgical treatments in the future. Gel-Free approaches (e.g. LC-MS/MS) integrated with iTRAQ represent a new technology for measuring expression levels of different proteins that has been widely used in the analysis of clinical tissues. Numerous studies have used this technology to identify new biomarkers and pathways for many diseases. The aim of this study was to build a high-confidence, novel protein biomarker panel from our large set of clinical SPTP specimens. We analyzed differentially expressed proteins in SPTP specimens by using LC-MS/MS mass spectrometry and iTRAQ labeling and identified 1171 proteins whose expression significantly differed (>1.5-fold change and p value <0.05) between normal pancreas tissue and SPTP samples. Our findings that the endoplasmic reticulum protein processing pathway is potentially associated with SPTP pathogenesis can be further investigated by researchers and clinicians.
EXPERIMENTAL PROCEDURES
Sample Collection
All specimens were collected at the time of surgery at the Department of General Surgery, Institute of Digestive Surgery, Ruijin Hospital, Shanghai JiaoTong University Medical School and deposited in liquid nitrogen. All samples were obtained from the patients with informed consent and with approval of the institutional ethics committee. Of specimens with a pathologic diagnosis of SPTP, we chose five normal-tumor tissue pairs from five different individuals (supplemental Table S1) for proteomic analysis.
Protein Preparation
All samples were homogenized in lysis buffer (4% SDS, 1 mm DTT, 150 mm Tris-HCl pH 8.0, and protease inhibitor). After 3 min incubation in boiling water, the homogenate was sonicated on ice. The crude extract was then incubated in boiling water again and clarified by centrifugation at 16,000 × g at 25 °C for 10 min. Protein content was determined with the BCA protein assay reagent (Beyotime, Shanghai, China).
Protein Digestion and iTRAQ Labeling
Protein digestion was performed according to the filter-aided sample preparation procedure described by Wisniewski et al. (15) and the resulting peptide mixture was labeled using the 8-plex iTRAQ reagent according to the manufacturer's instructions (Applied Biosystems, Foster City, CA). Briefly, 200 μg of proteins for each sample were incorporated into 30 μl Buffer X (4% SDS, 100 mm DTT, and 150 mm Tris-HCl pH 8.0). The detergent, DTT, and other low-molecular-weight components were removed using Buffer Y (8 m Urea and 150 mm Tris-HCl pH 8.0) by repeated ultrafiltration (Microcon units, 30 kDa). Next, 100 μl 0.05 m iodoacetamide in Buffer Y was added to block reduced cysteine residues and the samples were incubated for 20 min in darkness. The filters were washed with 100 μl buffer Y three times and then washed twice with 100 μl Buffer Z (50 mm triethylammonium bicarbonate at pH 8.5). Finally, the protein suspensions were digested with 2 μg trypsin (Promega, Madison, WI) in 40 μl Buffer Z overnight at 37 °C and the resulting peptides were collected as a filtrate. The peptide content was estimated by UV light spectral density at 280 nm. The peptides from normal pancreas and matched SPTP were respectively mixed as a pool and then equally divided into three fractions (normal pancreas: N1, N2,and N3; SPTP: T1, T2, and T3). A standard pool comprising a mixture of equal amounts of protein derived from all samples served as an internal control (IS). The samples were labeled as IS-113, N1–114, N2–115, N3–116, T1–117, T2–118, and T3–119, and were multiplexed and vacuum dried. For labeling, each iTRAQ reagent was dissolved in 70 μl of ethanol and added to the respective peptide mixture.
Peptide Fractionation with Strong Cation Exchange (SCX) Chromatography
iTRAQ-labeled peptides were fractionated by SCX chromatography using the AKTA Purifier system (GE Healthcare). The dried peptide mixture was reconstituted and acidified with 2 ml Buffer A (10 mm KH2PO4 in 25% of ACN, pH 2.7) and loaded onto a PolySULFOETHYL 4.6 × 100 mm column (5 μm, 200 Å, PolyLC Inc, Columbia, MD). The peptides were eluted at a flow rate of 1 ml/min with a gradient of 0–10% Buffer B (500 mm KCl and 10 mm KH2PO4 in 25% of ACN, pH 2.7) for 7 min, 10–20% Buffer B for 10 min, 20–45% Buffer B for 5 min, and 45–100% Buffer B for 5 min. The elution was monitored by absorbance at 214 nm, and fractions were collected every 1 min. The collected fractions (about 30 fractions) were finally combined into 10 pools and desalted on C18 Cartridges (Empore™ SPE Cartridges C18 (standard density), bed I.D. 7 mm, volume 3 ml, Sigma). Each fraction was concentrated by vacuum centrifugation and reconstituted in 40 μl of 0.1% (v/v) trifluoroacetic acid. All samples were stored at −80 °C until LC-MS/MS analysis.
Liquid Chromatography (LC) - Electrospray Ionization (ESI) Tandem MS (MS/MS) Analysis by Q Exactive
Experiments were performed on a Q Exactive mass spectrometer that was coupled to Easy nLC (Proxeon Biosystems, now Thermo Fisher Scientific). 10 μl of each fraction was injected for nanoLC-MS/MS analysis. The peptide mixture (5 μg) was loaded onto the C18-reversed phase column (Thermo Scientific Easy Column, 10-cm long, 75-μm inner diameter, 3-μm resin) in Buffer A (0.1% formic acid) and separated with a linear gradient of Buffer B (80% acetonitrile and 0.1% formic acid) at a flow rate of 250 nL/min controlled by IntelliFlow technology over 140 min. MS data was acquired using a data-dependent top10 method dynamically choosing the most abundant precursor ions from the survey scan (300–1800 m/z) for higher energy collisional dissociation (HCD) fragmentation. Determination of the target value is based on predictive Automatic Gain Control (pAGC). Dynamic exclusion duration was 60 s. Survey scans were acquired at a resolution of 70,000 at m/z 200 and resolution for HCD spectra was set to 17,500 at m/z 200. Normalized collision energy was 30 eV and the underfill ratio, which specifies the minimum percentage of the target value likely to be reached at maximum fill time, was defined as 0.1%. The instrument was run with peptide recognition mode enabled.
Sequence Database Searching and Data Analysis
MS/MS spectra were searched using the MASCOT engine (Matrix Science, London, UK; version 2.2) embedded into Proteome Discoverer 1.3 (Thermo Electron, San Jose, CA) against the Uniprot Human database (133549 sequences, downloaded on March 3, 2013) and the decoy database. For protein identification, the following options were used: Peptide mass tolerance = 20 ppm, MS/MS tolerance = 0.1 Da, Enzyme = Trypsin, Missed cleavage = 2, Fixed modification: Carbamidomethyl (C), iTRAQ 8plex (K), iTRAQ 8plex (N-term), and Variable modification: Oxidation (M), FDR ≤ 0.01.
Bioinformatic Analysis
The sequence data of the selected differentially expressed proteins were retrieved in batches from the UniProtKB database (Release 2013_12) in FASTA format. The retrieved sequences were locally searched against the SwissProt database (human) using the NCBI BLAST+ client software (ncbi-blast-2.2.28+-win32.exe) to find homolog sequences so that the identified sequences can be functionally annotated. The top 10 blast hits with an E-value less than 1e-3 for each query sequence were retrieved and loaded into Blast2GO (16) (Version 2.7.0) for gene ontology (GO) (17) mapping and annotation. An annotation configuration with an E-value filter of 1e-6, default gradual enzyme codes (EC) weights, a GO weight of 5, and an annotation cutoff of 90 were chosen. Unannotated sequences were then reannotated with more permissive parameters. Sequences without BLAST hits and unannotated sequences were then selected for InterProScan (18) against EBI databases to retrieve functional annotations of protein motifs and merge the InterProScan GO terms to the annotation set. Following annotation and annotation augmentation steps, the studied proteins were blasted against KEGG genes (human) to retrieve their KEGG orthology identifications and were subsequently mapped to pathways in KEGG (19).
Immunohistochemistry
Formalin-fixed paraffin-embedded SPTP tissues (n = 20) and matched normal pancreas tissue (n = 20) were used for the IHC studies(see supplemental Table S3). All samples were obtained from the patients with informed consent and with approval of the institutional ethics committee. The following primary antibodies were used: anti-MSI2 rabbit affinity isolated, 1:200; anti-DKK4 rabbit polyclonal, 1:200; anti-JUP mouse clone 2G9, 1:150; anti-ACADL rabbit affinity isolated, 1:100; anti-EPHX2 rabbit affinity isolated, 1:100; and anti-DAD1 rabbit affinity isolated, 1:200. All antibodies above were obtained from Sigma-Aldrich and diluted in 0.1 m PBS. Anti-TRAM1 rabbit polyclonal, 1:100; anti-SEC61B rabbit polyclonal, 1:50; anti-PDIA4 rabbit polyclonal, 1:100; anti-GRP94 mouse monoclonal, 1:200; anti-BIP rabbit polyclonal, 1:50; anti-P4HB mouse monoclonal, 1:400; and anti-ERO1LB rabbit polyclonal, 1:100. All antibodies above were obtained from LifeSpan Biosciences (Seattle, WA) and diluted in 0.1 m PBS. After deparaffinization and rehydration, antigen retrieval was performed by immersing the slides in antigen retrieval buffer (10 mm sodium citrate, pH 6.0) at 95 °C for 30 min then treating with Tris-buffered saline with 0.1% Triton X-100 (TBST, pH 7.6) for 5 min. Endogenous peroxidases were blocked with 3% hydrogen peroxide for 10 min. After washing three times with 0.01 m PBS, nonspecific binding was blocked with goat serum for 30 min. Tissues were then incubated with primary antibodies at 4 °C overnight followed by incubation with peroxidase-labeled polymer conjugate to anti-rabbit immunoglobulins (Invitrogen, Carlsbad, CA) for 1 h at 37 °C. After washing with 0.01 m PBS, DAB (Boster, Wuhan, China) was used to visualize tissue antigens. The sections were counterstained with hematoxylin and dehydrated. All slides were examined and scored by two of the pathologists who were blinded to clinical data of patients. Staining intensity was recorded on the following scale: 0, no staining was observed, or staining was observed in less than 10% of tumor cells; 1+, mild perceptible staining was detected in more than 10% of tumor cells; 2+, moderate staining was observed in more than 10% of tumor cells or strong staining in less than 30%; and 3+, strong staining was observed in more than 30% of tumor cells.
Statistical Method
The statistical differences in IHC scores of tumor tissues and matched adjacent non-tumor tissues were analyzed by a paired t test. p < 0.05 was considered to indicate a statistically significant difference. Statistical analysis was performed using the Statistical Program for Social Sciences (SPSS) software 17.0 (SPSS Inc., Chicago, IL).
RESULTS
To identify differentially expressed proteins in SPTP we performed a study based on the technology of LC-MS/MS combined with SCX. Equal amounts of proteins from normal pancreas and matched tumor specimens were digested by trypsin and the resulting peptide mixture was labeled using iTRAQ reagents (113 as an internal control; 114, 115, and 116 for the normal samples; 117, 118, and 119 for the SPTP specimens). The iTRAQ labeled peptides were fractionated by SCX chromatography and the eluted fractions were then analyzed by LC-MS/MS. The recognized peptides were then searched against the UniProt Knowledgebase (version: 2013.11). The whole workflow is shown in Fig. 1. A total of 26,209 peptides Supplemental table S6 matching 4507 proteins (≥1 peptide) Supplemental table S7 were identified from the tissue analysis. Fold changes of proteins were determined by the ratios of the iTRAQ reporter ions between normal and tumor samples. Using a threshold of 1.5-fold change and a p value ≤0.05, 1171 proteins (558 up-regulated and 613 down-regulated; see supplemental Table S2) were extracted. The top five up-regulated proteins in the proteomics analysis are hepatocyte growth factor-like protein alpha chain, gelsolin, hemoglobin alpha-2, doublecortin domain-containing protein 5, and hemoglobin beta chain. The top 5 down-regulated proteins are a-kinase anchor protein 11, zinc finger protein 714, hydrocephalus-inducing protein homolog, cytochrome c oxidase subunit 2, and trypsin-1.
Fig. 1.

Schematic representation of the applied workflow.
In order to confirm the mass spectrometry results, we selected six differentially expressed proteins (ACADL, EPHX2, JUP, MSI2, DKK4, and DAD1; see Table I) to be examined by IHC. We selected these six proteins because of 1) potential functional significance, 2) more than one peptide was identified by LC-MS/MS, and 3) a link to SPTP had not previously been reported. IHC was performed with 23 SPTP and five normal pancreas tissues. Representative IHC images were shown in Fig. 2, and the IHC results were summarized in Table II. MSI2 was mainly expressed in the nucleus whereas the other five proteins were expressed in the cytosol. For the two up-regulated proteins, moderate to strong positive staining (>1+) was shown for MSI2 in 75.0% of the SPTP cases (15/20) and DKK4 in 65.0% of the SPTP cases (13/20). In contrast, nuclear MSI2 expression (>1+) was only detected in 15.0% of the normal pancreas cases (3/20) and cytoplasmic DKK4 expression was detected in 15.0% of the normal pancreas cases (3/20). For the four down-regulated proteins, negative to mild staining (≤1+) was seen for ACADL in 85.0% of SPTP cases (17/20), for EPHX2 in 80.0% of SPTP cases (16/20), for JUP in 45.0% of SPTP cases (9/20), and for DAD1 in 75.0% of SPTP cases (15/20). However, the proportion of negative to moderate staining (≤1+) for these four proteins was 10% (ACADL), 20% (EPHX2), 5% (JUP), and 15% (DAD1). Pairs t test showed a statistically significant difference (p < 0.05) between the scores of the tumor-normal pairs for all these six proteins, which coincided with the MS findings.
Table I. Proteins chosen for IHC validation. (N: normal; T: tumor; Peptide: the number of peptides identified by LC-MS/MS).
| Protein ID | Gene | Protein | Fold change (N/T) | Peptide | Main function |
|---|---|---|---|---|---|
| P28330 | ACADL | Long-chain specific acyl-CoA dehydrogenase, mitochondrial | 2.18 | 2 | Catalyzes the initial step of mitochondrial beta-oxidation of straight-chain fatty acid |
| E5RFU2 | EPHX2 | Lipid-phosphate phosphatase | 1.81 | 12 | Binds to specific epoxides and converts them to the corresponding dihydrodiols |
| P14923 | JUP | Junction plakoglobin | 2.16 | 7 | Forms distinct complexes with cadherins |
| B4DHE8 | MSI2 | RNA-binding protein Musashi homolog 2 | 0.59 | 7 | Posttranscriptional gene regulation |
| Q9UBT3 | DKK4 | Dickkopf-related protein 4 | 0.26 | 11 | Embryonic development |
| F5GXX5 | DAD1 | Dolichyl-diphosphooli-gosaccharide-protein glycosyltransferase subunit | 1.62 | 4 | Is involved in protein processing in the ER |
Fig. 2.
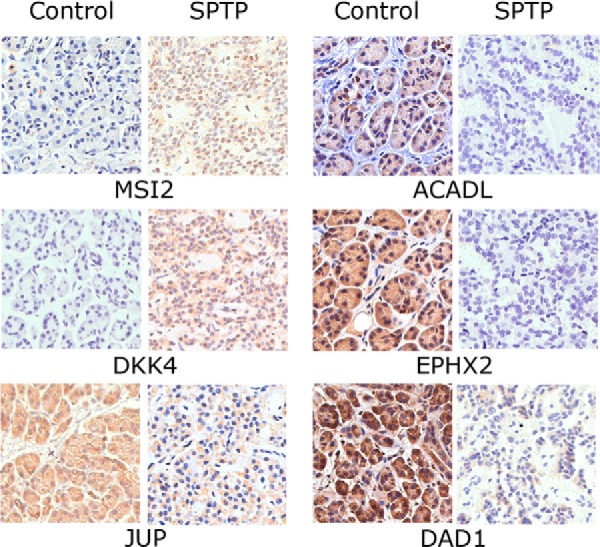
Immunohistochemistry of individual SPTP tissue and corresponding normal pancreas tissue from same patient (400x). Up-regulation of MSI2 and DKK4 and down-regulation of JUP, ACADL, EPHX2, and DAD1 were confirmed in SPTP specimens. The IHC protocol is described in the Materials and Methods. The staining scoring details are shown in Table II.
Table II. IHC staining scores in SPTP and matched normal pancreas tissues for Mass Sectrometry validation.
| Protein name | Proteomic result | Samples | Staining intensity |
p value | ||||
|---|---|---|---|---|---|---|---|---|
| 0 | 1+ | 2+ | 3+ | Total (>1+) | ||||
| MSI2 | Up-regulated | SPTP | 1 | 4 | 7 | 8 | 15/20 | <0.05 |
| Control | 14 | 3 | 2 | 1 | 3/20 | |||
| DKK4 | Up-regulated | SPTP | 2 | 5 | 7 | 6 | 13/20 | <0.05 |
| Control | 11 | 6 | 3 | 0 | 3/20 | |||
| ACADL | Down-regulated | SPTP | 12 | 5 | 2 | 1 | 3/20 | <0.05 |
| Control | 0 | 2 | 4 | 14 | 18/20 | |||
| EPHX2 | Down-regulated | SPTP | 7 | 9 | 3 | 1 | 4/20 | <0.05 |
| Control | 0 | 4 | 1 | 15 | 16/20 | |||
| JUP | Down-regulated | SPTP | 4 | 5 | 6 | 5 | 11/20 | <0.05 |
| Control | 0 | 1 | 11 | 8 | 19/20 | |||
| DAD1 | Down-regulated | SPTP | 12 | 3 | 3 | 2 | 5/20 | <0.05 |
| Control | 0 | 3 | 3 | 14 | 17/20 | |||
All the 1171 proteins identified by MS were subsequently classified by bioinformatics analysis. The gene ontology (GO) database is an internationally standardized gene functional classification system to comprehensively describe characteristics of different genes and their products. A total of 1078 proteins differentially expressed in SPTP were annotated to 10,824 GO function entries. Second-level GO terms were applied to classify proteins in terms of their involvement in three main categories (biological process, cellular component, and molecular function) and each protein was assigned at least one term. More than 75% (927 proteins) were annotated as belonging to the cell compartment, and the other two main categories of these proteins were the membrane (402 proteins) and organelle (716 proteins) compartments. As summarized in Fig. 3 and supplemental Table S4, the top three molecular functions were protein binding (737 proteins), catalytic activity (332 proteins), and enzyme regulatory activity (46 proteins). The top three biological processes identified were cellular process (972 proteins), single-organism process (849 proteins), and metabolic process (804 proteins).
Fig. 3.

Distribution of Gene Ontology (GO) functional categories in the SPTP proteome. Each annotated protein is assigned at least one GO term. All data are presented on the basis of GO second level terms. Numbers refer to assigned proteins in each category.
Because different proteins interact and cooperate to complete biochemical reactions, a KEGG pathway-based analysis was performed to identify pathways that would be potentially affected by differential protein expression in SPTP. The top three pathways identified were the ribosome (81 proteins, p < 0.01), protein processing in the endoplasmic reticulum (42 proteins, p = 0.01), and the complement and coagulation cascades (30 proteins, p < 0.01) (Fig. 4 and Table III). All KEGG analysis results are shown in supplemental Table S5. Several important proteins, such as protein disulfide-isomerases and protein transporter protein SECs, with functions in protein export, protein degradation, or ribosome anchoring could be classified as part of the endoplasmic reticulum protein processing pathway (Table IV). The expression of majority of these proteins was significantly reduced in SPTP tissues compared with the normal tissues.
Fig. 4.

Distribution of KEGG pathways in the SPTP proteome.
Table III. KEGG pathway analysis of the differentially expressed proteins in SPTP (top three pathways).
| Pathway | Associated proteins | p value |
|---|---|---|
| Ribosome | RPS8, RPL10A, RPS6, RPL30, RPSA, RPL5, RPL39, RPL23, RPL34, RPL10, RPS18, RPS9, RPS3A, RPL7A, RPS4X, RPL6, RPLP2, RPL38, RPS14, RPL13, RPS3, RPS25, RPL24, RPS16, RPL28, RPL3, RPL8, RPL7, RPS12, RPS2, RPS19, RPS20, RPL31, RPL12, RPL37, RPL19, RPL27A, RPL14, RPL4, RPS13, RPS21, RPL37A, RPL35, RPLP0, RPL18, RPL22, RPL15, RPL35A, RPS24, RPL36, RPL9, RPL26L1, RPS17L, RPL13A, RPL17, RPS11, RPL23A, RPS23, RPL18A, RPS10, ARPP1, RPL27, RPS5, RPL21, RPS7, RPL32, RPS28, RPL29, RPL36AL, RPS27L, RPS26, MRPL35, RPL26, RPLP1, CGIP34, RPS15, RPS29, MRPL18, UBA52, RPS30, RPL22L1 | <0.001 |
| Protein processing in endoplasmic reticulum | ERO1LB, DDOST, TRAM1, SEC23, STT3A, PDIA6, EIF2S1, BIP, TRA1, GSC1, SSR4, RPN2, LMAN1, P4HB, RPN1, RRBP1, UBQLN4, DNAJC3, PDIA3, SSR3, CR, PDIA4, SEC63, SEC61A1, SSR1, SEC24D, SEC31A, FBXO2, TXNDC5, MAN1A1, SEL1L, XTP3B, MDTFS1, OS9, DAD1, SEC61B, DNAJC1, SEC13, BFMCR2, UBE2E3, MAN1A2, NSFL1C | 0.001 |
| Complement and coagulation cascades | SERPING1, C3, C7, PLG, SERPINF2, C4BPB, C4B, A2M, FGA, C9, CFH, C1R, FGB, KNG1, FGG, C8B, F2, SERPINA1, C6, F9, C1QA, SERPINC1, SERPIND1, C1QC, CFB, C3BBPA, C5, C1QB, F10, KLKB1 | <0.001 |
Table IV. Differentally expressed proteins in the endoplasmic reticulum protein processing pathway (N: normal; T: tumor).
| Protein ID | Gene | Protein | Fold change(N/T) |
|---|---|---|---|
| B2RD00 | ERO1LB | cDNA, FLJ96396, highly similar to Homo sapiens ERO1-like beta (S. cerevisiae) | 2.35 |
| P39656 | DDOST | Dolichyl-diphosphooligosaccharide-protein glycosyltransferase 48 kDa subunit | 1.98 |
| G3XAN4 | TRAM1 | Translocating chain-associated membrane protein 1 | 1.89 |
| B4DRA5 | SEC23 | cDNA FLJ61346, highly similar to Protein transport protein SEC23 | 1.68 |
| P46977 | STT3A | Dolichyl-diphosphooligosaccharide-protein glycosyltransferase subunit | 2.03 |
| B7Z254 | PDIA6 | Protein disulfide-isomerase A6 | 2.12 |
| P05198 | EIF2S1 | Eukaryotic translation initiation factor 2 subunit 1 | 1.50 |
| P11021 | BIP | 78 kDa glucose-regulated protein | 1.96 |
| Q5CAQ5 | TRA1 | Tumor rejection antigen (Gp96) 1 | 1.91 |
| Q58F09 | GSC1 | Glucosidase I | 1.83 |
| P51571 | SSR4 | Translocon-associated protein subunit delta | 1.77 |
| B2RE46 | RPN2 | cDNA, FLJ96923, highly similar to Homo sapiens ribophorin II (RPN2) | 1.61 |
| P49257 | LMAN1 | Protein ERGIC-53 | 1.80 |
| P07237 | P4HB | Protein disulfide-isomerase | 2.83 |
| P04843 | RPN1 | Dolichyl-diphosphooligosaccharide-protein glycosyltransferase subunit 1 | 1.89 |
| A7BI36 | RRBP1 | p180/ribosome receptor | 3.31 |
| D3DVA8 | UBQLN4 | Ubiquilin 4, isoform CRA | 0.65 |
| Q13217 | DNAJC3 | DnaJ homolog subfamily C member 3 | 2.13 |
| B3KQT9 | PDIA3 | cDNA PSEC0175, clone OVARC1000169, highly similar to Protein disulfide-isomerase A3 | 1.63 |
| C9JA28 | SSR3 | Translocon-associated protein subunit gamma | 2.17 |
| Q53G71 | CR | Calreticulin variant (Fragment) | 1.88 |
| P13667 | PDIA4 | Protein disulfide-isomerase A4 | 1.96 |
| B3KQF0 | SEC63 | cDNA FLJ90354, clone NT2RP2003390, highly similar to Translocation protein SEC63 homolog | 1.73 |
| P61619 | SEC61A1 | Protein transport protein Sec61 subunit alpha isoform 1 | 1.63 |
| B2R6N9 | SSR1 | cDNA, FLJ93042, highly similar to Homo sapiens signal sequence receptor, alpha | 1.56 |
| E9PDM8 | SEC24D | Protein transport protein Sec24D | 1.61 |
| O94979 | SEC31A | Protein transport protein Sec31A | 1.52 |
| Q9UK22 | FBXO2 | F-box only protein 2 | 1.76 |
| Q86UY0 | TXNDC5 | TXNDC5 protein | 1.92 |
| P33908 | MAN1A1 | Mannosyl-oligosaccharide 1,2-alpha-mannosidase IA | 0.61 |
| Q9UBV2 | SEL1L | Protein sel-1 homolog 1 | 1.73 |
| B5MC72 | XTP3B | Endoplasmic reticulum lectin 1 | 0.65 |
| B4DR21 | MDTFS1 | cDNA FLJ58156, highly similar to Membrane-bound transcription factor site 1 protease | 4.52 |
| B4E1I6 | OS9 | cDNA FLJ53693, highly similar to Homo sapiens amplified in osteosarcoma (OS9), transcript variant 2, | 1.55 |
| F5GXX5 | DAD1 | Dolichyl-diphosphooligosaccharide–protein glycosyltransferase subunit | 1.62 |
| P60468 | SEC61B | Protein transport protein Sec61 subunit beta | 3.21 |
| A4VCI1 | DNAJC1 | DNAJC1 protein (Fragment) | 3.22 |
| A8MV37 | SEC13 | Protein SEC13 homolog | 1.59 |
| B3KM36 | BFMCR2 | cDNA FLJ10153, clone HEMBA1003417, highly similar to BAG family molecular chaperone regulator 2 | 0.62 |
| Q969T4 | UBE2E3 | Ubiquitin-conjugating enzyme E2 E3 | 0.63 |
| O60476 | MAN1A2 | Mannosyl-oligosaccharide 1,2-alpha-mannosidase IB | 1.71 |
| Q9UNZ2 | NSFL1C | NSFL1 cofactor p47 | 1.56 |
Next, seven markers (ERO1LB, TRIM1, GRP94, BIP, SEC61B, P4HB, and PDIA4) associated with the endoplasmic reticulum protein processing pathway were selected for validation of post-proteome bioinformatics by IHC in 20 normal-tumor pairs. We selected these seven markers because of the different functions in this pathway and significant fold-changes. Except SEC61B, all the other six markers showed a higher IHC staining scores (p value <0.05) in normal pancreatic tissues compared with the marched tumor tissues (Table V and Fig. 5). These markers, together with DAD1 indicated that abnormal expression of many proteins belonged to this pathway existed in SPTP.
Table V. IHC staining scores in SPTP and matched normal pancreas tissues for seven markers associated with endoplasmic reticulum protein processing pathway.
| Protein name | Proteomic result | Samples | Staining intensity |
p value | ||||
|---|---|---|---|---|---|---|---|---|
| 0 | 1+ | 2+ | 3+ | Total (> 1+) | ||||
| TRAM1 | Down-regulated | SPTP | 10 | 6 | 2 | 2 | 4/20 | <0.05 |
| Control | 1 | 2 | 3 | 13 | 16/20 | |||
| BIP | Down-regulated | SPTP | 8 | 10 | 1 | 1 | 2/20 | <0.05 |
| Control | 2 | 2 | 8 | 8 | 16/20 | |||
| ERO1LB | Down-regulated | SPTP | 7 | 9 | 2 | 2 | 4/20 | <0.05 |
| Control | 3 | 2 | 2 | 13 | 15/20 | |||
| PDIA4 | Down-regulated | SPTP | 5 | 7 | 5 | 3 | 8/20 | <0.05 |
| Control | 2 | 4 | 11 | 3 | 14/20 | |||
| GRP94 | Down-regulated | SPTP | 7 | 8 | 3 | 2 | 5/20 | <0.05 |
| Control | 1 | 2 | 5 | 12 | 17/20 | |||
| P4HB | Down-regulated | SPTP | 8 | 4 | 5 | 3 | 8/20 | <0.05 |
| Control | 0 | 2 | 4 | 14 | 18/20 | |||
| SEC61B | Down-regulated | SPTP | 5 | 11 | 4 | 0 | 4/20 | >0.05 |
| Control | 4 | 11 | 5 | 0 | 5/20 | |||
Fig. 5.
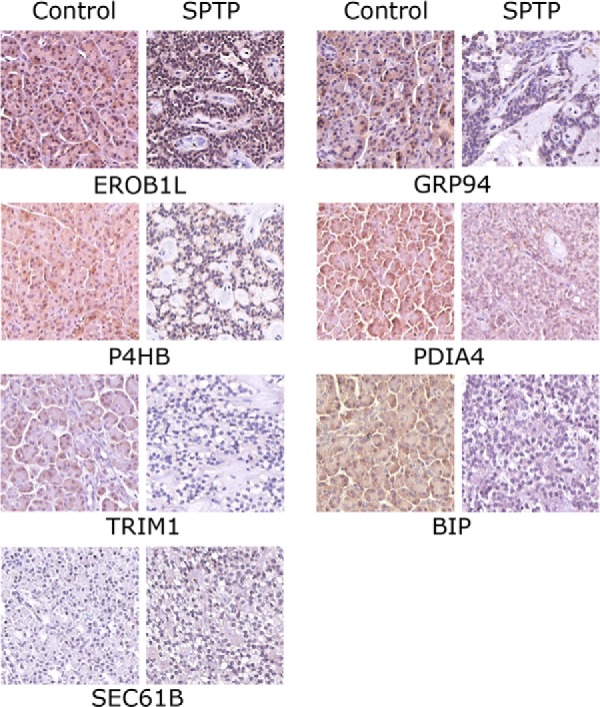
Immunohistochemistry image for markers associated with endoplasmic reticulum protein processing pathway in individual SPTP tissue and corresponding normal pancreas tissue from same patient (400x). ERO1LB, TRIM1, GRP94, BIP, SEC61B, P4HB, and PDIA4 were confirmed in SPTP specimens. The IHC protocol is described in the Materials and Methods. The staining scoring details are shown in Table V.
DISCUSSION
Researchers have not paid much attention to SPTP because it is a rare disease with a favorable prognosis. The proteomic data presented in this study and validated by IHC is to our knowledge the first report of a differentially expressed proteome in human SPTP. These data not only provide confirmation of earlier studies but also reveal new information about SPTP, which will facilitate further investigation of the disease.
Consistent with previous studies suggesting that cell adhesion or cell junction abnormalities are one of the most important pathogenic factors of this disease, many proteins associated with those functions were found in our data. For example, the claudin family plays an important role in cellular tight junctions. Immunohistochemical analysis of claudin expression levels in SPTP specimens showed intense membrane staining of claudin and cytoplasmic staining of claudin 2, lack of claudins 3 and 4, and positive staining of claudins 1 and 7 in several specimens (20–21), which corresponds with our results. CD99 has also been identified as a specific pathological biomarker for SPTP because of its paranuclear dot-like staining pattern (11, 12, 22). We also found that the expression level of CD99 in SPTP is lower than it is in the normal pancreas. More proteins identified as differentially expressed that are associated with cell adhesion such as F11 receptor (JAM1) and junction plakoglobin (JUP) are shown in Table VI and could be further investigated as pathologic biomarkers or pathogenic factors.
Table VI. Differentially expressed proteins associated with cell adhesion or cell junctions (N: normal; T: tumor).
| Protein ID | Gene | Protein | Fold change (N/T) |
|---|---|---|---|
| Q4QZC0 | HLA-A | MHC class I antigen (Fragment) | 0.47 |
| E0WMV9 | HLA-B | MHC class I antigen (Fragment) | 0.52 |
| K7EP40 | CLDN7 | Claudin-7 (Fragment) | 2.10 |
| D6RGZ6 | VCAN | Versican core protein (Fragment) | 0.32 |
| O00501 | CLDN5 | Claudin-5 | 0.34 |
| H7BYX6 | NCAM1 | Neural cell adhesion molecule 1 | 0.59 |
| O19697 | HDPA2 | Hla-dcalpha partial alpha 2 domain (extracellular domain) (Fragment) | 0.64 |
| Q6PEY4 | ALCAM | ALCAM protein | 2.12 |
| Q4KMQ7 | NRCAM | NRCAM protein | 1.96 |
| Q9Y5B2 | JAM | Junction adhesion molecule | 1.81 |
| B3GN61 | CDH1 | Truncated E-cadherin | 2.05 |
| A6NIW1 | CD99 | CD99 antigen | 1.78 |
| B4DT61 | SDC | Syndecan | 1.52 |
| Q9UDY2 | TJP2 | Tight junction protein ZO-2 | 0.66 |
| Q96GD7 | CSDA | CSDA protein | 1.81 |
| Q7Z406 | MYH14 | Myosin-14 | 1.73 |
| P63096 | GNAI1 | Guanine nucleotide-binding protein G(i) subunit alpha-1 | 0.59 |
| Q9P2M7 | CGN | Cingulin | 2.13 |
| Q4VB86 | EPB41 | EPB41 protein | 0.57 |
| P20337 | RAB3B | Ras-related protein Rab-3B | 1.74 |
| P13535 | MYH8 | Myosin-8 | 0.63 |
| B4DH86 | MPDZD | cDNA FLJ54707, highly similar to Multiple PDZ domain protein | 1.66 |
The top three pathways identified from the KEGG database analysis were the ribosome, protein processing in the endoplasmic reticulum, and the complement and coagulation cascades. To date, many studies have shown that the reduction of specific ribosome protein subunits might cause severe diseases (23–24). Our results show that almost all subunits of the 60S and 40S ribosomal proteins are reduced in the SPTP specimens, suggesting that protein biosynthesis may be attenuated at a global level. In addition, we found that the expression of a large number of proteins participating in the endoplasmic reticulum protein processing pathway was aberrant in this disease.
The endoplasmic reticulum (ER) is a cytoplasmic organelle in which secretory or membrane proteins are synthesized. Briefly, ER stress is defined as an imbalance between the protein folding capacity of the ER and the protein load, resulting in the accumulation of misfolded proteins (25). ER stress has been speculated to be involved in most conformational diseases, such as Alzheimer's disease and Parkinson's disease and some of the specific pathogenic unfolding proteins have also been identified (26–27). Based on our findings, we speculate that the whole ER protein processing pathway might be disrupted in SPTP because of abnormal expression of ER-associated proteins Fig. 6. ER chaperones consist of molecular chaperones and folding enzymes located in the ER, whose responsibility is the folding of nascent proteins (28). Binding protein (BIP), which belongs to the HSP70 family, is a core molecular chaperone that binds to the hydrophobic region of unfolded proteins and facilitates folding (29). Other molecular chaperones, such as SEC63 and DNAJC3 have been identified as cochaperones that modulate the function of BIP, were also reduced in SPTP tissues in our study. Furthermore, we found numerous folding enzymes, such as protein disulfide isomerases (PDI) and dolichyl-diphosphooligosaccharide protein glycosyltransferase (OST), were down-regulated in the SPTP specimens. These folding enzymes coordinate to oxidize cysteine residues of nascent proteins and help proteins to form correct disulfide bonds. Reduced folding enzymes are reoxidized by ER oxidoreductin (ERO1) (30), which was also down-regulated. Additionally, the abnormal expression of osteosarcoma 9 (OS9) and XTP3-transactivated gene B (XTP3B), which are ER-associated degradation (ERAD) components responsible for the recognition of unfolded proteins (31–33), occurs in SPTP compared with normal pancreas. Together, our findings suggest that the aberrant expression pattern of these proteins may cooperate to cause the accumulation of some misfolded proteins in the ER, which may endow the disease with a “degenerative property.” Additionally, Kim and colleagues have suggested that the nuclear pleomorphism of SPTP is a degenerative change rather than an alteration with high-grade malignant potential because of a lack of mitosis and low Ki-67 labeling index (34).The subsets of proteins from this and other altered pathways could be further investigated first for technical validation and then for clinical applications.
Fig. 6.

Putative endoplasmic reticulum protein processing pathway. A putative endoplasmic reticulum protein processing pathway was constructed based on KEGG mapping. Green squares indicate proteins identified as differentially expressed proteins; white circles indicate proteins not identified as differentially expressed in our study.
In conclusion, our study is the first systematic proteomic analysis of SPTP. Generating a high-confidence list of differentially expressed proteins in rare tumors is important to both doctors and patients. The relationship between ER stress and SPTP tumorigenesis has not been previously recognized, and suggests that future studies should be aimed at identifying pathogenic unfolded proteins in this disease.
Supplementary Material
Footnotes
Author contributions: H.C. and C.P. designed research; Y.Z. and H.X. performed research; J.X., M.S., B.S., X.D., C.L., and X.Z. analyzed data; H.C. and C.P. wrote the paper.
* This work was supported by the National Science Foundation of China (grant No. 31170938); Shanghai Committee of Science and Technology (grant No. 11JC1407800).
 This article contains supplemental Tables S1 to S7.
1 The abbreviations used are:
- SPTP
- Solid pseudopapillary tumor of the pancreas
- iTRAQ
- isobaric tags for relative and absolute quantification
- IHC
- immunohistochemistry
- LC
- liquid chromatography
- ESI
- electrospray ionization
- MS/MS
- tandem mass spectrometry.
REFERENCES
- 1. Frantz V. K., Blumberg C. W. (1959) Atlas Of Tumor Pathology, pp. 32–33, US Armed Forces Institute of Pathology, Washington, DC [Google Scholar]
- 2. Kloppel G., Solcia E., Longnecker D. S., Capella C., Sobin L. H. (1996) International Histological Classification Of Tumors, 2nd Ed., pp. 15–21, World Health Organization, Berlin, Heidelberg, New York [Google Scholar]
- 3. Horisawa M., Niinomi N., Sato T., Yokoi S., Oda K., Ichikawa M., Hayakawa S. (1995) Frantz's tumor (solid and cystic tumor of the pancreas) with liver metastasis: successful treatment and long-term follow-up. J. Pediatr. Surg. 30, 724–726 [DOI] [PubMed] [Google Scholar]
- 4. Saiura A., Umekita N., Matsui Y., Maeshiro T., Miyamoto S., Kitamura M., Wakikawa A. (2000) Successful surgical resection of solid cystic tumor of the pancreas with multiple liver metastases and a tumor thrombus in the portal vein. Hepatogastroenterology 47, 887–889 [PubMed] [Google Scholar]
- 5. Seo H. E., Lee M. K., Lee Y. D., Jeon S. W., Cho C. M., Tak W. Y., Kweon Y. O., Kim S. K., Choi Y. H., Bae H. I., Kim S. G., Yoon Y. K. (2006) Solid-pseudopapillary tumor of the pancreas. J. Clin. Gastroenterol. 40, 919–922 [DOI] [PubMed] [Google Scholar]
- 6. Ye J., Ma M., Cheng D., Yuan F., Deng X., Zhan Q., Shen B., Peng C. (2012) Solid-pseudopapillary tumor of the pancreas: clinical features, pathological characteristics, and origin. J. Surg. Oncol. 106, 728–735 [DOI] [PubMed] [Google Scholar]
- 7. Kosmahl M., Seada L. S., Janig U., Harms D., Kloppel G. (2000) Solid-pseudopapillary tumor of the pancreas: its origin revisited. Virchows Arch. 436, 473–480 [DOI] [PubMed] [Google Scholar]
- 8. Nguyen N. Q., Johns A. L., Gill A. J., Ring N., Chang D. K., Clarkson A., Merrett N. D., Kench J. G., Colvin E. K., Scarlett C. J., Biankin A. V. (2011) Clinical and immunohistochemical features of 34 solid pseudopapillary tumors of the pancreas. J. Gastroenterol. Hepatol. 26, 267–274 [DOI] [PubMed] [Google Scholar]
- 9. Wu J., Jiao Y., Dal Molin M., Maitra A., de Wilde R. F., Wood L. D., Eshleman J. R., Goggins M. G., Wolfgang C. L., Canto M. I., Schulick R. D., Edil B. H., Choti M. A., Adsay V., Klimstra D. S., Offerhaus G. J., Klein A. P., Kopelovich L., Carter H., Karchin R., Allen P. J., Schmidt C. M., Naito Y., Diaz L. A., Jr., Kinzler K. W., Papadopoulos N., Hruban R. H., Vogelstein B. (2011) Whole-exome sequencing of neoplastic cysts of the pancreas reveals recurrent mutations in components of ubiquitin-dependent pathways. Proc. Natl. Acad. Sci. U. S. A. 108, 21188–21193 [DOI] [PMC free article] [PubMed] [Google Scholar]
- 10. Muller-Hocker J., Zietz C. H., Sendelhofert A. (2001) Deregulated expression of cell cycle-associated proteins in solid pseudopapillary tumor of the pancreas. Mod. Pathol. 14, 47–53 [DOI] [PubMed] [Google Scholar]
- 11. Guo Y., Yuan F., Deng H., Wang H. F., Jin X. L., Xiao J. C. (2011) Paranuclear dot-like immunostaining for CD99: a unique staining pattern for diagnosing solid-pseudopapillary neoplasm of the pancreas. Am. J. Surg. Pathol. 35, 799–806 [DOI] [PubMed] [Google Scholar]
- 12. Li L., Li J., Hao C., Zhang C., Mu K., Wang Y., Zhang T. (2011) Immunohistochemical evaluation of solid pseudopapillary tumors of the pancreas: the expression pattern of CD99 is highly unique. Cancer Lett. 310, 9–14 [DOI] [PubMed] [Google Scholar]
- 13. Kim M. J., Jang S. J., Yu E. (2008) Loss of E-cadherin and cytoplasmic-nuclear expression of beta-catenin are the most useful immunoprofiles in the diagnosis of solid-pseudopapillary neoplasm of the pancreas. Hum. Pathol. 39, 251–258 [DOI] [PubMed] [Google Scholar]
- 14. Notohara K., Hamazaki S., Tsukayama C., Nakamoto S., Kawabata K., Mizobuchi K., Sakamoto K., Okada S. (2000) Solid-pseudopapillary tumor of the pancreas: immunohistochemical localization of neuroendocrine markers and CD10. Am. J. Surg. Pathol. 24, 1361–1371 [DOI] [PubMed] [Google Scholar]
- 15. Wisniewski J. R., Zougman A., Nagaraj N., Mann M. (2009) Universal sample preparation method for proteome analysis. Nat. Methods 6, 359–362 [DOI] [PubMed] [Google Scholar]
- 16. Gotz S., Garcia-Gomez J. M., Terol J., Williams T. D., Nagaraj S. H., Nueda M. J., Robles M., Talon M., Dopazo J., Conesa A. (2008) High-throughput functional annotation and data mining with the Blast2GO suite. Nucleic Acids Res. 36, 3420–3435 [DOI] [PMC free article] [PubMed] [Google Scholar]
- 17. Ashburner M., Ball C. A., Blake J. A., Botstein D., Butler H., Cherry J. M., Davis A. P., Dolinski K., Dwight S. S., Eppig J. T., Harris M. A., Hill D. P., Issel-Tarver L., Kasarskis A., Lewis S., Matese J. C., Richardson J. E., Ringwald M., Rubin G. M., Sherlock G. (2000) Gene ontology: tool for the unification of biology. The Gene Ontology Consortium. Nat. Genet. 25, 25–29 [DOI] [PMC free article] [PubMed] [Google Scholar]
- 18. Quevillon E., Silventoinen V., Pillai S., Harte N., Mulder N., Apweiler R., Lopez R. (2005) InterProScan: protein domains identifier. Nucleic Acids Res. 33, W116–W120 [DOI] [PMC free article] [PubMed] [Google Scholar]
- 19. Kanehisa M., Goto S., Sato Y., Furumichi M., Tanabe M. (2012) KEGG for integration and interpretation of large-scale molecular data sets. Nucleic Acids Res. 40, D109–D114 [DOI] [PMC free article] [PubMed] [Google Scholar]
- 20. Zheng H. Y., Shi Y. H., Zhang L. F., Chen Y. Z. (2013) [Evaluation of the expression and significance of Claudin-5 and CD99 in solid-pseudopapillary neoplasms and neuroendocrine tumors of pancreas]. Zhonghua bing li xue za zhi 42, 372–375 [DOI] [PubMed] [Google Scholar]
- 21. Comper F., Antonello D., Beghelli S., Gobbo S., Montagna L., Pederzoli P., Chilosi M., Scarpa A. (2009) Expression pattern of claudins 5 and 7 distinguishes solid-pseudopapillary from pancreatoblastoma, acinar cell and endocrine tumors of the pancreas. Am. J. Surg. Pathol. 33, 768–774 [DOI] [PubMed] [Google Scholar]
- 22. Laje P., Bhatti T. R., Adzick N. S. (2013) Solid pseudopapillary neoplasm of the pancreas in children: a 15-year experience and the identification of a unique immunohistochemical marker. J. Pediatr. Surg. 48, 2054–2060 [DOI] [PubMed] [Google Scholar]
- 23. Yang M., Sun H., Wang H., Zhang S., Yu X., Zhang L. (2013) Down-regulation of ribosomal protein L22 in non-small cell lung cancer. Med. Oncol. 30, 646. [DOI] [PubMed] [Google Scholar]
- 24. Choesmel V., Bacqueville D., Rouquette J., Noaillac-Depeyre J., Fribourg S., Cretien A., Leblanc T., Tchernia G., Da Costa L., Gleizes P. E. (2007) Impaired ribosome biogenesis in Diamond-Blackfan anemia. Blood 109, 1275–1283 [DOI] [PMC free article] [PubMed] [Google Scholar]
- 25. Kelly E., Greene C. M., Carroll T. P., McElvaney N. G., O'Neill S. J. (2009) Selenoprotein S/SEPS1 modifies endoplasmic reticulum stress in Z variant alpha1-antitrypsin deficiency. J. Biol. Chem. 284, 16891–16897 [DOI] [PMC free article] [PubMed] [Google Scholar]
- 26. Forman M. S., Lee V. M., Trojanowski J. Q. (2003) 'Unfolding' pathways in neurodegenerative disease. Trends Neurosci. 26, 407–410 [DOI] [PubMed] [Google Scholar]
- 27. Gow A., Sharma R. (2003) The unfolded protein response in protein aggregating diseases. Neuromolecular Med. 4, 73–94 [DOI] [PubMed] [Google Scholar]
- 28. Schroder M., Kaufman R. J. (2005) ER stress and the unfolded protein response. Mutat. Res. 569, 29–63 [DOI] [PubMed] [Google Scholar]
- 29. Yoshida H. (2007) ER stress and diseases. FEBS J. 274, 630–658 [DOI] [PubMed] [Google Scholar]
- 30. Gross E., Kastner D. B., Kaiser C. A., Fass D. (2004) Structure of Ero1p, source of disulfide bonds for oxidative protein folding in the cell. Cell 117, 601–610 [DOI] [PubMed] [Google Scholar]
- 31. Bhamidipati A., Denic V., Quan E. M., Weissman J. S. (2005) Exploration of the topological requirements of ERAD identifies Yos9p as a lectin sensor of misfolded glycoproteins in the ER lumen. Mol. Cell 19, 741–751 [DOI] [PubMed] [Google Scholar]
- 32. Buschhorn B. A., Kostova Z., Medicherla B., Wolf D. H. (2004) A genome-wide screen identifies Yos9p as essential for ER-associated degradation of glycoproteins. FEBS Lett. 577, 422–426 [DOI] [PubMed] [Google Scholar]
- 33. Szathmary R., Bielmann R., Nita-Lazar M., Burda P., Jakob C. A. (2005) Yos9 protein is essential for degradation of misfolded glycoproteins and may function as lectin in ERAD. Mol. Cell 19, 765–775 [DOI] [PubMed] [Google Scholar]
- 34. Kim S. A., Kim M. S., Kim M. S., Kim S. C., Choi J., Yu E., Hong S. M. (2014) Pleomorphic solid pseudopapillary neoplasm of the pancreas: degenerative change rather than high-grade malignant potential. Hum. Pathol. 45, 166–174 [DOI] [PubMed] [Google Scholar]
Associated Data
This section collects any data citations, data availability statements, or supplementary materials included in this article.