

Abstract
Glioblastoma multiforme is a highly invasive and aggressive brain tumor with an invariably poor prognosis. The overexpression of epidermal growth factor receptor (EGFR) is a primary influencer of invasion and proliferation in tumor cells and the constitutively active EGFRvIII mutant, found in 30–65% of Glioblastoma multiforme, confers more aggressive invasion. To better understand how EGFR contributes to tumor aggressiveness, we investigated the effect of EGFR on the secreted levels of 65 rationally selected proteins involved in invasion. We employed selected reaction monitoring targeted mass spectrometry using stable isotope labeled internal peptide standards to quantity proteins in the secretome from five GBM (U87) isogenic cell lines in which EGFR, EGFRvIII, and/or PTEN were expressed. Our results show that cell lines with EGFR overexpression and constitutive EGFRvIII expression differ remarkably in the expression profiles for both secreted and intracellular signaling proteins, and alterations in EGFR signaling result in reproducible changes in concentrations of secreted proteins. Furthermore, the EGFRvIII-expressing mutant cell line secretes the majority of the selected invasion-promoting proteins at higher levels than other cell lines tested. Additionally, the intracellular and extracellular protein measurements indicate elevated oxidative stress in the EGFRvIII-expressing cell line. In conclusion, the results of our study demonstrate that EGFR signaling has a significant effect on the levels of secreted invasion-promoting proteins, likely contributing to the aggressiveness of Glioblastoma multiforme. Further characterization of these proteins may provide candidates for new therapeutic strategies and targets as well as biomarkers for this aggressive disease.
Glioblastoma multiforme (GBM)1 is the most frequently occurring glioma in adults (1, 2). Hallmarks of GBM include aggressive proliferation, extensive angiogenesis, and chemoresistance (3) resulting in poor prognosis with a median survival of 15 months (4). The current standard of care includes surgical resection of the tumor followed by concomitant temazolamide treatment and radiotherapy. The short survival period clearly demonstrates the need for better therapeutic strategies predicated on a more complete understanding of glioma biology, including genomic, proteomic, and signaling mechanisms.
Large-scale studies including genome sequencing and histopathological studies in higher-grade gliomas have revealed a dysfunctional epidermal growth factor receptor (EGFR) signaling pathway in 35–55% of cases (5–8). The EGFR (wtEGFR) pathway regulates a multitude of cellular responses including cell division, migration, apoptosis, and differentiation (9). The EGFR protein has an extracellular, intracellular, and trans-membrane domain. The extracellular domain receives the ligand, and forms a homo or heterodimer with EGFR family members (10–12). Receptor dimerization activates a signaling cascade that includes kinases, leading to phosphorylation of specific tyrosine residues of the EGFR intracellular domain (13). Receptor phosphorylation enables recruitment of multiple Src homology 2 (SH2) domains and initiates various signaling cascades including phosphoinositide 3-kinase (PI3K), mitogen-activated proteins kinase (MAPK), and multiple signal transducer and activator of transcription (STAT) proteins (11, 12). Activation of these signaling cascades leads to a multitude of cellular responses (9) and subsequently signal gets deactivated through internalization of the receptor, dephosphorylation, and finally, degradation of the EGFR protein (14). All steps in the EGFR network are tightly regulated and dysregulation of this signaling cascade can contribute to tumor initiation and progression, as well as to deleterious tumor characteristics such as aggressive proliferation (15) and therapeutic resistance.
Dysregulation of the EGFR signaling cascade can be caused by EGFR hyperactivity, which can result from genomic amplification (16), over-expression of EGFR, increased translation of the EGFR mRNA (17), increased abundance of associated ligands (17, 18), or mutations in EGFR that cause constitutive activity (7, 15, 16, 19–21). In GBM, dysregulation of the EGFR pathway plays a critical role in tumor initiation and progression. Multiple genomic copies of EGFR have been observed in 40–70% of primary GBMs (22). Overexpression of EGFR can result in an autocrine loop where glioma cells produce ligands such as EGF and transforming growth factor-α (TGF-α), which constitutively activate signaling cascades (23). Multiple mutations in the extracellular domain of EGFR protein have also been observed in GBM (7, 24–26). The most common and best-studied mutation is the type III variant (EGFRvIII) with a deletion of exons 2 to 7 (25). This in-frame deletion of 267 amino acids removes the ligand-binding domain of the EGFR protein, encoding a mutant protein with ligand-independent constitutive activity (27). Although EGFR and EGFRvIII utilize the same signaling domain, their signaling cascades are quantitatively and qualitatively different (27–31). EGFRvIII has defective internalization as compared with wtEGFR, which results in constitutive localization of the mutant to the membrane. This defect produces sustained and unmitigated EGFRvIII signaling (31, 32). EGFRvIII expression has been correlated with poor prognosis (33, 34), as well as with increased proliferation, angiogenesis, and reduced apoptosis (35, 36). Interestingly, expression of EGFRvIII alone is insufficient for tumorogenesis; it requires co-expression of one or more oncogenic genes, or the loss of tumor suppressor genes, for tumor formation (36–38).
In ∼25% of GBMs, overexpression of EGFR is accompanied by expression of EGFRvIII (7, 8, 39, 40), whereas ∼50% of GBMs have a deletion of the tumor suppressor gene PTEN (phosphatase and tensin homolog for chromosome 10 (41)). PTEN negatively regulates PI3K/Akt-mediated signaling pathways, which have been implicated in tumorogenesis (42), cell survival, proliferation, and metabolism (43, 44). EGFR and EGFRvIII activate the PI3K/Akt pathway in GBM, and in the absence of PTEN activity, the balance is shifted toward cell survival, angiogenesis, migration, and proliferation, leading to aggressive tumor growth.
The aggressive and diffuse growth of GBM tumors presents a major impediment to effective therapeutic intervention (45). In the case of glioma, a single cell has the ability to invade through the brain parenchyma, though the cells are not seen to metastasize outside of the brain (46–48). Invasion has been described as a complex behavior acquired by tumor cells which includes three steps: 1) detachment of tumor cells; 2) adherence to the extracellular matrix (ECM); and 3) tumor cell migration into the neighboring tissue (49). The EGFR signaling pathway has been shown to play a major role in the invasiveness of glioma cells by regulating the phosphorylation levels and expression of downstream intracellular signaling proteins (50). Here we present a first comprehensive quantitative study of the effects of EGFR signaling on the levels of secreted proteins involved in invasion in GBM using selected reaction monitoring (SRM), a targeted quantitative mass spectrometry technique.
To better understand the effects of EGFR signaling on the secreted levels of invasion-promoting proteins in GBM, we used discovery “shotgun” proteomics to identify proteins for subsequent analysis by SRM to assess protein levels in the secretome of five glioblastoma U87 cell lines with genetic alterations in EGFR signaling. The secretome most likely included a small percentage of proteins that are shed from the cell membranes in addition to a larger percentage of proteins secreted by cells.
Using shotgun proteomics, we profiled the secreted proteome of the U87 (GBM) cell line, which does not express either EGFR or PTEN, and three additional U87 cell lines with the following genetic alterations; U87 with EGFR expression (+EGFR), U87 with PTEN expression (+PTEN), and U87 with expression of both EGFR and PTEN (+PE). Functional analysis of the secretome profiles of these cell lines revealed a preponderance of proteins involved in cellular invasion. A list of 65 proteins was then selected for quantitation by SRM (Fig. 1). For the quantitative proteomic analysis of the selected proteins, we added an additional cell line relevant to glioma invasion, the U87MG cell line expressing the constitutively active EGFRvIII mutant (+EGFRvIII). In a GBM tumor, EGFRvIII expression is often accompanied by EGFR overexpression. Therefore, an analysis of the secreted proteins will reveal how these two different alterations (EGFR overexpression and EGFR constitutive activity) contribute to levels of secreted proteins from tumor cells.
Fig. 1.

This schema presents the overall strategy employed for identifying the effect of EGFR alterations on the secreted profile of the model cell lines.
Our results demonstrate that GBM-relevant alterations in the EGFR pathway distinctly change the secreted profile of invasion promoting proteins as well as the expression and phosphorylation status of intracellular proteins. The U87MG cell line carrying the EGFRVIII mutation (+EGFRvIII) has a highly invasive, metastatic and angiogenic profile that is remarkably different from the EGFR carrying cell line. Additionally, levels of intracellular and secreted proteins clearly showed that EGFRvIII carrying cells are functioning under higher oxidative stress. Findings of this study can potentially reveal new individual or multiple drug targets, which can be targeted to suppress invasion in GBM leading to cleaner surgical resection and reduced recurrence.
MATERIALS AND METHODS
Cell Culture
The U87 cell lines were grown in 80 cm2 flasks (NunclonTM Delta surface coating, Thermo Fisher Scientific, Waltham, MA, Cat. 178905) under standard conditions in DMEM (Invitrogen, Carlsbad, CA) supplemented with 10% fetal bovine serum (HyClone, GE Healthcare, Logan, UT), l-glutamine, HEPES and 1% penicillin/streptomycin (Invitrogen, Grand Island, NY). The number of starting cells was adjusted so that all cell lines reached confluence at the same time and resulted in nearly the same number of cells (∼6 × 10⁶ cells) at the time of secretome harvest. At 80% confluence, standard media was replaced with serum-free media containing all the supplements except the fetal bovine serum. After 24 h, the media was collected and spun at 1000 rpm for 5 min to remove the cell debris and collect the supernatant. At the time of media collection, cell viability was checked with trypan blue and any cell culture plates with >5% dead cells were discarded and no media was collected. For protein precipitation, three volumes of ice-cold acetone were added to the supernatant, vortexed, and stored at −20°C overnight. Next day, the mixture was centrifuged at 10,000 rpm for 10 min. The resulting precipitate was dissolved in fresh 6 M urea/2 M thiourea solution and stored at −80°C.
Shotgun Proteomics
Trypsin Digestion
25 μg of protein was dissolved in 6 M urea/2 M thiourea, reduced in 5 Mm dithiothreitol for 45 min at 60°C, alkylated in 15 mm iodoacetamide for 30 min at room temperature in the dark, diluted 10-fold with 25 Mm ammonium bicarbonate, and then digested using sequencing grade trypsin (Promega, Madison, WI) at a ratio of 1:30 by weight at 37°C overnight. Next day, the sample was acidified with acetic acid to stop the proteolytic reaction.
SCX Chromatography
The tryptic digest was lyophilized in a vacuum concentrator (Jouan, Winchester, VA), diluted in strong cation exchange (SCX) mobile phase A (25 mm ammonium formate and 25% acetonitrile (ACN), pH 2.5) and pH was lowered for the mixture to 2.5 with formic acid (FA). The acidified sample was fractionated on a PolySulfoethylA column (100 mm × 2.1 mm, 5 μm 300 Å, PolyLC, The Nest Group, Southborough, MA) connected to an HP 1100 HPLC system (Agilent Technologies, Santa Clara, CA) using a 75 min linear gradient at a flow rate of 0.15 ml/min with mobile phases starting from 98% mobile phase A to 100% mobile phase B (800 Mm ammonium formate and 25% ACN, pH 5.8). For each sample, 24 3-min fractions were collected and chromatograms were monitored at 280 nm wavelength. Fractions were pooled into 13 fractions based on the chromatogram from UV absorption with pooling of fractions with lower signal. Fractions were lyophilized and stored at −80 °C until further analysis.
Liquid Chromatography Electrospray Ionization Tandem Mass Spectrometry (LC-MS/MS)
Shotgun LC-MS/MS was performed on a LTQ Orbitrap mass spectrometer (Thermo Scientific, San Jose, CA) coupled to a 1100 binary HPLC pump and autosampler (Agilent Technologies, Santa Clara, CA). SCX fractions were further separated on a Pico Frit C18 column (10 cm, 360 μm OD/75 μm ID, 15 μm tip ID packed with 5 μm ProteoPep II C18 300Å, New Objective, Woburn, MA) using a 110 min gradient from 5–30% ACN in 0.125% FA at a flow rate of 300 nL/min. Data were acquired with the Xcalibur instrument software (Thermo Scientific, San Jose, CA) in a data-dependent mode. Survey full MS scan were acquired in the Orbitrap analyzer and the 15 most abundant ions detected in the full MS scan were fragmented by collision induced dissociation (CID) in the LTQ-orbitrap. MS settings were as follows for MS full scans: AGC 3 × 10⁶, resolution 60,000, m/z range 300–1500, maximum ion time 1000 ms and for MS/MS AGC 5 × 10³, maximum ion time 120 ms, minimum signal threshold 500, isolation width 2 Da, dynamic exclusion 30 s, singly-charged and unassigned ions were excluded. Normalized collision energy was set to 35, and activation time to 20 ms.
MS/MS Data Processing
Raw MS files were converted to mzML using ProteoWizard msconvert (5.1) mzML files were searched using X!Tandem (52) (version 2010.10.01.1) and a UniProt human database (Release 28) with the addition of yeast decoy data (Total sequences - 40,488, decoy sequences - 20,244). In this search, the precursor mass error tolerance was set to ±1 Da, fragment ion tolerance was set to ± 0.5 Da with semi-tryptic peptides with up to two missed cleavages allowed. Carbamidomethylation of cysteines was set as fixed modification and methionine was set as variable modification. Search results were further processed with the Trans-Proteomic Pipeline (53) including PeptideProphet and ProteinProphet (54). Proteins or protein groups above a minimum probability cut off p ≥ 0.9 were selected, corresponding to 80% sensitivity and false positive error rate of 0.7%. Raw files can be accessed in the PeptideAtlas data repository (55) http://www.peptideatlas.org/PASS/PASS00455. ProteinProphet results are available as part of the supplemental data as well as in the repository.
Targeted Quantitative Proteomics
SRM Assays and Heavy Isotopically Labeled Standards
SRM assays were obtained from the SRMAtlas, a resource of complete proteome SRM assays for the identification and quantification of proteins in targeted experiment(56). Although a human SRMAtlas constructed from ion-trap and predicted data is publically available (www.srmatlas.org), in this study, assays from a quadrupole generated human SRMAtlas (Kusebauch et al., in preparation) were used. For the 65 target proteins, three proteotypic tryptic peptides per protein and five transitions per peptide were retrieved from the SRMAtlas along with collision energies. For each peptide sequence the heavy isotopically labeled analog with the C-terminal arginine as R[13C6; 15N4] and lysine as K[13C6; 15N2] was purchased (Product: PEPotec1, Thermo Fisher Scientific) to be used as internal standard. For CDH2, EMILIN-1, CSTL1, ECM1, IGFBP5, SPP1, and TNC only two peptides could be successfully synthesized in the specified quality. Three different internal standard mixtures containing 50 fmoles, 100 fmoles, and 200 fmoles of each peptide were prepared and injected into the mass spectrometer in triplicates (supplemental Fig. S1). The 100 fmoles mixture gave reliable signals for all peptides and was used to spike in the digest as internal standard for the SRM analysis. The observed retention times were used to set up a dynamic SRM method for the secretome samples analysis.
Sample Preparation
Tryptic digests were prepared as described above. 2.5 μg of each digested sample was combined with 100 fmoles of heavy labeled peptides. The samples spiked with standard peptides were desalted on a PEPCLEAN C18 Spin column (Thermo Scientific Pierce) and injected for SRM analysis.
Selected Reaction Monitoring
All SRM analyses were performed on a triple quadrupole (QQQ) mass spectrometer with a ChipCube nanoelectrospray ionization source (Model G6490A, Agilent Technologies, Santa Clara, CA) utilizing a large capacity HPLC chip (G4240–62010, 160 nL trap, 150 mm C18 column, Agilent Technologies, Santa Clara, CA). The mass spectrometer was connected to a 1200 nanoFlow HPLC and 1260 autosampler (Agilent Technologies, Santa Clara, CA). The samples consisting of the tryptic digest and peptide standard were analyzed by a 60-min gradient with a 0.66% per minute ACN slope in the presence of 0.1% FA. Spray voltage was set between 1750V-1900V. Dynamic SRM was performed with a ±4.5 min retention time. The duty cycle was set to 2500 ms and the minimum dwell time for each transition was set to 10 ms. A total of 1880 SRM transitions were monitored for 366 peptides (183 heavy labeled standards and 183 endogenous peptides from the cell secretomes) for each cell line in triplicates. SRM data can be accessed in the PASSEL data repository (55) http://www.peptideatlas.org/PASS/PASS00450.
SRM Data Analysis
The protein expression levels (light to heavy ratio; L/H) were calculated with the publicly available SRM analysis program ‘Skyline’ v1.3(57). After using the Savitzky-Golay method for peak integration, the following criteria were applied for quantifying the peptide: (1) peaks for all transitions of a peptide had identical retention times, (2) out of the three peptides, the peptide with the least coefficient of variation for majority of the cell lines was used to quantify the protein levels and the same peptide was used for each replicate and for every the cell line (supplemental Table S2); (3) peptides with L/H ratio < 0.03 were classified as undetected to remove any variation introduced to peak areas by manual selection of small peaks. Peak areas were calculated by adding the peak areas for all five transitions per peptide.
Immunoblot Analysis
Immunoblot analysis was performed for the selected proteins. 7.5 μg of the total protein was dissolved in 6 M urea/2 M thiourea for each cell line and separated on a 4–15% Mini-PROTEAN TGX gel (Bio-Rad, Hercules, CA) for 25 min at 250V. Samples were transferred to a 0.22 micron FluoroTrans (Pall) PVDF membrane via a semi-dry transfer system (Bio-Rad). Blocking was performed in TBS-T (0.1%) with 2% BSA for 30 min. Proteins were incubated with primary antibodies (Cell Signaling Technology, Danvers, MA) at 4 °C overnight with gentle shaking at 4 °C at optimized dilutions for each antibody (Table I). After washing, anti-rabbit secondary antibody (Cell Signaling Technology, Danvers, MA) was applied at concentration of 1:20,000. Blots were then visualized using the SuperSignal West Femto Maximum Sensitivity Substrate (Thermo Fisher Scientific, CA).
Table I. Dilution of primary antibodies. Table provides antibody name, the Cell Signaling Technology catalogue number and dilution used in the described experiment.
| Antibody | Cat No. | Dilution |
|---|---|---|
| pEGFR | 8808S | 1:8000 |
| PTEN | 9551S | 1:8000 |
| PLCγ_ | 2821S | 1:5000 |
| PI3k (p85) | 4228S | 1:3500 |
| PKcα_ | 2056S | 1:5000 |
| pAkt | 4060S | 1:3500 |
| SHIP2 | 2008S | 1:2000 |
| pSTAT3 | 9914S | 1:4000 |
| Erk1/2 | 4372S | 1:3000 |
| pGAB1 | 3234S | 1:1000 |
| Nrf2 | 12721P | 1:2000 |
| Nqo1 | 3187S | 1:3500 |
RESULTS
Discovery Proteomics Reveals Predominance of Invasion-promoting Proteins in the Secretome of GBM Cell Lines
All cell lines secreted ∼450–500 μg of total proteins/6 × 106 cells. The secreted proteomic profile of the four cell lines (U87 parental, +EGFR, +PTEN, and +PE) revealed a total of 825 identified proteins (Fig. 2), the number of unique secreted proteins was in the range of ∼300 - 450/replicate. Previous studies by Polisetty et al. (58) and Formola et al. (59) also reported a relatively modest number (<150) of secreted proteins from the U87MG cell line when they compared multiple GBM cell lines. The secretome of GBM cells contained proteins implicated in a wide range of functions, with the most prominent functions including wounding, cell death, apoptosis, cytoskeleton organization, cell adhesion, cell motion, angiogenesis, and adherens junction (supplemental Table S1). The +PE cell line had the least number of proteins whereas in the U87 parental cell line the highest number of proteins in the secretome was identified when all cell lines were compared.
Fig. 2.
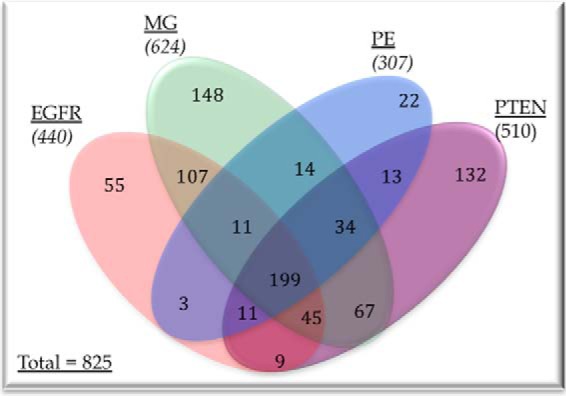
Venn diagram showing the proteins detected in different cell lines as well as showing proteins unique to a cell line or common to multiple cell lines. Names of all the proteins are presented in the supplementary Table S1.
Quantitative Analysis of Secreted Proteins from GBM Cells Reveals Differential Expression According to Alterations in EGFR Signaling
To investigate the effect of EGFR signaling on the secreted levels of proteins implicated in aggressive invasiveness and proliferation of GBM cells, we performed quantitative SRM analysis of selected proteins based on the following stepwise criteria:
Literature support for a role in invasion and regulation by EGFR; a protein was selected if it has been reported to be implicated in tumor invasion and/or to be influenced by EGFR pathway components in the published literature.
In-house RNAseq data; a protein was selected if the gene showed differential mRNA expression in at least one of the cell lines when each cell line with a genetic alteration was compared with the U87MG cell line with no genetic alteration. Preprocessed in-house RNAseq data from all the four cell lines were utilized for identifying differentially expressed genes. Lists of differentially expressed genes for cell line comparisons are presented in supplemental Tables S3–S5.
Discovery proteomics data: a protein was selected for quantitative analysis if the protein was identified in the secretome of at least one cell line. Discovery proteomics presented high confidence protein hits from the secretomes of each of the four cell lines, which were then parsed for presence of proteins.
Applying these filters to each of the 825 identified proteins in the shotgun analysis 65 proteins (Table II) for targeted quantitative analysis by SRM with heavy-isotopically labeled internal peptide standards. A larger set of proteins passed the selection criteria and proteins were further prioritized to accommodate for available resources. All through prioritizing, proteins with strong literature support such as functional assays were selected and emphasis was placed on selecting proteins in such a way that all the three steps (49) of invasion were represented in the selected list for further quantitation. So, the selected list was not a complete list of all invasion-promoting proteins but a representative list of invasion promoting proteins. We also added one more cell line; U87 cells expressing EGFRvIII (+EGFRvIII). Inclusion of the +EGFRvIII cell line provides a quantitative proteomic comparison of alterations resulting from wtEGFR overexpression and EGFRvIII expression. This is relevant because ∼50% of the GBM tumors express wtEGFR along with EGFRvIII expression (39, 40). Cell lines with EGFRvIII and tumors with EGFRvIII have been found to be more aggressive in comparison to those with wtEGFR overexpression. Our quantitative proteomic analysis revealed that these genetic alterations produced very different levels for the proteins involved in cellular invasion, which we will discuss later.
Table II. List of selected proteins with gene names, uniprot IDs, presence in cell lines.
| Gene symbol | Gene name | Uniprot | Cell lines |
|---|---|---|---|
| ADAM10 | Disintegrin and metalloproteinase domain-containing protein 10 | O14672 | EGFR |
| ADAM9 | Disintegrin and metalloproteinase domain-containing protein 9 | Q13443 | MG |
| AGRN | Agrin | O00468 | MG |
| ALCAM | Isoform 1 of CD166 antigen | Q13740 | MG |
| ANXA6 | Annexin A6 | P08133 | EGFR;MG;PE;PTEN |
| CALR | Calreticulin | P27797 | EGFR;MG;PE;PTEN |
| CD44 | CD44 | P16070 | EGFR;MG;PE;PTEN |
| CDH13 | Cadherin-13 | P55290 | EGFR;MG;PE |
| CDH2 | Cadherin2 | P19022 | MG |
| CFL1 | Cofilin-1 | P23528 | EGFR;MG;PE;PTEN |
| CFL2 | Cofilin-2 | Q9Y281 | EGFR;MG;PE;PTEN |
| CHI3L | Chitinase-3-like protein 1 | P36222 | MG;PE;PTEN |
| CST3 | Cystatin-C | P01034 | EGFR;MG;PE;PTEN |
| CTSA | Cathepsin A isoform c precursor | P10619 | MG |
| CTSB | Cathepsin B | P07858 | MG;PE;PTEN |
| CTSD | Cathepsin D | P07339 | EGFR;MG;PE;PTEN |
| CTSL1 | Cathepsin L | P07711 | EGFR;MG;PE;PTEN |
| CXCL1 | Chemokine (C-X-C motif) ligand 1 | P09341 | EGFR;MG;PE;PTEN |
| DAG1 | Dystroglycan | Q14118 | EGFR;MG |
| ECM1 | Isoform 1 of Extracellular matrix protein 1 | Q16610 | MG;PE;PTEN |
| EGFR | EGFR | P00533 | EGFR;PE |
| EMILIN-1 | Elastin microfibril interface-located protein 1 | Q9Y6C2 | MG |
| FBN1 | Fibrillin-1 | P35555 | MG;PE |
| FKSG2 | Putative apoptosis inhibitor FKSG2 | Q9HAU6 | MG |
| FLNA | Isoform 2 of Filamin-A | P21333 | EGFR;MG;PE;PTEN |
| GSN | Gelsolin | P06396 | MG;PE |
| H2AX | H2A.x | P16104 | EGFR;MG;PTEN |
| IGFBP5 | Insulin-like growth factor binding protein | P24593 | MG |
| IGFBP6 | Insulin-like growth factor-binding protein 6 | P24592 | EGFR;MG;PE;PTEN |
| ITGA5 | integrin, alpha 5 (fibronectin receptor, alpha polypeptide) | P08648 | MG |
| ITGA5 | Integrin alpha-5 | P08648 | MG |
| LGALS1 | Galectin-1 | P09382 | EGFR;MG;PE;PTEN |
| MMP1 | Interstitial collagenase | P03956 | EGFR;MG |
| MMP2 | 72 kDa type IV collagenase | P08253 | EGFR;MG;PE;PTEN |
| NRP-1 | Neuropilin-1 | O14786 | MG;PTEN |
| PFN1 | Profilin-1 | P07737 | EGFR;MG;PE;PTEN |
| PLAU | uPA | P00749 | PTEN |
| PLS3 | Plastin-3 | P13797 | PTEN |
| POSTN | Periostin | Q15063 | MG |
| PRDX1 | Peroxiredoxin-1 | Q06830 | EGFR;MG;PE;PTEN |
| PRDX4 | Peroxiredoxin-4 | Q13162 | EGFR;MG;PE;PTEN |
| PRDX6 | Peroxiredoxin-6 | P30041 | MG |
| SBSN | Suprabasin | Q6UWP8 | MG;PE |
| SDC4 | Syndecan 4 | P31431 | EGFR;PE |
| SDCBP2 | Syndecan binding protein (syntenin) | Q9H190 | MG |
| SEMA7A | Semaphorin-7A | O75326 | EGFR;MG;PTEN |
| SERPINB7 | Serpin B7 | O75635 | EGFR;MG |
| SERPINE | Serpin peptidase inhibitor, clade B | P07093 | EGFR;MG;PTEN |
| SERPINE1 | Plasminogen activator inhibitor 1 | P05121 | EGFR;MG;PE;PTEN |
| SPOCK1 | Testican-1 | Q08629 | PE;PTEN |
| SPP1 | Osteopontin | P10451 | MG |
| TF | Serotransferrin | P02787 | EGFR;PE;PTEN |
| TGFBI | Transforming growth factor-beta-induced protein ig-h3 | Q15582 | EGFR;MG;PE;PTEN |
| THBS2 | Thrombospondin-2 | P35442 | MG |
| TIMP1 | Metalloproteinase inhibitor 1 | P01033 | EGFR;MG;PE;PTEN |
| TIMP2 | Metalloproteinase inhibitor 2 | P16035 | EGFR;MG;PE;PTEN |
| TIMP4 | Metalloproteinase inhibitor 4 | Q99727 | MG;PE |
| TLN2 | Talin 2 | Q9Y4G6 | MG |
| TNC | Tenascin | P24821 | EGFR;MG;PE;PTEN |
| VCAN | Veriscan | P13611 | MG;PE;PTEN |
| VCL | Vinculin | P18206 | EGFR;MG |
| VIM | Vimentin | P08670 | EGFR;MG;PE;PTEN |
| VTN | Vitronectin | P04004 | MG;PTEN |
| WISP1 | WNT1-inducible-signaling pathway protein 1 | O95388 | EGFR;MG;PE;PTEN |
| YWHAE | 14–3-3 protein epsilon | P62258 | EGFR;MG;PEPTEN |
Data collection for the selected proteins was performed in triplicate for each of the cell lines. For each protein, three peptides were selected and out of these three, the peptide for which the internal standard had a lower coefficient of variation among the triplicates was selected for quantitation. Out of the 65 selected proteins, 53 proteins (82%) were reliably detected by at least one endogenous peptide in the cell secretome digests. The lack of signal from the undetected proteins in the SRM measurements does not conclusively show that these proteins were absent in the cell secretome. The 12 proteins were detected in the secretome profile of at least one cell line in the discovery proteomics phase, but the identifications were obtained from SCX fractionated samples, whereas for the SRM analysis, total digest was used. The proteins may be below the limit of detection despite the higher sensitivity of SRM. Further, the shotgun identification may have been based on different peptides than used in this targeted SRM analysis and another peptide sequence may have successfully identified the proteins.
A comparison of the expression of selected peptides across cell lines is presented in Fig. 3. Comparing all 53 detected proteins across five cell lines with Kruskal-Wallis one-way analysis revealed that all but three proteins (ITGA5, CDH2, and CALR) were statistically different (p < 0.05) in at least one cell line. For these three proteins, one of the replicates (in at least one cell line) did not detect the heavy standard, leaving a missing value, and thus making the protein levels insignificant.
Fig. 3.

Heat map indicating levels of a single peptide per protein (represented as ProteinName.peptide) in the five cell lines. The proteins are ordered in an ascending order of L/H (analyte/heavy standard) ratios (highest value for each row on the right side of the heatmap). Each row (protein) was scaled individually for all cell lines, red color indicates higher levels of peptide, blue indicates lower levels of peptide and white indicates little or no change. (scale is presented on the top left side of the heatmap). *-represents the replicate where the heavy standards were not detected by the mass spec which could be because of the deviant spray on the mass spec. Bottom: preceding letter represents cell line and following number is the replicate. E = +EGFR; M = U87MG; PE = +PE; PT = +PTEN; V = +EFGRvIII).
EGFR and +EGFRvIII Cell Lines Have Different Protein Abundance Profiles
A total of 43 proteins associated with tumor invasion were detected in the +EGFRvIII cell line (Fig. 3). Of the detected proteins, 40 showed the highest expression in +EGFRvIII compared with other cell lines. The fact that we can see increased expression of invasion-promoting proteins in +EGFRvIII cells correlates well with the observation that EGFRvIII-expressing tumors display higher invasive and proliferative behavior (60). The SRM analysis showed that wtEGFR protein was present at high levels in the +EGFR and +PE cell lines, but was at nondetectable levels in all other cell lines, including +EGFRvIII.
In the +EGFR secretome, 29 proteins were detected, and the CDH2, SERPIN E2, MMP1, and EGFR proteins were detected at the highest level when +EGFR was compared with other cell lines. Comparison of the +EGFR and +EGFRvIII cell lines revealed different sets of proteins with the highest abundance. For example, for MMP1 and MMP2, which are well-studied metalloproteases in GBM and other cancers, +EGFR secreted the highest levels of MMP1 and +EGFRvIII secreted the highest levels of MMP2. Surprisingly, +EGFRvIII secreted no detectible MMP1. All the cell lines expressed high levels of MMP2. We observed the similar pattern when cadherins (N-cadherin and T-cadherin) were compared. N-cadherin was detected in EGFR cells and not in EGFRvIII cells line and T-cadherin was detected at very high levels in EGFRvIII cells and very low level in EGFR cells. Comparing +EGFR and +EGFRvIII cell lines, out of the 50 detected proteins, only two proteins, urokinase-type plasminogen activator (uPA) and fibrillin (FBN1), were present at comparable levels (< 2-fold difference), and all other proteins were either present at very high levels in only one cell line or absent in both the cell lines. The +EGFRvIII secretome profile clearly showed the greatest number of invasion-promoting proteins at generally higher levels, with inhibitors of invasion generally at lower levels. Additionally, SPP1, CD44, PLAU, and Serpin E2, which are proteins that interact to promote invasion and proliferation (61), were present at higher levels in the +EGFRvIII and +EGFR cell lines relative to the non-EGFR-expressing cell lines. TIMPs (tissue inhibitor of metalloproteases) were present at different levels in the cell lines, with TIMP1 present at the highest level in the +EGFRvIII cell line.
PTEN- and PE-expressing Cell Lines had Low Abundance of Invasion-promoting Proteins
For the +PTEN cell line, 35 proteins were detected in the secretome and comparing cell lines, five proteins (TIMP2, WISP1, ITGA5, TF, CHI3L1, and ECM1) were present at the highest levels. Interestingly, CHI3L1 (Chitinase 3-like 1), a secreted glycoprotein, which has been implicated in invasion and cell matrix adhesion (62), was observed at higher levels in the secretome of U87 cells (58, 59) and was present at lower levels in the EGFR- and EGFRvIII-expressing cell lines compared with U87 parental, +PE-and +PTEN-expressing cells. For the +PE cell line, 32 proteins were detected and CTSL1 protein; an endopeptidase inhibitor was present at the highest level.
Twenty-five proteins in the U87 parental cells were detected, including MMP2, SPP1, TIMP1, VNC, CHI3L1, TGFB1, and others. The H2Ax protein, the only DNA damage response protein (63) among the selected proteins for quantitation, was present at the highest level in the U87 parental cells as compared with other cell lines.
Alterations in EGFR Signaling Cause Intracellular Network Perturbations
To identify the components of EGFR signaling that contribute to the observed changes in invasion-related proteins and how intracellular network signaling is influenced by genetic perturbations in the EGFR signaling pathway, we performed immunoblot analysis of nine proteins in the EGFR signaling pathway. We selected these proteins because either expression or phosphorylation states of these proteins has been linked to invasive behavior (49, 64–66).
As expected, the pEGFR (Y1068) antibody showed EGFR expression in the +EGFR, +PE (lower abundance) and +EGFRvIII cell lines, with the truncated EGFRvIII protein displaying its characteristic smaller molecular weight (Fig. 4). Additionally, PTEN expression was only observed in +PE and +PTEN cell lines although the +PTEN cell line had lower abundance of the protein. Phospholipase C subunit γ1 (PLCγ1) with Y783 phosphorylation did not show any expression in parental and +PTEN expressing cell lines and had a low expression in +PE cell line. +EGFR cell line had lower abundance of PLCγ1 and +EGFR cell line had the highest expression. Probing Phosphatidylinositol 3-kinase p85 (Y458), the antibody bound to both p85(Y458) and p55(Y199) sites. The parental cell line did not present p55 subunit and all other cell lines had both bands and +EGFRvIII and +EGFR carrying cell lines had higher levels of both the subunits. Protein kinase C α (PKCα) subunit was present at lower levels in both +EGFR and +EGFRvIII cell lines and higher levels in other cell lines. We also observed higher levels of PI3K (p85) in +EGFRvIII and activation of PI3K (p85) has been demonstrated to signal invasion in GBM (66). Higher abundance of PI3K (p85) and lower abundance of PKCα in the absence of PTEN has been demonstrated to cause the cell to switch from focal adhesion to extracellular-matrix degrading invadopodia formation in head and neck small cell carcinoma (65). Immunoblot analysis of the +EGFRvIII cell line presents a similar pattern suggesting a switch to a more invasive behavior in the signaling cascade. Akt signaling has been associated with a range of cell motility and invasion in a range of cancer types (67). We observed higher levels of pAKt (S473) in +EGFR and +EGFRvIII and lower levels in all the other cell lines. Higher abundance of SH2 (Src homology 2 domain) domain containing inositol 5′-phosphate 2(SHIP2) has been correlated with higher invasive characteristics in cancer (65, 68). However, we did not observe a noticeable difference in SHIP2 with EGFR or EGFRvIII expression. Probing pSTAT3 (Y705) protein clearly showed the influence of +EFGR and +EGFRvIII perturbations on abundance of the protein. +EGFRvIII had the highest level of pSTAT3 and +EGFR had the second highest. The expression of this protein has been correlated with a more invasive profile and poor prognosis (69). Immunoblot analysis of Erk1/2 (p44/42) protein did not show any expression in any cell line, which was an unexpected result because expression of Erk1/2 has been correlated with more aggressive invasion. However, for +EGFRvIII carrying U87MG cell line, our results agree with Huang et al. 's (70) observation, who reported an anti-correlation between Erk1/2 activation and glioma cell growth in this specific cell line.
Fig. 4.
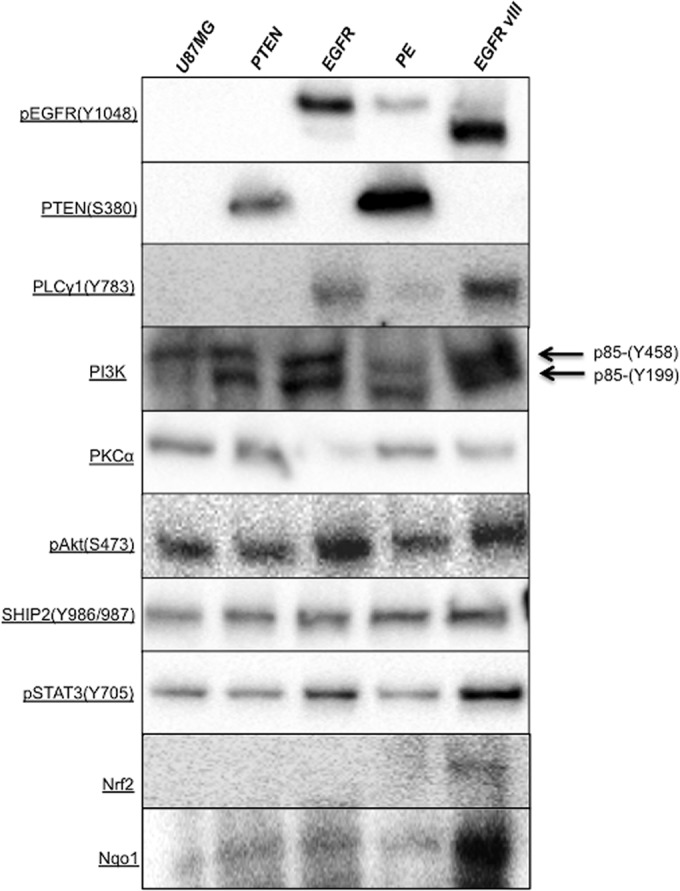
Immunoblot analysis showing different levels of selected protein in the cell lines.
These results confirm that introduction of EGFR signaling proteins influences the expression as well as phosphorylation status of multiple proteins in the EGFR network, resulting in differences in the signaling transduction to the nucleus. The +EGFRvIII cell line shows a more invasive profile as compared with other cell lines that we also observe in the quantitative proteomic analysis.
GBM Cells with EGFRvIII Alteration Have Hyperactive Nrf2 Antioxidant Machinery
Quantitative proteomic analysis suggested higher oxidative stress (higher levels of PRDX1, PRDX4, and CD44) in the GBM cells that had EGFRvIII alteration. To confirm this observation, we measured protein levels of the prominent inducible antioxidant transcription factor Nrf2 (Nuclear factor erythroid 2-related factor 2) and its downstream gene Nqo1 (NAD(P)H dehyrdrogenase [quinoe] 1). Immunoblot analysis showed that the +EGFRvIII carrying cell line had slightly higher expression of Nrf2, however the downstream protein Nqo1, was present at the distinctly higher level in the +EGFRvIII carrying cell line. The higher levels of Nrf2 and Nqo1 clearly suggest that +EGFRvIII mutation puts the cells under higher oxidative stress.
DISCUSSION
In GBM, only 15% of the patients who undergo surgical resection survive beyond 24 months(71). Individual tumor cells invade the local brain parenchyma and escape resection, and can be a source of tumor recurrence leading to high morbidity and mortality (72). Given that components of the EGFR signaling pathway play a critical role in the aggressiveness of GBM cells, we used a quantitative mass spectrometry-based proteomic analysis approach to identify the effects of alterations in the EGFR pathway on intracellular signaling proteins and the secreted levels of proteins that contribute to the invasiveness of GBM. The proteins selected in this study included proteins contributing to all the steps of invasion starting from detachment (EMILIN-1, N-Cadherin, CD44, and TGFB1) to extra cellular matrix (ECM) attachment (ITGA5, TNC, and others) to ECM remodeling (MMP1, MMP2, ADAM9, ADAM10, and others).
The principal finding is that the constitutively active EGFR mutant, EGFRvIII, modulates intracellular signaling to produce a more invasive profile and higher levels of the quantified invasion-promoting secreted proteins. With respect to the functions of proteins that showed differential expression between cells expressing EGFRvIII and those expressing other EGFR alterations, we observed that +EGFRvIII-expressing cells had an abundance of proteins involved in (1) epithelial-mesenchymal transition (EMT); (2) angiogenesis, (3) proteolysis, and (4) oxidative stress, suggesting that these specific protein functions are likely contributing to the aggressive nature of GBM, either through direct promotion of invasion or through other mechanisms.
Proteins Involved in the Epithelial-mesenchymal Transition (EMT) are Most Abundant in EGFRvIII-expressing Cells
Among the proteins detected, shotgun proteomics revealed that there was significant overlap across the cell lines tested. Cells expressing EGFR, and in particular those expressing +EGFRvIII, displayed higher levels of CD44, TGF-β1, and uPA. These receptors play a vital role in the epithelial-mesenchymal transition (EMT), a developmental process by which tumor cells gain migratory and invasive properties through the secretion and activation of proteases such as MMPs. Although the molecular processes underlying EMT are not well understood, a number of proteins have been identified as playing a role in EMT. For example, CD44 has been shown to enhance epithelial-mesenchymal transition in various cancers during metastasis and inhibition of CD44 has been shown to reduce glioma invasion in vivo and in vitro through matrigel matrices (73–75). CD44 is a glycoprotein that recruits ADAM10 to cleave itself and interact with hyaluronic acid and has been reported to co-immunoprecipitate with EGFR in the glioma cell lines U87 and SMA560. Higher expression of CD44 also leads to higher expression of genes such as uPA, PLAU, TIMP1, and cathepsins. The proteomic analyses in this study clearly show the higher levels of these invasion-promoting proteins in the secretome of +EGFRvIII cells, which have also been observed to be more invasive than cells overexpressing EGFR alone (35, 36). Additionally, expression of intracellular signaling proteins such as pSTAT3(76), PI3K (p85), PKCα, and pAKt(65) also support the more invasive profile of EGFRvIII, although mechanistic relationship between invasion promoting proteins and intracellular signaling proteins in GBM needs a detailed investigation.
EGFRvIII-expressing Cells Have an Angiogenic Profile
Several proteins (TIMP1, NRP-1, TNC, and others) implicated in angiogenesis were present at high levels in the secretome of the +EGFRvIII cell line. TIMP1, which facilitates angiogenesis by up-regulating the secretion of vascular endothelial growth factor (VEGF), was detected at the highest level in the +EGFRvIII cell line as well as among all other cell lines in this study. +EGFRvIII is responsible for angiogenesis in several animal glioma models (77–80) and overexpression of EGFR has been reported as the underlying mechanism for nonangiogenic invasive growth (45). So, the presence of TIMP1 at high levels in the +EGFRvIII cell line and lower abundance in the +EGFR cell line is consistent with these findings. Additionally, studies showing the role of TIMPs in invasion and migration conflict, and require further investigation in conjunction with levels and activity of MMPs, cathepsins, and growth factors (81, 82).
In our quantitative analysis, neuropilin-1 (NRP1) and Sema7A were present in all U87 cell lines, with +E(83)GFRvIII secreting the highest levels of these proteins. NRP1 is a receptor for semaphorin and VEGF, and up-regulation of NRP1 leads to angiogenesis and tumor growth (84). The expression of NRP1 in human samples has been correlated with cell migration, adhesion, and angiogenesis (85). Another angiogenic protein, Tenascin (TNC) was observed at very high levels in all cell lines, with +EGFRvIII secreting the highest and the U87 parental cell line secreting the lowest levels. TNC regulates angiogenesis through VEGF expression (86). +EGFRvIII mutants have been observed to be highly invasive with prolific angiogenesis, supportive of the idea that TNC could play a role in +EGFRvIII angiogenesis. Increased TNC expression has been shown to enhance invasion in gliomas (87) and Gaitonde et al. (88) reported strong TNC expression in GBM as compared with low-grade astrocytoma in patients. Remarkably, they also observed strong over-expression of TNC around the walls of hyperplastic blood vessels. Interestingly, we observed higher levels of CDH13 (T-cadherin) in +EGFRvIII secretome. T-cadherin has been observed to be overexpressed in the micro-vessels of tumors and it also stimulates invasion (89). Additionally, it has been observed to play a role in protection against oxidative stress (90). Additionally, +EGFRvIII cell line had higher expression of PI3k especially p85 subunit and pSTAT3, which play critical roles in angiogenesis. VEGFR1 and VEGFR1 bind to PI3k (p85) subunit and regulate angiogenesis in response to activation by EGFR(91) and activated pSTAT3 directly regulates VEGF and controls angiogenesis(83).
Proteases are Highly Expressed in Secretomes of +EGFRvIII U87 Cells
Cathepsins are lysosomal cysteine proteases that have been shown to play a role in tumor invasion and migration (92). They degrade components of the ECM such as laminin and fibronectin (93), activate other proteases such as MMPs and inactivate TIMPs (50, 94). The +EGFRvIII cell line secreted cathepsin A, B, D and L1 (CSTA, CSTB, CSTD, and CSTL1) at higher levels than other cell lines, with CSTL1 as the highest and CSTD as the lowest secreted cysteine protease. These measurements indicate a stronger invasive profile for cells expressing the +EGFRvIII mutant as compared with cells with other alterations in the U87MG cell line.
The levels of metalloproteases MMP1 and MMP2 in the secretomes were particularly interesting; MMP1 was present at low level in the secretome of +EGFRvIII and MMP2 (gelatinase A), an important metalloproteinase, was detected at very high levels in +EGFRvIII as compared with +EGFR and relatively lower levels as compared with U87 parental and +PE cell lines. MMP2, which is up-regulated in GBM, is the most strongly implicated metalloproteinase in glioma invasiveness and is also thought to play a role in neovascularization (95). Our findings agree with recently published results demonstrating that hyaluronic acid-induced MMP2 expression is blocked by EGFR signaling at the mRNA level in +EGFR cells cultured in a 3D matrix (96). TGF-β1 has been shown to induce cell migration and invasion in gliomas (97) by upregulating integrins and MMPs, and down-regulating tissue inhibitor of metalloproteinase-2 (TIMP-2). There was greater MMP1 expression in +EGFR and MMP2 in +EGFRvIII, respectively, and lower levels of TIMP-2 in both cell lines. Interestingly, PAI-1 (plasminogen activator inhibitor 1), an invasion-promoting gene, was only present at high levels in the +EGFR cell line and was not detected in the +EGFRvIII cell line. Kasza et al. (98) and Paugh et al. (98, 99) had reported higher expression of the PAI-1 gene when U373-MG astrocytoma cells were stimulated by EGF. CD44 binds to osteopontin (SPP1) proteins, which leads to enhanced tumorigenesis and invasion (100). SPP1 can enhance or repress invasion, depending on its binding partner; for example, SPP1 binding to CD44 enhances invasion and tumor survival whereas SPP1 binding to integrins leads to cell attachment and extravasation (61). SPP1 was detected at high levels in all the cell lines, with the highest expression in +EGFRvIII cells and the lowest in +PTEN cells. SPP1 can activate mitogen-activated kinases, leading to higher production of MMP2 in various cancers (101). Additionally, a high SPP1 level in the serum has been shown to be a poor prognostic indicator in GBM (102). Another important protein TGF-β1 (Transforming growth factor-β1) was detected in both the +EGFR and +EGFRvIII cells with highest secretion levels in the latter.
ADAM (A disintegrin and metalloprotease) proteins are cell surface glycoproteins that regulate cell-matrix interactions. ADAM9 and ADAM10 have been implicated in invasiveness (59). ADAM9 was not detected in this analysis, and ADAM10 was present in all cell lines and was at highest levels in the +EGFRvIII cells. ADAM10 promotes migration in vitro by playing a role in CDH2 shedding in GBM cells. CDH2 has been reported to play a role in EGFR-dependent migration of glial cells (103). However, CDH2 was only detected at very low levels in the +EGFR and +PE cell lines. This observation is contradictory to results from the study by Formola et al. (59), likely because of the fact that they had grown the U87 cells in conditioned media, whereas cells in our study were grown in DMEM media with 10% FBS. These differences in culture media could contribute toward differences in secretome profiles between studies. CDH13 (T-cadherin) was detected at the highest levels in +EGFRvIII cells, and at low levels in all other U87 cell lines. CDH13, a negative auxiliary suppressor of EGFR (104), has been linked to increased attachment and reduced motility in glioma cells, thus antagonizing cell migration (105). However, Huang et al. (105) suggested a role of T-cadherin in glioma invasion, so the role of CDH13 has been reported to be up-regulated in the tumor vasculature (89).
CHI3L1 is a secreted glycoprotein highly expressed in gliomas that has been shown to increase invasion (59), and elevated levels of CHI3L1 in serum have been associated with poor prognosis (62, 106). All glioma cell lines secreted CHI3L1 protein and surprisingly, both +PE and +PTEN secreted high levels of the glycoprotein indicating PTEN's influence on secretion of CHI3L1. Brennan et al. (107) studied 243 GBM transcriptomic samples from The Cancer Genome Atlas (TCGA) and reported higher CHI3L1 expression associated with low levels of total and phospho-proteins in PI3K and MAPK pathways in the NF1 core (107). We found low levels of PI3K in the +PE and +PTEN cell lines, which agrees with results from Brennan et al. (107). However, the binding partners and mechanism through which CHI3L1 contributes to invasion are not yet known and need further investigation.
EGFRvIII Proteomics Profile Suggests Higher Levels of Oxidative Stress
Oxidative stress has been demonstrated to play a role in tumorigenesis and has been implicated in prolonged activation of EGFR (108). GBM cells with EGFRvIII over-expression have been reported to exhibit higher levels of reactive oxygen species (ROS) (109). EGFRvIII expression enhances resistance to oxidative stress when accompanied with PTEN loss. We observed that +EGFRvIII cells secreted higher levels of peroxiredoxins (1, 4, and 6) (PRDX1, PRDX4, and PRDX6), which reduce oxidative stress. For example, cancer cells lacking PRDX1 produce more ROS and die early (110). Other proteins implicated in invasion and migration such as CD44, CDH13 and MMP2 have also been observed to change in response to oxidative stress (111). Higher levels of PRDXs, CD44, MMP2, and H2AX, prolonged EGF activation and higher expression of pSTAT3 in +EGFRvIII suggests that the regulation of oxidative stress in +EGFRvIII cells might be operating at an elevated level(76). These observations were confirmed by the immunoblot analysis of the Nrf2 and Nqo1. Protein expression of transcription factor Nrf2 did not show a large difference between the cell lines, however Nqo1 was highly overexpressed in +EGFRvIII carrying cell line. Nrf2 responds to higher oxidative stress by translocating to nucleus and turning on the expression of genes such as Nqo1, Hox1, and others. Therefore, expression of Nqo1 is a more reliable indicator of elevated antioxidant response because higher expression of Nrf2 is not required for nuclear translocation of Nrf2. Higher levels of Nrf2 and Nqo1 have been shown to promote tumorigenesis as well as quench higher ROS in the cells (112). The elevated levels of ROS-management components have also shown to contribute to chemotherapy and radiotherapy resistance in EGFRvIII-expressing tumors (9).
CONCLUSIONS
Herein we have presented a quantitative proteomics analysis of the influence of EGFR components on the secreted levels of invasion-promoting proteins of GBM cells. We demonstrate that the intracellular signaling network and the secreted protein levels in GBM cells with EGFRvIII mutation are indicative of a more invasive profile as compared with profiles from other EGFR alterations. Our results indicate that EGFR overexpression and mutant EGFRvIII have different phosphorylation states for intracellular signaling proteins and remarkably distinct invasive proteomic profiles. Given this difference and co-existence of EGFR and EGFRvIII expression in GBM, our findings suggest that targeting multiple but distinct invasion promoting proteins and signaling as a result of both EGFR and EGFRvIII perturbations in a combinatorial fashion might yield better results as compared with targeting individual proteins for invasion reduction in GBM. Additionally, our analysis indicates that EGFRvIII mutant cells are under higher oxidative stress that could lead to a more invasive profile as compared with other EGFR-containing cell lines.
Supplementary Material
Acknowledgments
We would like to thank Dr Julie Bletz for her assistance in preparation of the manuscript.
Footnotes
Author contributions: V.S. and N.D.P. designed research; V.S. and C.C.F. performed research; V.S., U.K., D.S.C., and R.L.M. contributed new reagents or analytic tools; V.S., C.C.F., R.L.M., and N.D.P. analyzed data; V.S., U.K., and N.D.P. wrote the paper.
* This work was supported by the NIH-NCI Howard Temin Pathway to Independence Award in Cancer Research (R00 CA126184), the Luxembourg Centre for Systems Biomedicine and the Camille Dreyfus Teacher-Scholar Program (NDP). It was also supported with federal funds from the American Recovery and Reinvestment Act (ARRA) funds through National Institutes of Health; from the National Human Genome Research Institute grant No. RC2 HG005805, the National Institute of General Medical Sciences under grant No. R01 GM087221 and 2P50 GM076547/Center for Systems Biology, and US Department of Defense (Award # W81XWH-11–1-0487) (to RM).
 This article contains supplemental Fig. S1 and Tables S1 to S5.
1 The abbreviations used are:
- GBM
- glioblastoma multiforme
- EGFR
- epithelial growth factor receptor
- ECM
- extracellular matrix
- SRM
- selected reaction monitoring
- CID
- collision induced dissociation.
REFERENCES
- 1. Ohgaki H., Kleihues P. (2005) Population-based studies on incidence, survival rates, and genetic alterations in astrocytic and oligodendroglial gliomas. J. Neuropathol. Exp. Neurol. 64, 479–489 [DOI] [PubMed] [Google Scholar]
- 2. Ohgaki H., Kleihues P. (2005) Epidemiology and etiology of gliomas. Acta Neuropathol. 109, 93–108 [DOI] [PubMed] [Google Scholar]
- 3. Furnari F. B., Fenton T., Bachoo R. M., Mukasa A., Stommel J. M., Stegh A., Hahn W. C., Ligon K. L., Louis D. N., Brennan C., Chin L., DePinho R. A., Cavenee W. K. (2007) Malignant astrocytic glioma: genetics, biology, and paths to treatment. Genes Dev. 21, 2683–2710 [DOI] [PubMed] [Google Scholar]
- 4. Stupp R., Mason W. P., van den Bent M. J., Weller M., Fisher B., Taphoorn M. J., Belanger K., Brandes A. A., Marosi C., Bogdahn U., Curschmann J., Janzer R. C., Ludwin S. K., Gorlia T., Allgeier A., Lacombe D., Cairncross J. G., Eisenhauer E., Mirimanoff R. O. (2005) Radiotherapy plus concomitant and adjuvant temozolomide for glioblastoma. N. Engl. J. Med. 352, 987–996 [DOI] [PubMed] [Google Scholar]
- 5. Parsons D. W., Jones S., Zhang X., Lin J. C., Leary R. J., Angenendt P., Mankoo P., Carter H., Siu I. M., Gallia G. L., Olivi A., McLendon R., Rasheed B. A., Keir S., Nikolskaya T., Nikolsky Y., Busam D. A., Tekleab H., Diaz L. A., Jr., Hartigan J., Smith D. R., Strausberg R. L., Marie S. K., Shinjo S. M., Yan H., Riggins G. J., Bigner D. D., Karchin R., Papadopoulos N., Parmigiani G., Vogelstein B., Velculescu V. E., Kinzler K. W. (2008) An integrated genomic analysis of human glioblastoma multiforme. Science 321, 1807–1812 [DOI] [PMC free article] [PubMed] [Google Scholar]
- 6. Cancer Genome Atlas Research, N. (2008) Comprehensive genomic characterization defines human glioblastoma genes and core pathways. Nature 455, 1061–1068 [DOI] [PMC free article] [PubMed] [Google Scholar]
- 7. Brennan C. W., Verhaak R. G., McKenna A., Campos B., Noushmehr H., Salama S. R., Zheng S., Chakravarty D., Sanborn J. Z., Berman S. H., Beroukhim R., Bernard B., Wu C. J., Genovese G., Shmulevich I., Barnholtz-Sloan J., Zou L., Vegesna R., Shukla S. A., Ciriello G., Yung W. K., Zhang W., Sougnez C., Mikkelsen T., Aldape K., Bigner D. D., Van Meir E. G., Prados M., Sloan A., Black K. L., Eschbacher J., Finocchiaro G., Friedman W., Andrews D. W., Guha A., Iacocca M., O'Neill B. P., Foltz G., Myers J., Weisenberger D. J., Penny R., Kucherlapati R., Perou C. M., Hayes D. N., Gibbs R., Marra M., Mills G. B., Lander E., Spellman P., Wilson R., Sander C., Weinstein J., Meyerson M., Gabriel S., Laird P. W., Haussler D., Getz G., Chin L., Network T. R. (2013) The somatic genomic landscape of glioblastoma. Cell 155, 462–477 [DOI] [PMC free article] [PubMed] [Google Scholar]
- 8. Frattini V., Trifonov V., Chan J. M., Castano A., Lia M., Abate F., Keir S. T., Ji A. X., Zoppoli P., Niola F., Danussi C., Dolgalev I., Porrati P., Pellegatta S., Heguy A., Gupta G., Pisapia D. J., Canoll P., Bruce J. N., McLendon R. E., Yan H., Aldape K., Finocchiaro G., Mikkelsen T., Prive G. G., Bigner D. D., Lasorella A., Rabadan R., Iavarone A. (2013) The integrated landscape of driver genomic alterations in glioblastoma. Nat. Genet. 45, 1141–1149 [DOI] [PMC free article] [PubMed] [Google Scholar]
- 9. Huang P. H., Xu A. M., White F. M. (2009) Oncogenic EGFR signaling networks in glioma. Sci. Signal. 2, re6. [DOI] [PubMed] [Google Scholar]
- 10. Ferguson K. M., Berger M. B., Mendrola J. M., Cho H. S., Leahy D. J., Lemmon M. A. (2003) EGF activates its receptor by removing interactions that autoinhibit ectodomain dimerization. Mol. Cell 11, 507–517 [DOI] [PubMed] [Google Scholar]
- 11. Citri A., Yarden Y. (2006) EGF-ERBB signalling: towards the systems level. Nat. Rev.. Mol. Cell Biol. 7, 505–516 [DOI] [PubMed] [Google Scholar]
- 12. Yarden Y., Sliwkowski M. X. (2001) Untangling the ErbB signalling network. Nat. Rev.. Mol. Cell Biol. 2, 127–137 [DOI] [PubMed] [Google Scholar]
- 13. Wells A. (1999) EGF receptor. Int. J. Biochem. Cell Biol 31, 637–643 [DOI] [PubMed] [Google Scholar]
- 14. Dikic I. (2003) Mechanisms controlling EGF receptor endocytosis and degradation. Biochem. Soc. Trans. 31, 1178–1181 [DOI] [PubMed] [Google Scholar]
- 15. Verbeek B. S., Adriaansen-Slot S. S., Vroom T. M., Beckers T., Rijksen G. (1998) Overexpression of EGFR and c-erbB2 causes enhanced cell migration in human breast cancer cells and NIH3T3 fibroblasts. FEBS Lett. 425, 145–150 [DOI] [PubMed] [Google Scholar]
- 16. Ekstrand A. J., James C. D., Cavenee W. K., Seliger B., Pettersson R. F., Collins V. P. (1991) Genes for epidermal growth factor receptor, transforming growth factor alpha, and epidermal growth factor and their expression in human gliomas in vivo. Cancer Res. 51, 2164–2172 [PubMed] [Google Scholar]
- 17. Ohgaki H., Kleihues P. (2007) Genetic pathways to primary and secondary glioblastoma. Am. J. Pathol. 170, 1445–1453 [DOI] [PMC free article] [PubMed] [Google Scholar]
- 18. Brat D. J., Shehata B. M., Castellano-Sanchez A. A., Hawkins C., Yost R. B., Greco C., Mazewski C., Janss A., Ohgaki H., Perry A. (2007) Congenital glioblastoma: a clinicopathologic and genetic analysis. Brain Pathol. 17, 276–281 [DOI] [PMC free article] [PubMed] [Google Scholar]
- 19. Kim H. G., Kassis J., Souto J. C., Turner T., Wells A. (1999) EGF receptor signaling in prostate morphogenesis and tumorigenesis. Histol. Histopathol. 14, 1175–1182 [DOI] [PubMed] [Google Scholar]
- 20. Chaffanet M., Chauvin C., Laine M., Berger F., Chedin M., Rost N., Nissou M. F., Benabid A. L. (1992) EGF receptor amplification and expression in human brain tumours. Eur. J. Cancer 28, 11–17 [DOI] [PubMed] [Google Scholar]
- 21. Sharma S. V., Bell D. W., Settleman J., Haber D. A. (2007) Epidermal growth factor receptor mutations in lung cancer. Nat. Rev. Cancer 7, 169–181 [DOI] [PubMed] [Google Scholar]
- 22. Ohgaki H., Dessen P., Jourde B., Horstmann S., Nishikawa T., Di Patre P. L., Burkhard C., Schuler D., Probst-Hensch N. M., Maiorka P. C., Baeza N., Pisani P., Yonekawa Y., Yasargil M. G., Lutolf U. M., Kleihues P. (2004) Genetic pathways to glioblastoma: a population-based study. Cancer Res. 64, 6892–6899 [DOI] [PubMed] [Google Scholar]
- 23. Singh A. B., Harris R. C. (2005) Autocrine, paracrine and juxtacrine signaling by EGFR ligands. Cell. Signal. 17, 1183–1193 [DOI] [PubMed] [Google Scholar]
- 24. Humphrey P. A., Gangarosa L. M., Wong A. J., Archer G. E., Lund-Johansen M., Bjerkvig R., Laerum O. D., Friedman H. S., Bigner D. D. (1991) Deletion-mutant epidermal growth factor receptor in human gliomas: effects of type II mutation on receptor function. Biochem. Biophys. Res. Commun. 178, 1413–1420 [DOI] [PubMed] [Google Scholar]
- 25. Wong A. J., Ruppert J. M., Bigner S. H., Grzeschik C. H., Humphrey P. A., Bigner D. S., Vogelstein B. (1992) Structural alterations of the epidermal growth factor receptor gene in human gliomas. Proc. Natl. Acad. Sci. U. S. A. 89, 2965–2969 [DOI] [PMC free article] [PubMed] [Google Scholar]
- 26. Peschard P., Park M. (2007) From Tpr-Met to Met, tumorigenesis and tubes. Oncogene 26, 1276–1285 [DOI] [PubMed] [Google Scholar]
- 27. Huang H. S., Nagane M., Klingbeil C. K., Lin H., Nishikawa R., Ji X. D., Huang C. M., Gill G. N., Wiley H. S., Cavenee W. K. (1997) The enhanced tumorigenic activity of a mutant epidermal growth factor receptor common in human cancers is mediated by threshold levels of constitutive tyrosine phosphorylation and unattenuated signaling. J. Biol. Chem. 272, 2927–2935 [DOI] [PubMed] [Google Scholar]
- 28. Schmidt M. H., Furnari F. B., Cavenee W. K., Bogler O. (2003) Epidermal growth factor receptor signaling intensity determines intracellular protein interactions, ubiquitination, and internalization. Proc. Natl. Acad. Sci. U. S. A. 100, 6505–6510 [DOI] [PMC free article] [PubMed] [Google Scholar]
- 29. Helin K., Velu T., Martin P., Vass W. C., Allevato G., Lowy D. R., Beguinot L. (1991) The biological activity of the human epidermal growth factor receptor is positively regulated by its C-terminal tyrosines. Oncogene 6, 825–832 [PubMed] [Google Scholar]
- 30. Shao H., Cheng H. Y., Cook R. G., Tweardy D. J. (2003) Identification and characterization of signal transducer and activator of transcription 3 recruitment sites within the epidermal growth factor receptor. Cancer Res. 63, 3923–3930 [PubMed] [Google Scholar]
- 31. Huang P. H., Mukasa A., Bonavia R., Flynn R. A., Brewer Z. E., Cavenee W. K., Furnari F. B., White F. M. (2007) Quantitative analysis of EGFRvIII cellular signaling networks reveals a combinatorial therapeutic strategy for glioblastoma. Proc. Natl. Acad. Sci. U. S. A. 104, 12867–12872 [DOI] [PMC free article] [PubMed] [Google Scholar]
- 32. Mosesson Y., Mills G. B., Yarden Y. (2008) Derailed endocytosis: an emerging feature of cancer. Nat. Rev. Cancer 8, 835–850 [DOI] [PubMed] [Google Scholar]
- 33. Feldkamp M. M., Lala P., Lau N., Roncari L., Guha A. (1999) Expression of activated epidermal growth factor receptors, Ras-guanosine triphosphate, and mitogen-activated protein kinase in human glioblastoma multiforme specimens. Neurosurgery 45, 1442–1453 [DOI] [PubMed] [Google Scholar]
- 34. Nishikawa R., Ji X. D., Harmon R. C., Lazar C. S., Gill G. N., Cavenee W. K., Huang H. J. (1994) A mutant epidermal growth factor receptor common in human glioma confers enhanced tumorigenicity. Proc. Natl. Acad. Sci. U. S. A. 91, 7727–7731 [DOI] [PMC free article] [PubMed] [Google Scholar]
- 35. Nagane M., Coufal F., Lin H., Bogler O., Cavenee W. K., Huang H. J. (1996) A common mutant epidermal growth factor receptor confers enhanced tumorigenicity on human glioblastoma cells by increasing proliferation and reducing apoptosis. Cancer Res. 56, 5079–5086 [PubMed] [Google Scholar]
- 36. Ding H., Shannon P., Lau N., Wu X., Roncari L., Baldwin R. L., Takebayashi H., Nagy A., Gutmann D. H., Guha A. (2003) Oligodendrogliomas result from the expression of an activated mutant epidermal growth factor receptor in a RAS transgenic mouse astrocytoma model. Cancer Res. 63, 1106–1113 [PubMed] [Google Scholar]
- 37. Holland E. C., Hively W. P., DePinho R. A., Varmus H. E. (1998) A constitutively active epidermal growth factor receptor cooperates with disruption of G1 cell-cycle arrest pathways to induce glioma-like lesions in mice. Genes Dev. 12, 3675–3685 [DOI] [PMC free article] [PubMed] [Google Scholar]
- 38. Zhu H., Acquaviva J., Ramachandran P., Boskovitz A., Woolfenden S., Pfannl R., Bronson R. T., Chen J. W., Weissleder R., Housman D. E., Charest A. (2009) Oncogenic EGFR signaling cooperates with loss of tumor suppressor gene functions in gliomagenesis. Proc. Natl. Acad. Sci. U. S. A. 106, 2712–2716 [DOI] [PMC free article] [PubMed] [Google Scholar]
- 39. Frederick L., Eley G., Wang X. Y., James C. D. (2000) Analysis of genomic rearrangements associated with EGRFvIII expression suggests involvement of Alu repeat elements. Neuro Oncol. 2, 159–163 [DOI] [PMC free article] [PubMed] [Google Scholar]
- 40. Sugawa N., Ekstrand A. J., James C. D., Collins V. P. (1990) Identical splicing of aberrant epidermal growth factor receptor transcripts from amplified rearranged genes in human glioblastomas. Proc. Natl. Acad. Sci. U. S. A. 87, 8602–8606 [DOI] [PMC free article] [PubMed] [Google Scholar]
- 41. Wang M. Y., Lu K. V., Zhu S., Dia E. Q., Vivanco I., Shackleford G. M., Cavenee W. K., Mellinghoff I. K., Cloughesy T. F., Sawyers C. L., Mischel P. S. (2006) Mammalian target of rapamycin inhibition promotes response to epidermal growth factor receptor kinase inhibitors in PTEN-deficient and PTEN-intact glioblastoma cells. Cancer Res. 66, 7864–7869 [DOI] [PubMed] [Google Scholar]
- 42. Kolibaba K. S., Druker B. J. (1997) Protein tyrosine kinases and cancer. Biochim. Biophys. Acta 1333, F217–248 [DOI] [PubMed] [Google Scholar]
- 43. Holland E. C., Celestino J., Dai C., Schaefer L., Sawaya R. E., Fuller G. N. (2000) Combined activation of Ras and Akt in neural progenitors induces glioblastoma formation in mice. Nat. Genet. 25, 55–57 [DOI] [PubMed] [Google Scholar]
- 44. Sonoda Y., Ozawa T., Aldape K. D., Deen D. F., Berger M. S., Pieper R. O. (2001) Akt pathway activation converts anaplastic astrocytoma to glioblastoma multiforme in a human astrocyte model of glioma. Cancer Res. 61, 6674–6678 [PubMed] [Google Scholar]
- 45. Talasila K. M., Soentgerath A., Euskirchen P., Rosland G. V., Wang J., Huszthy P. C., Prestegarden L., Skaftnesmo K. O., Sakariassen P. O., Eskilsson E., Stieber D., Keunen O., Brekka N., Moen I., Nigro J. M., Vintermyr O. K., Lund-Johansen M., Niclou S., Mork S. J., Enger P. O., Bjerkvig R., Miletic H. (2013) EGFR wild-type amplification and activation promote invasion and development of glioblastoma independent of angiogenesis. Acta Neuropathol. 125, 683–698 [DOI] [PMC free article] [PubMed] [Google Scholar]
- 46. Burger P. C., Bigner S. H. (1988) Practical approaches to the diagnosis of central nervous system tumors. Mod. Pathol. 1, 493–511 [PubMed] [Google Scholar]
- 47. Scheithauer B. W., Bruner J. M. (1987) Central nervous system tumors. Clin. Lab. Med. 7, 157–179 [PubMed] [Google Scholar]
- 48. Hunter S. B., Brat D. J., Olson J. J., Von Deimling A., Zhou W., Van Meir E. G. (2003) Alterations in molecular pathways of diffusely infiltrating glial neoplasms: application to tumor classification and anti-tumor therapy (Review). Int. J. Oncol. 23, 857–869 [PubMed] [Google Scholar]
- 49. Teodorczyk M., Martin-Villalba A. (2010) Sensing invasion: cell surface receptors driving spreading of glioblastoma. J. Cell. Physiol. 222, 1–10 [DOI] [PubMed] [Google Scholar]
- 50. Tysnes B. B., Mahesparan R. (2001) Biological mechanisms of glioma invasion and potential therapeutic targets. J. Neurooncol. 53, 129–147 [DOI] [PubMed] [Google Scholar]
- 51. Chambers M. C., Maclean B., Burke R., Amodei D., Ruderman D. L., Neumann S., Gatto L., Fischer B., Pratt B., Egertson J., Hoff K., Kessner D., Tasman N., Shulman N., Frewen B., Baker T. A., Brusniak M. Y., Paulse C., Creasy D., Flashner L., Kani K., Moulding C., Seymour S. L., Nuwaysir L. M., Lefebvre B., Kuhlmann F., Roark J., Rainer P., Detlev S., Hemenway T., Huhmer A., Langridge J., Connolly B., Chadick T., Holly K., Eckels J., Deutsch E. W., Moritz R. L., Katz J. E., Agus D. B., MacCoss M., Tabb D. L., Mallick P. (2012) A cross-platform toolkit for mass spectrometry and proteomics. Nat, Biotechnol. 30, 918–920 [DOI] [PMC free article] [PubMed] [Google Scholar]
- 52. Craig R., Beavis R. C. (2004) TANDEM: matching proteins with tandem mass spectra. Bioinformatics 20, 1466–1467 [DOI] [PubMed] [Google Scholar]
- 53. Keller A., Eng J., Zhang N., Li X. J., Aebersold R. (2005) A uniform proteomics MS/MS analysis platform utilizing open XML file formats. Mol. Syst. Biol. 1, 2005 0017 [DOI] [PMC free article] [PubMed] [Google Scholar]
- 54. Nesvizhskii A. I., Keller A., Kolker E., Aebersold R. (2003) A statistical model for identifying proteins by tandem mass spectrometry. Anal. Chem. 75, 4646–4658 [DOI] [PubMed] [Google Scholar]
- 55. Farrah T., Deutsch E. W., Kreisberg R., Sun Z., Campbell D. S., Mendoza L., Kusebauch U., Brusniak M. Y., Huttenhain R., Schiess R., Selevsek N., Aebersold R., Moritz R. L. (2012) PASSEL: the PeptideAtlas SRMexperiment library. Proteomics 12, 1170–1175 [DOI] [PMC free article] [PubMed] [Google Scholar]
- 56. Kusebauch U., Deutsch EW., Campbell DS., Sun Z., Farrah T., Moritz RL. (2014) Using PeptideAtlas, SRMAtlas and PASSEL – Comprehensive resources for discovery and targeted proteomics. Curr. Protoc. Bioinformatics in press [DOI] [PMC free article] [PubMed] [Google Scholar]
- 57. MacLean B., Tomazela D. M., Shulman N., Chambers M., Finney G. L., Frewen B., Kern R., Tabb D. L., Liebler D. C., MacCoss M. J. (2010) Skyline: an open source document editor for creating and analyzing targeted proteomics experiments. Bioinformatics 26, 966–968 [DOI] [PMC free article] [PubMed] [Google Scholar]
- 58. Polisetty R. V., Gupta M. K., Nair S. C., Ramamoorthy K., Tiwary S., Shiras A., Chandak G. R., Sirdeshmukh R. (2011) Glioblastoma cell secretome: analysis of three glioblastoma cell lines reveal 148 non-redundant proteins. J. Proteomics 74, 1918–1925 [DOI] [PubMed] [Google Scholar]
- 59. Formolo C. A., Williams R., Gordish-Dressman H., MacDonald T. J., Lee N. H., Hathout Y. (2011) Secretome signature of invasive glioblastoma multiforme. J. Proteome Res. 10, 3149–3159 [DOI] [PMC free article] [PubMed] [Google Scholar]
- 60. Micallef J., Taccone M., Mukherjee J., Croul S., Busby J., Moran M. F., Guha A. (2009) Epidermal growth factor receptor variant III-induced glioma invasion is mediated through myristoylated alanine-rich protein kinase C substrate overexpression. Cancer Res. 69, 7548–7556 [DOI] [PubMed] [Google Scholar]
- 61. Rangaswami H., Bulbule A., Kundu G. C. (2006) Osteopontin: role in cell signaling and cancer progression. Trends Cell Biol. 16, 79–87 [DOI] [PubMed] [Google Scholar]
- 62. Ku B. M., Lee Y. K., Ryu J., Jeong J. Y., Choi J., Eun K. M., Shin H. Y., Kim D. G., Hwang E. M., Yoo J. C., Park J. Y., Roh G. S., Kim H. J., Cho G. J., Choi W. S., Paek S. H., Kang S. S. (2011) CHI3L1 (YKL-40) is expressed in human gliomas and regulates the invasion, growth and survival of glioma cells. Int. J. Cancer 128, 1316–1326 [DOI] [PubMed] [Google Scholar]
- 63. Muslimovic A., Ismail I. H., Gao Y., Hammarsten O. (2008) An optimized method for measurement of gamma-H2AX in blood mononuclear and cultured cells. Nat. Protoc. 3, 1187–1193 [DOI] [PubMed] [Google Scholar]
- 64. Mebratu Y., Tesfaigzi Y. (2009) How ERK1/2 activation controls cell proliferation and cell death: Is subcellular localization the answer? Cell Cycle 8, 1168–1175 [DOI] [PMC free article] [PubMed] [Google Scholar]
- 65. Hoshino D., Jourquin J., Emmons S. W., Miller T., Goldgof M., Costello K., Tyson D. R., Brown B., Lu Y., Prasad N. K., Zhang B., Mills G. B., Yarbrough W. G., Quaranta V., Seiki M., Weaver A. M. (2012) Network analysis of the focal adhesion to invadopodia transition identifies a PI3K-PKCalpha invasive signaling axis. Sci. Signal. 5, ra66. [DOI] [PMC free article] [PubMed] [Google Scholar]
- 66. Kleber S., Sancho-Martinez I., Wiestler B., Beisel A., Gieffers C., Hill O., Thiemann M., Mueller W., Sykora J., Kuhn A., Schreglmann N., Letellier E., Zuliani C., Klussmann S., Teodorczyk M., Grone H. J., Ganten T. M., Sultmann H., Tuttenberg J., von Deimling A., Regnier-Vigouroux A., Herold-Mende C., Martin-Villalba A. (2008) Yes and PI3K bind CD95 to signal invasion of glioblastoma. Cancer Cell 13, 235–248 [DOI] [PubMed] [Google Scholar]
- 67. Kitamura T., Asai N., Enomoto A., Maeda K., Kato T., Ishida M., Jiang P., Watanabe T., Usukura J., Kondo T., Costantini F., Murohara T., Takahashi M. (2008) Regulation of VEGF-mediated angiogenesis by the Akt/PKB substrate Girdin. Nat. Cell Biol. 10, 329–337 [DOI] [PubMed] [Google Scholar]
- 68. Prasad N., Topping R. S., Decker S. J. (2002) Src family tyrosine kinases regulate adhesion-dependent tyrosine phosphorylation of 5′-inositol phosphatase SHIP2 during cell attachment and spreading on collagen I. J. Cell Sci. 115, 3807–3815 [DOI] [PubMed] [Google Scholar]
- 69. Luwor R. B., Stylli S. S., Kaye A. H. (2013) The role of Stat3 in glioblastoma multiforme. J. Clin. Neurosci. 20, 907–911 [DOI] [PubMed] [Google Scholar]
- 70. Huang P. H., Miraldi E. R., Xu A. M., Kundukulam V. A., Del Rosario A. M., Flynn R. A., Cavenee W. K., Furnari F. B., White F. M. (2010) Phosphotyrosine signaling analysis of site-specific mutations on EGFRvIII identifies determinants governing glioblastoma cell growth. Mol. Biosyst. 6, 1227–1237 [DOI] [PMC free article] [PubMed] [Google Scholar]
- 71. Stupp R., Hegi M. E., Mason W. P., van den Bent M. J., Taphoorn M. J., Janzer R. C., Ludwin S. K., Allgeier A., Fisher B., Belanger K., Hau P., Brandes A. A., Gijtenbeek J., Marosi C., Vecht C. J., Mokhtari K., Wesseling P., Villa S., Eisenhauer E., Gorlia T., Weller M., Lacombe D., Cairncross J. G., Mirimanoff R. O., European Organisation for, R., Treatment of Cancer Brain, T., Radiation Oncology, G., National Cancer Institute of Canada Clinical Trials, G. (2009) Effects of radiotherapy with concomitant and adjuvant temozolomide versus radiotherapy alone on survival in glioblastoma in a randomised phase III study: 5-year analysis of the EORTC-NCIC trial. Lancet Oncol. 10, 459–466 [DOI] [PubMed] [Google Scholar]
- 72. Berens M. E., Rutka J. T., Rosenblum M. L. (1990) Brain tumor epidemiology, growth, and invasion. Neurosurg. Clin. N. Am. 1, 1–18 [PubMed] [Google Scholar]
- 73. Okamoto I., Kawano Y., Matsumoto M., Suga M., Kaibuchi K., Ando M., Saya H. (1999) Regulated CD44 cleavage under the control of protein kinase C, calcium influx, and the Rho family of small G proteins. J. Biol. Chem. 274, 25525–25534 [DOI] [PubMed] [Google Scholar]
- 74. Okamoto I., Kawano Y., Tsuiki H., Sasaki J., Nakao M., Matsumoto M., Suga M., Ando M., Nakajima M., Saya H. (1999) CD44 cleavage induced by a membrane-associated metalloprotease plays a critical role in tumor cell migration. Oncogene 18, 1435–1446 [DOI] [PubMed] [Google Scholar]
- 75. Gunia S., Hussein S., Radu D. L., Putz K. M., Breyer R., Hecker H., Samii M., Walter G. F., Stan A. C. (1999) CD44s-targeted treatment with monoclonal antibody blocks intracerebral invasion and growth of 9L gliosarcoma. Clin. Exp. Metastasis 17, 221–230 [DOI] [PubMed] [Google Scholar]
- 76. Sarafian T. A., Montes C., Imura T., Qi J., Coppola G., Geschwind D. H., Sofroniew M. V. (2010) Disruption of astrocyte STAT3 signaling decreases mitochondrial function and increases oxidative stress in vitro. PloS One 5, e9532. [DOI] [PMC free article] [PubMed] [Google Scholar]
- 77. Bonavia R., Inda M. M., Vandenberg S., Cheng S. Y., Nagane M., Hadwiger P., Tan P., Sah D. W., Cavenee W. K., Furnari F. B. (2012) EGFRvIII promotes glioma angiogenesis and growth through the NF-kappaB, interleukin-8 pathway. Oncogene 31, 4054–4066 [DOI] [PMC free article] [PubMed] [Google Scholar]
- 78. Clarke K., Smith K., Gullick W. J., Harris A. L. (2001) Mutant epidermal growth factor receptor enhances induction of vascular endothelial growth factor by hypoxia and insulin-like growth factor-1 via a PI3 kinase dependent pathway. Br. J. Cancer 84, 1322–1329 [DOI] [PMC free article] [PubMed] [Google Scholar]
- 79. Magnus N., Garnier D., Rak J. (2010) Oncogenic epidermal growth factor receptor up-regulates multiple elements of the tissue factor signaling pathway in human glioma cells. Blood 116, 815–818 [DOI] [PubMed] [Google Scholar]
- 80. Westermark B., Magnusson A., Heldin C. H. (1982) Effect of epidermal growth factor on membrane motility and cell locomotion in cultures of human clonal glioma cells. J. Neurosci. Res. 8, 491–507 [DOI] [PubMed] [Google Scholar]
- 81. Lee S., Desai K. K., Iczkowski K. A., Newcomer R. G., Wu K. J., Zhao Y. G., Tan W. W., Roycik M. D., Sang Q. X. (2006) Coordinated peak expression of MMP-26 and TIMP-4 in preinvasive human prostate tumor. Cell Res. 16, 750–758 [DOI] [PubMed] [Google Scholar]
- 82. Hernandez-Barrantes S., Shimura Y., Soloway P. D., Sang Q. A., Fridman R. (2001) Differential roles of TIMP-4 and TIMP-2 in pro-MMP-2 activation by MT1-MMP. Biochem. Biophys. Res. Commun. 281, 126–130 [DOI] [PubMed] [Google Scholar]
- 83. Niu G., Wright K. L., Huang M., Song L., Haura E., Turkson J., Zhang S., Wang T., Sinibaldi D., Coppola D., Heller R., Ellis L. M., Karras J., Bromberg J., Pardoll D., Jove R., Yu H. (2002) Constitutive Stat3 activity up-regulates VEGF expression and tumor angiogenesis. Oncogene 21, 2000–2008 [DOI] [PubMed] [Google Scholar]
- 84. Hu B., Guo P., Bar-Joseph I., Imanishi Y., Jarzynka M. J., Bogler O., Mikkelsen T., Hirose T., Nishikawa R., Cheng S. Y. (2007) Neuropilin-1 promotes human glioma progression through potentiating the activity of the HGF/SF autocrine pathway. Oncogene 26, 5577–5586 [DOI] [PMC free article] [PubMed] [Google Scholar]
- 85. Bernhardtsen T., Laursen H., Bojsen-Moller M., Gjerris F. (2003) Sub-classification of low-grade cerebellar astrocytoma: is it clinically meaningful? Child's Nerv. Syst. 19, 729–735 [DOI] [PubMed] [Google Scholar]
- 86. Tanaka K., Hiraiwa N., Hashimoto H., Yamazaki Y., Kusakabe M. (2004) Tenascin-C regulates angiogenesis in tumor through the regulation of vascular endothelial growth factor expression. Int. J. Cancer 108, 31–40 [DOI] [PubMed] [Google Scholar]
- 87. Sarkar S., Nuttall R. K., Liu S., Edwards D. R., Yong V. W. (2006) Tenascin-C stimulates glioma cell invasion through matrix metalloproteinase-12. Cancer Research 66, 11771–11780 [DOI] [PubMed] [Google Scholar]
- 88. Gaitonde P S, R. M. J., Dastur R S, Bhagwati S N, Nadkarni J J. (2005) EPIDERMAL GROWTH FACTOR RECEPTOR AND TENASCIN EXPRESSION IN ASTROCYTIC GLIOMAS. Ann. Neurosci. 12 [Google Scholar]
- 89. Berx G., van Roy F. (2009) Involvement of members of the cadherin superfamily in cancer. Cold Spring Harb. Perspect. Biol. 1, a003129. [DOI] [PMC free article] [PubMed] [Google Scholar]
- 90. Philippova M., Banfi A., Ivanov D., Gianni-Barrera R., Allenspach R., Erne P., Resink T. (2006) Atypical GPI-anchored T-cadherin stimulates angiogenesis in vitro and in vivo. Arterioscler. Thromb. Vasc. Biol. 26, 2222–2230 [DOI] [PubMed] [Google Scholar]
- 91. Autiero M., Waltenberger J., Communi D., Kranz A., Moons L., Lambrechts D., Kroll J., Plaisance S., De Mol M., Bono F., Kliche S., Fellbrich G., Ballmer-Hofer K., Maglione D., Mayr-Beyrle U., Dewerchin M., Dombrowski S., Stanimirovic D., Van Hummelen P., Dehio C., Hicklin D. J., Persico G., Herbert J. M., Communi D., Shibuya M., Collen D., Conway E. M., Carmeliet P. (2003) Role of PlGF in the intra- and intermolecular cross talk between the VEGF receptors Flt1 and Flk1. Nat. Med. 9, 936–943 [DOI] [PubMed] [Google Scholar]
- 92. Levicar N., Strojnik T., Kos J., Dewey R. A., Pilkington G. J., Lah T. T. (2002) Lysosomal enzymes, cathepsins in brain tumour invasion. J. Neurooncol. 58, 21–32 [DOI] [PubMed] [Google Scholar]
- 93. Ishidoh K., Kominami E. (1995) Procathepsin L degrades extracellular matrix proteins in the presence of glycosaminoglycans in vitro. Biochem. Biophys. Res. Commun. 217, 624–631 [DOI] [PubMed] [Google Scholar]
- 94. Somanna A., Mundodi V., Gedamu L. (2002) Functional analysis of cathepsin B-like cysteine proteases from Leishmania donovani complex. Evidence for the activation of latent transforming growth factor beta. J. Biol. Chem. 277, 25305–25312 [DOI] [PubMed] [Google Scholar]
- 95. Sawaya R. E., Yamamoto M., Gokaslan Z. L., Wang S. W., Mohanam S., Fuller G. N., McCutcheon I. E., Stetler-Stevenson W. G., Nicolson G. L., Rao J. S. (1996) Expression and localization of 72 kDa type IV collagenase (MMP-2) in human malignant gliomas in vivo. Clin. Exp. Metastasis 14, 35–42 [DOI] [PubMed] [Google Scholar]
- 96. Pedron S., Becka E., Harley B. A. (2013) Regulation of glioma cell phenotype in 3D matrices by hyaluronic acid. Biomaterials [DOI] [PubMed] [Google Scholar]
- 97. Merzak A., McCrea S., Koocheckpour S., Pilkington G. J. (1994) Control of human glioma cell growth, migration and invasion in vitro by transforming growth factor beta 1. Br. J. Cancer 70, 199–203 [DOI] [PMC free article] [PubMed] [Google Scholar]
- 98. Kasza A., Kowanetz M., Poslednik K., Witek B., Kordula T., Koj A. (2001) Epidermal growth factor and pro-inflammatory cytokines regulate the expression of components of plasminogen activation system in U373-MG astrocytoma cells. Cytokine 16, 187–190 [DOI] [PubMed] [Google Scholar]
- 99. Paugh B. S., Paugh S. W., Bryan L., Kapitonov D., Wilczynska K. M., Gopalan S. M., Rokita H., Milstien S., Spiegel S., Kordula T. (2008) EGF regulates plasminogen activator inhibitor-1 (PAI-1) by a pathway involving c-Src, PKCdelta, and sphingosine kinase 1 in glioblastoma cells. FASEB J. 22, 455–465 [DOI] [PMC free article] [PubMed] [Google Scholar]
- 100. Teramoto H., Castellone M. D., Malek R. L., Letwin N., Frank B., Gutkind J. S., Lee N. H. (2005) Autocrine activation of an osteopontin-CD44-Rac pathway enhances invasion and transformation by H-RasV12. Oncogene 24, 489–501 [DOI] [PubMed] [Google Scholar]
- 101. Sun B. S., Dong Q. Z., Ye Q. H., Sun H. J., Jia H. L., Zhu X. Q., Liu D. Y., Chen J., Xue Q., Zhou H. J., Ren N., Qin L. X. (2008) Lentiviral-mediated miRNA against osteopontin suppresses tumor growth and metastasis of human hepatocellular carcinoma. Hepatology 48, 1834–1842 [DOI] [PubMed] [Google Scholar]
- 102. Sreekanthreddy P., Srinivasan H., Kumar D. M., Nijaguna M. B., Sridevi S., Vrinda M., Arivazhagan A., Balasubramaniam A., Hegde A. S., Chandramouli B. A., Santosh V., Rao M. R., Kondaiah P., Somasundaram K. (2010) Identification of potential serum biomarkers of glioblastoma: serum osteopontin levels correlate with poor prognosis. Cancer Epidemiol.Biomarkers Prev. 19, 1409–1422 [DOI] [PubMed] [Google Scholar]
- 103. Rappl A., Piontek G., Schlegel J. (2008) EGFR-dependent migration of glial cells is mediated by reorganisation of N-cadherin. J. Cell Sci. 121, 4089–4097 [DOI] [PubMed] [Google Scholar]
- 104. Kyriakakis E., Maslova K., Philippova M., Pfaff D., Joshi M. B., Buechner S. A., Erne P., Resink T. J. (2012) T-Cadherin is an auxiliary negative regulator of EGFR pathway activity in cutaneous squamous cell carcinoma: impact on cell motility. J. Invest. Dermatol. 132, 2275–2285 [DOI] [PubMed] [Google Scholar]
- 105. Huang Z. Y., Wu Y., Hedrick N., Gutmann D. H. (2003) T-cadherin-mediated cell growth regulation involves G2 phase arrest and requires p21(CIP1/WAF1) expression. Mol. Cell. Biol. 23, 566–578 [DOI] [PMC free article] [PubMed] [Google Scholar]
- 106. Hormigo A., Gu B., Karimi S., Riedel E., Panageas K. S., Edgar M. A., Tanwar M. K., Rao J. S., Fleisher M., DeAngelis L. M., Holland E. C. (2006) YKL-40 and matrix metalloproteinase-9 as potential serum biomarkers for patients with high-grade gliomas. Clin. Cancer Res. 12, 5698–5704 [DOI] [PubMed] [Google Scholar]
- 107. Brennan C., Momota H., Hambardzumyan D., Ozawa T., Tandon A., Pedraza A., Holland E. (2009) Glioblastoma subclasses can be defined by activity among signal transduction pathways and associated genomic alterations. PloS One 4, e7752. [DOI] [PMC free article] [PubMed] [Google Scholar]
- 108. Khan E. M., Heidinger J. M., Levy M., Lisanti M. P., Ravid T., Goldkorn T. (2006) Epidermal growth factor receptor exposed to oxidative stress undergoes Src- and caveolin-1-dependent perinuclear trafficking. J. Biol, Chem. 281, 14486–14493 [DOI] [PubMed] [Google Scholar]
- 109. Nitta M., Kozono D., Kennedy R., Stommel J., Ng K., Zinn P. O., Kushwaha D., Kesari S., Inda M. D., Wykosky J., Furnari F., Hoadley K. A., Chin L., DePinho R. A., Cavenee W. K., D'Andrea A., Chen C. C. (2010) Targeting EGFR induced oxidative stress by PARP1 inhibition in glioblastoma therapy. PloS One 5, e10767. [DOI] [PMC free article] [PubMed] [Google Scholar]
- 110. Cao J., Schulte J., Knight A., Leslie N. R., Zagozdzon A., Bronson R., Manevich Y., Beeson C., Neumann C. A. (2009) Prdx1 inhibits tumorigenesis via regulating PTEN/AKT activity. EMBO J. 28, 1505–1517 [DOI] [PMC free article] [PubMed] [Google Scholar]
- 111. Valentin F., Bueb J. L., Kieffer P., Tschirhart E., Atkinson J. (2005) Oxidative stress activates MMP-2 in cultured human coronary smooth muscle cells. Fundam. Clin. Pharmacol. 19, 661–667 [DOI] [PubMed] [Google Scholar]
- 112. DeNicola G. M., Karreth F. A., Humpton T. J., Gopinathan A., Wei C., Frese K., Mangal D., Yu K. H., Yeo C. J., Calhoun E. S., Scrimieri F., Winter J. M., Hruban R. H., Iacobuzio-Donahue C., Kern S. E., Blair I. A., Tuveson D. A. (2011) Oncogene-induced Nrf2 transcription promotes ROS detoxification and tumorigenesis. Nature 475, 106–109 [DOI] [PMC free article] [PubMed] [Google Scholar]
Associated Data
This section collects any data citations, data availability statements, or supplementary materials included in this article.