Abstract
Diffusion of autocrine and paracrine signaling molecules allows cells to communicate in the absence of physical contact. This chemical-based, long-range communication serves crucial roles in tissue function, activation of the immune system, and other physiological functions. Despite its importance, few in vitro methods to study cell-cell signaling through paracrine factors are available today. Here, we report the design and validation of a microfluidic platform that enables (i) soluble molecule-cell and/or (ii) cell-cell paracrine signaling. In the microfluidic platform, multiple cell populations can be introduced into parallel channels. The channels are separated by arrays of posts allowing diffusion of paracrine molecules between cell populations. A computational analysis was performed to aid design of the microfluidic platform. Specifically, it revealed that channel spacing affects both spatial and temporal distribution of signaling molecules, while the initial concentration of the signaling molecule mainly affects the concentration of the signaling molecules excreted by the cells. To validate the microfluidic platform, a model system composed of the signaling molecule lipopolysaccharide, mouse macrophages, and engineered human embryonic kidney cells was introduced into the platform. Upon diffusion from the first channel to the second channel, lipopolysaccharide activates the macrophages which begin to produce TNF-α. The TNF-α diffuses from the second channel to the third channel to stimulate the kidney cells, which express green fluorescent protein (GFP) in response. By increasing the initial lipopolysaccharide concentration an increase in fluorescent response was recorded, demonstrating the ability to quantify intercellular communication between 3D cellular constructs using the microfluidic platform reported here. Overall, these studies provide a detailed analysis on how concentration of the initial signaling molecules, spatiotemporal dynamics, and inter-channel spacing affect intercellular communication.
I. INTRODUCTION
Intercellular communication via soluble molecules is crucial for many biological processes, including stem cell proliferation and differentiation,1–3 tumorigenesis,4–8 development of drug resistance,8–10 as well as innate and acquired immune responses.11,12 Hence, the ability to study cell-cell communication via chemical signaling is a critical need in the field of biology. By allowing multiple cell populations to communicate in a controlled manner, systematic in vitro studies on how the cells would behave in vivo can be performed. However, the ability to study these cell-cell interactions in a well-controlled three-dimensional (3D) environment is still limited.
Microfluidic platforms that allow for precise control over cell seeding, cell culture, and the chemical microenvironment of cells have been developed to study intercellular communication.13–18 Many of these studies are restricted to two-dimensional (2D) cell cultures, whereas 3D cell cultures are known to be more physiologically relevant.19–22 Microfluidic platforms have also been developed to pattern cells in 3D constructs using laminar flow.23–25 Specifically, these platforms were used to study cell migration under co-culture in 3D,26 and more pertinent to the research described here, to study intercellular communication in 3D between two cell types.27–30 These 3D platforms lack sufficient control over the diffusion and gradient formation of soluble molecules, and are often restricted in the allowable spacing between adjacent microchannels. As a result, mimicking the in vivo spatial and temporal characteristics of intercellular communication is challenging to capture, and the cellular systems that can be studied are limited. These issues can be addressed by optimal design of a microfluidic platform and associated experimental conditions based on a detailed description of the effects of different parameters on intercellular communication.
In this work, we developed a microfluidic platform, whose design was guided by modeling of diffusional mass transport of signaling molecules. The platform was used to position one soluble molecule and two different cell types encapsulated in biologically derived 3D scaffolds in adjacent channels. Autocrine and paracrine signaling molecules can diffuse between these channels such that the patterned cells can communicate. The diffusion of these molecules in the platform was modeled to determine optimal dimensions of the microchannels and the distance between them. A proof of principle model system composed of lipopolysaccharide (LPS), mouse macrophage (RAW) 264.7 cells, and human embryonic kidney (HEK) 293 cells was used to validate the device. Intercellular communication was monitored via expression of a fluorescent reporter by the HEK cells. To the best of our knowledge, the present research is the first instance of an intercellular communication study involving three different patterned components (LPS, RAW cells, and HEK cells) in a microfluidic platform. The model system was then used to investigate the roles of concentration of the initial signaling molecules, spatiotemporal dynamics, and inter-channel spacing affect intercellular communication. Overall, microfluidic platforms like these will enable the study of complex interactions that occur between multiple cell populations.
II. MATERIALS AND METHODS
A. Platform fabrication and design
High resolution printing (5080 dpi) was used to create a mask with the design pattern on a transparency film. The mask was used to pattern 50 μm high SU-8 2050 photoresist (Microchem, Newton MA) features on a silicon wafer by photolithography.31–33 Poly(dimethysiloxane) (PDMS, General Electric RTV 650 Part A/B, Niskayuna NY) molds with embossed channels were fabricated using soft lithography by curing the pre-polymer on the silicon master for 2 h at 70 °C.34 Inlets and outlets for the liquids and cells were created in PDMS using a 23G steel punch. The surface of the PDMS replica and a clean glass coverslip (Fisher Scientific, Waltham MA) were treated with air plasma for 90 s (Model PDC-001, Harrick Scientific, Pleasantville NY) and irreversibly bonded to complete the device assembly. The device inlets were then connected to 1 mL syringes (BD Biosciences, Franklin Lakes NJ) with PTFE tubing (24 G, Cole-Parmer, Vernon Hills IL). All the syringes were actuated by a constant pressure syringe pump (PhD 2000, Harvard Apparatus, Holliston MA).
B. Cell culture, device setup, and ELISA
RAW (ATCC TIB-71, Manassas VA) and HEK cells (ATCC CRL-1573) were cultured in Dulbecco's modified eagle medium (DMEM) (Sigma Aldrich, St. Louis MO) supplemented with 10% fetal bovine serum (Gemini Bio-Products, Woodland CA) and 100 U/mL penicillin/streptomycin (Gibco, Carlsbad CA). Cells were harvested and resuspended at a concentration of 106 cells/mL. The cells were encapsulated in Matrigel (BD Biosciences) by mixing at a volumetric ratio of 30:70. The encapsulated cells were then loaded into the device and a continuous supply of medium was pumped into the device at a flow rate of 10 μL/h. A TNF-α enzyme-linked immunosorbent assay (ELISA) (Life Technologies, Carlsbad CA) was performed by stimulating RAW cells with various LPS concentrations for 6 h and measuring TNF-α production.
C. Genetic constructs
HEK cells (1 × 10⁴) were seeded into a 96 well plate and incubated with polybrene and a NFKB-GFP lentiviral vector (SABiosciences, Valencia CA) at a mode of inheritance of 20. To generate stable transfected HEK NFKB cell lines, cells were selected by the addition of 800 μg/mL puromycin (Sigma Aldrich) starting 3–4 days post transduction.
D. Confocal microscopy, image processing, and statistical analysis
To analyze the fluorescent response of the HEK cells in a 3D matrix, images were acquired using a laser scanning confocal microscope (Zeiss LSM 710) with a 20×, 0.8 NA objective. The fluorescent intensity of each cell was measured using ImageJ (NIH) Region of Interest (ROI) manager.35,36 Analysis of the variance was performed on the experimental data to determine statistical significance.
E. Modeling of diffusion of soluble factors
The LPS concentration was calculated analytically by solving Fick's second law of diffusion, Eq. (1). The transient, one-dimensional solution with pulsed boundary conditions assumes no adsorption and desorption. The TNF-α concentration profile was found by numerically solving Eq. (1) using MATLAB (MathWorks, Natick MA).
III. RESULTS AND DISCUSSION
A. Microfluidic platform to study intercellular communication
We designed and fabricated a microfluidic platform to study intercellular communication in a 3D microenvironment between two cell populations (Figure 1). The device enables long term culture (days) of two cell types in a 3D gel without disrupting the signaling gradient between the cell populations. The platform is comprised of three 300-μm wide and two 200-μm wide parallel channels, which enable encapsulation of a sufficient number of cells for intercellular communication studies. The channels were 50-μm tall and separated by arrays of 100 μm diameter posts with an end-to-end separation of 100 μm. This channel height reduces photobleaching by limiting the number of focal planes while still allowing cells to grow in a 3D environment. The arrays of posts between adjacent channels aid in patterning of the gel: surface tension pins the interfaces between the posts. The resulting gel barrier still allows for diffusion of molecules between adjacent channels.27 Media is supplied to the cells from a 400-μm wide channel placed perpendicularly at one end of all the separation and cell channels. The nutrients from the media supply channel can diffuse through the gel to the cells patterned in the channels without disrupting the signaling gradients between the cell populations. The width of the media supply channel determines the required minimum flow rate of the medium to ensure adequate amounts of nutrients reaching the cells. For the relatively wide channel used here (400 μm), the required flow rate is 1.0 μL/h.37 This constant supply of media is necessary to ensure cell viability and study intercellular communication for long durations, over the period of days.
FIG. 1.

Schematic of microfluidic platform. (a) Top down view of the microfluidic platform's channels. The blue channels contain cell-gel mixtures. The grey channels are filled with gel and physically separate the different cell populations. The red channel continuously supplies medium to the cell populations. (b) Cross sectional view of the microfluidic platform. The cell communication model system can be added to the device with LPS in the leftmost channel, RAW cells in the middle channel, and HEK cells in the rightmost channel. (c) A photograph of the microfluidic platform.
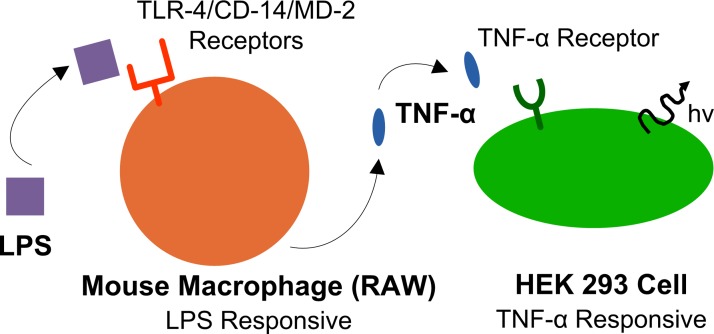
To validate the ability of the microfluidic platform to study intercellular communication, we used a model cell communication system based on the well-characterized phenomenon of macrophage activation occurring in the innate immune system. The model system, depicted in Figure 2, is comprised of: (i) the soluble factor LPS, a component of the outer membrane of Gram-negative bacteria, in the first channel; (ii) RAW cells in the second channel; and (iii) HEK cells in the third channel. These components each were mixed with Matrigel and each was introduced into the blue cell channels (Figure 1(a)). To physically separate the different cell populations, gel without cells is injected and polymerized in the grey separation channels (Figure 1(a)). Once the cells are positioned, LPS can diffuse to the second channel and initiate a signaling cascade by activating RAW cells via the TLR4/MD-2 complex.38,39 Activation of the TLR4/MD-2 complex is known to induce expression of the pro-inflammatory cytokine TNF-α, which, in turn, activates HEK cells via TNF-α receptor 1 (TNF-R1).40,41 Green fluorescent protein (GFP) expression in HEK cells could, in principle, also, although less probable, be the result of other cytokines such as IL-1, IL-2, and LTB4 by activation of the transcription factor NFKB.42 Determining exactly which cytokine is responsible for GFP expression is beyond the main point of the work presented here: introducing the application of computational modeling and microfluidic platforms to study intercellular communication.
FIG. 2.
Illustration of cell communication model system. LPS diffuses through the microenvironment and stimulates the RAW cells. The activated RAW cells produce TNF-α, which diffuses through the microenvironment to the HEK cells. Upon activation, the HEK cells express GFP.
B. The effects of concentration and distance on intercellular communication
To determine how the concentration and geometry affect the spatial and temporal distribution of signaling molecules inside the microfluidic platform, the concentration of the signaling molecules in the platform was calculated by solving Fick's second law of diffusion (Eq. (1))
| (1) |
The concentration of LPS in the middle channel (point A, where the RAW cells reside) was calculated by analytically solving Eq. (1). The transient, one-dimensional solution with pulsed boundary conditions assumes no adsorption and desorption of signaling molecules. Equation (2) describes the analytical solution for a known initial concentration of LPS
| (2) |
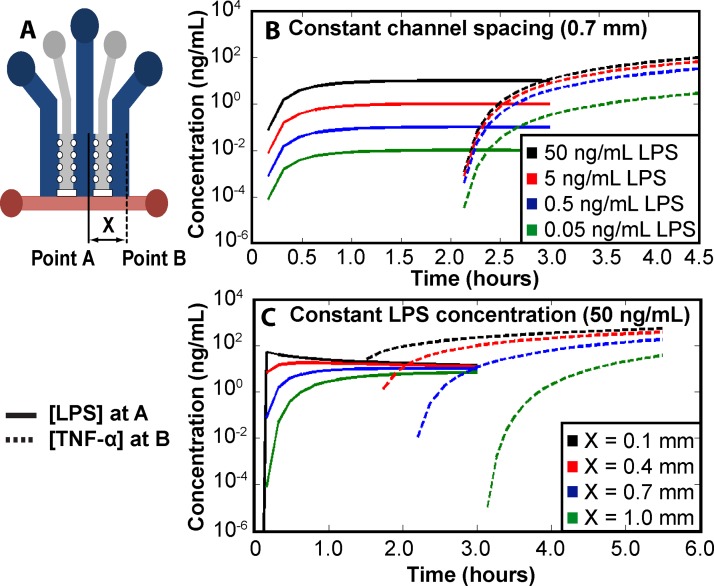
The concentration, C, is a function of the initial mass (M) of LPS, the cross sectional area of the device (A), the diffusivity (D), time (t), and the distance from the initial LPS position (Z). The diffusivity of LPS and TNF-α in Matrigel were estimated to be 6.16 × 10⁻⁸ and 3.22 × 10⁻⁷ cm2/s, respectively.43 As the concentration of LPS directly affects the rate of TNF-α production by RAW cells, the concentration of LPS at point A in Figure 3(a) was modeled. From this calculation, the concentration of TNF-α at various LPS concentrations was determined by performing a TNF-α ELISA and stimulating the RAW cells with LPS (shown in supplementary material, Figure S1).44 Assuming a 1-h delay from empirical evidence and a constant rate of TNF-α production, the concentration of TNF-α in the third channel (to the right, in point B, where the HEK cells reside; see Figure 3(a)) was determined by numerically solving Eq. (1). Using these equations and assuming a fixed inter-channel spacing (X) of 0.7 mm between cell populations, the concentration of each signaling molecule at the respective point in the device was plotted as a function of time (Figure 3(b)). The results of this model illustrates that the initial concentration of LPS added to the device significantly affects the resulting TNF-α concentration, as expected with the highest starting concentration of LPS resulting in the highest concentration of TNF-α. However, the initial LPS concentration does not strongly affect the temporal aspect of intercellular communication as the RAW cells still produce TNF-α at low concentrations of LPS.
FIG. 3.
Concentration of signaling molecules throughout the microfluidic platform. (a) Top down view of the microfluidic platform's channels and channel spacing (X). Point A and point B are the locations from where LPS and TNF-α are calculated, respectively. Modeled concentrations of LPS and TNF-α as (b) initial LPS concentration varies with a fixed channel width of 0.7 mm and (c) channel spacing (X) varies with a fixed initial LPS concentration of 50 ng/mL.
Similar to the initial LPS concentration, the inter-channel spacing between the cell populations also affects the intercellular communication. Assuming a constant initial LPS concentration of 50 ng/mL and using Eq. (2) and the numerical solution of Eq. (1), the concentration of LPS at point A and TNF-α at point B for various values of inter-channel spacing (X) was calculated (Figure 3(c)). Varying the inter-channel spacing has two main effects.
First, increasing the spacing leads to increased diffusion time for both LPS and TNF-α. The additional time required for LPS diffusion causes TNF-α production to occur later. Second, an increase in channel spacing effectively decreases the concentration of signaling molecules due to an increased volume, as can be noted by the decrease in LPS concentration with increasing inter-channel spacing (Figure 3(c)). Hence, the increased spacing dilutes the signal strength. Still, in certain situations smaller distances between the cell channels may not be appropriate. For example, increasing the inter-channel spacing modulates the temporal and spatial distribution of signaling molecules enabling controlled measurement of a specific signaling cascade.
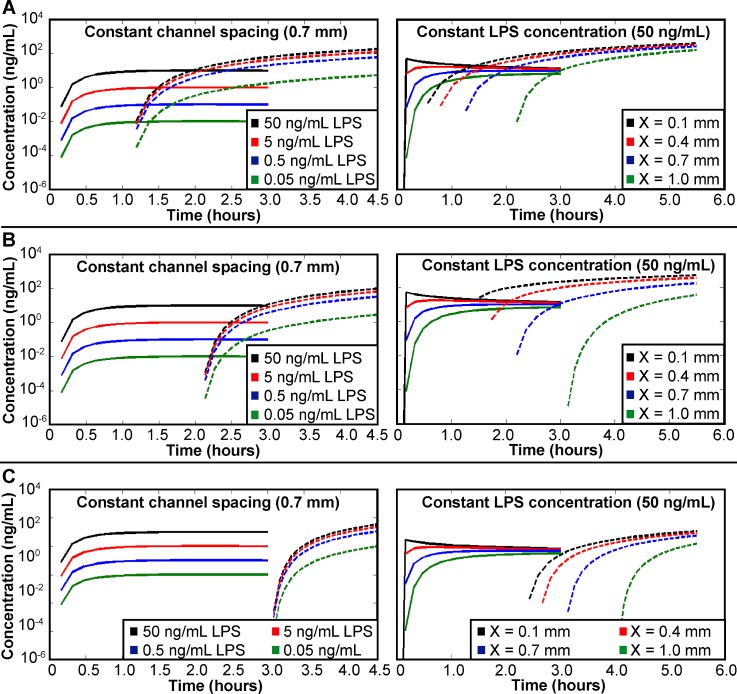
In addition to initial LPS concentration and inter-channel spacing, the length of time required for the RAW cells to begin producing TNF-α also affects the distribution of signaling molecules. The TNF-α concentration in the microfluidic platform was calculated using delays in TNF-α production of 0, 1, and 2 h (Figure 4). An increase in the time required for TNF-α production causes a decrease in TNF-α concentration when comparing concentrations at the same time point. While the time required for signaling molecule production is dependent upon the cellular system used, the delay in production directly affects intercellular communication. Hence, this analysis should provide insight to future users when determining appropriate timescales for study of intercellular communication.
FIG. 4.
Concentration of signaling molecules modeled throughout the microfluidic platform with (a) no delay, (b) a 1-h delay, and (c) a 2-h delay in TNF-α production. Solid lines denote LPS concentration calculated at point A; dashed lines denote TNF-α concentrations calculated at point B. Plots on the left vary the initial LPS concentration with a constant inter-channel spacing of 0.7 mm. Plots on the right vary inter-channel spacing with a constant initial LPS concentration of 50 ng/mL.
Overall, these calculations provide a guideline for the design of a microfluidic platform with appropriate channel geometries, as well as for experiments with initial concentrations of signaling molecules such that the complete spatial and temporal characteristics of the intercellular communication can be studied.
C. Analysis of intercellular communication in microfluidic platform
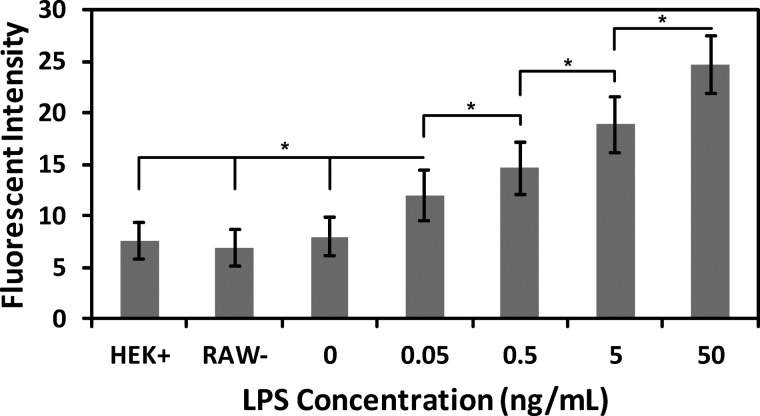
To monitor the intercellular communication between two cell populations within the microfluidic platform, the cell communication model system was combined with the microfluidic platform (Figure 1(b)). RAW and HEK cells were mixed with Matrigel and added to the second and third cell channel, respectively. Varying concentrations of LPS (0–50 ng/mL) were added to the first channel to modulate the responsiveness of the HEK cells. To analyze the intercellular communication inside the microfluidic platform, HEK cells were imaged using a confocal microscope after 14 h of incubation. This 14 h incubation period allowed for sufficient production and diffusion of all soluble molecules as well as expression of GFP. The fluorescence of HEK cells also was measured in the absence of LPS (0 ng/mL). In addition, a LPS concentration of 5 ng/mL was added to a platform that did not contain any RAW cells (RAW−) to determine the sensitivity of the HEK cells to LPS. As a third control, the HEK cells were added to the platform in the absence of both LPS and RAW cells (HEK+). In all three control experiments (0 ng/mL LPS, RAW−, and HEK+), a similar low level of fluorescence is observed, presumably due to constitutive expression of GFP. The HEK+ control experiment and supplementary Figure S1 (depicting the relation between LPS concentration and TNF-α production44) indicate that the main reason for the observed GFP expression in HEK cells is due to TNF-α produced by the macrophage when stimulated by LPS.
The fluorescent response of HEK cells expectedly increased as the concentration of LPS increased inside the channels (Figure 5), with an LPS concentration of 50 ng/mL inducing the strongest fluorescent response from the HEK cells. In addition, the fluorescent intensity of the HEK cells was significantly different in all cases (p < 0.05), which validates the ability to quantify intercellular communication using this microfluidic platform. Further, these results correlate with the concentrations modeled earlier (Figure 3) and demonstrate how to modulate experimental parameters and used this information to design an appropriate device for the study of intercellular communication.
FIG. 5.
Fluorescent expression of HEK cells. LPS concentration was varied over the range of 0–50 ng/mL, and the fluorescence intensity of the HEK cells was analyzed. In addition, 5 ng/mL of LPS was added to the device without the RAW cells (RAW-); HEK cells were added to the device without any other component (HEK+). Error bars represent the standard deviation calculated from all experiments; experiments were repeated six times resulting in at least 90 cells analyzed for each value. Significant differences are labeled by asterisks (* P < 0.05).
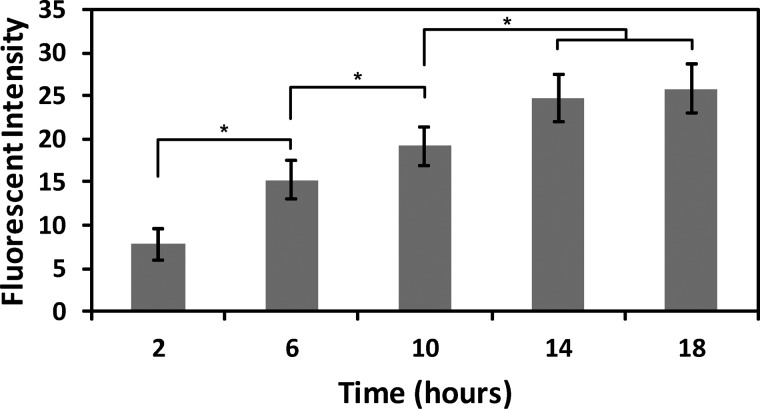
We also studied the relationship between intercellular communication and time using the same cell communication model system in the microfluidic platform. An LPS concentration of 50 ng/mL was chosen for this study (added to the platform along with the RAW and HEK cells), as this concentration led to maximum GFP expression (see above) and will enable better characterization of the temporal dynamics of the intercellular communication. Intercellular communication was quantified inside the microfluidic platform by measuring GFP expression in the HEK cells over an 18-h time period at 4 h intervals. As expected the fluorescent response of the HEK cells increased with time (Figure 6). In addition, the fluorescent intensity of the HEK cells was significantly different between each measured time point except the 14 and 18 h conditions (p < 0.05). This study shows that the methodology reported here can also be used to analyze spatiotemporal intercellular signaling events.
FIG. 6.
Fluorescent expression of HEK cells when incubated with RAW cells and an LPS concentration of 50 ng/mL. The fluorescent intensity of the HEK cells was analyzed every 4 h from 2 to 18 h. Error bars represent the standard deviation calculated from all experiments; experiments were repeated five times resulting in at least 50 cells analyzed for each value. Significant differences are labeled by asterisks (* P < 0.05).
Overall, the results in Figures 5 and 6 establish, to the best of our knowledge, the first experimental quantification of cue-to-cell-to-cell intercellular communication between multiple cell populations inside a 3D microfluidic platform. Further, the spatial and temporal response of the system is described when in combination with the simulated results from Figure 3.
IV. CONCLUSIONS
This paper describes the design and application of a microfluidic platform to study intercellular communication in a 3D microenvironment. The platform enabled study of cell communication via soluble molecules in real-time and was designed to mimic the early stages of a bacterial infection. We demonstrate an alternative arrangement for the media channel compared to previous reports that facilitates study of intercellular communication between multiple cell populations.15,23–28 This arrangement reduces the number of media channels compared to the previously reported configurations. By varying the initial LPS concentration, a significant difference in the fluorescent response of the HEK cells was observed. This outcome demonstrates the ability to quantify intercellular communication in a defined model system in 3D using a microfluidic platform. Further, this work shows that analytical and computational modeling can be used effectively to guide the design of an appropriate platform and associated experimental conditions for intercellular communication studies. Altogether, these three studies demonstrate the ability to study the effects of (i) concentration of the initial signaling molecules, (ii) spatiotemporal dynamics, and (iii) inter-channel spacing on intercellular communication. This approach, based on diffusional modeling and experimental use of microfluidic platforms, such as the one reported in this study, will enable studies of cell-cell communication between multiple cell populations in a 3D microenvironment.
REFERENCES
- 1.Watt F. M. and Hogan B. L., Science 287(5457 ), 1427–1430 (2000). 10.1126/science.287.5457.1427 [DOI] [PubMed] [Google Scholar]
- 2.Khademhosseini A., Ferreira L., Blumling J. III, Yeh J., Karp J. M., Fukuda J., and Langer R., Biomaterials 27(36 ), 5968–5977 (2006). 10.1016/j.biomaterials.2006.06.035 [DOI] [PubMed] [Google Scholar]
- 3.Bhandari R. N., Riccalton L. A., Lewis A. L., Fry J. R., Hammond A. H., Tendler S. J., and Shakesheff K. M., Tissue Eng. 7(3 ), 345–357 (2001). 10.1089/10763270152044206 [DOI] [PubMed] [Google Scholar]
- 4.Gaggioli C., Hooper S., Hidalgo-Carcedo C., Grosse R., Marshall J. F., Harrington K., and Sahai E., Nat. Cell Biol. 9(12 ), 1392–1400 (2007). 10.1038/ncb1658 [DOI] [PubMed] [Google Scholar]
- 5.Ghajar C. M., Blevins K. S., Hughes C. C., George S. C., and Putnam A. J., Tissue Eng. 12(10 ), 2875–2888 (2006). 10.1089/ten.2006.12.2875 [DOI] [PubMed] [Google Scholar]
- 6.Gajewski T. F., Schreiber H., and Fu Y. X., Nat. Immunol. 14(10 ), 1014–1022 (2013). 10.1038/ni.2703 [DOI] [PMC free article] [PubMed] [Google Scholar]
- 7.Balkwill F. R., Capasso M., and Hagemann T., J. Cell Sci. 125(23 ), 5591–5596 (2012). 10.1242/jcs.116392 [DOI] [PubMed] [Google Scholar]
- 8.Gabrilovich D. I., Ostrand-Rosenberg S., and Bronte V., Nat. Rev. Immunol. 12(4 ), 253–268 (2012). 10.1038/nri3175 [DOI] [PMC free article] [PubMed] [Google Scholar]
- 9.Zheng Y., Yang J., Qian J., Qiu P., Hanabuchi S., Lu Y., Wang Z., Liu Z., Li H., He J., Lin P., Weber D., Davis R. E., Kwak L., Cai Z., and Yi Q., Leukemia 27(3 ), 702–710 (2013). 10.1038/leu.2012.272 [DOI] [PMC free article] [PubMed] [Google Scholar]
- 10.Ostman A., Nat. Med. 18(9 ), 1332–1334 (2012). 10.1038/nm.2938 [DOI] [PubMed] [Google Scholar]
- 11.Chou R. C., Kim N. D., Sadik C. D., Seung E., Lan Y., Byrne M. H., Haribabu B., Iwakura Y., and Luster A. D., Immunity 33(2 ), 266–278 (2010). 10.1016/j.immuni.2010.07.018 [DOI] [PMC free article] [PubMed] [Google Scholar]
- 12.McDonald B., Pittman K., Menezes G. B., Hirota S. A., Slaba I., Waterhouse C. C., Beck P. L., Muruve D. A., and Kubes P., Science 330(6002 ), 362–366 (2010). 10.1126/science.1195491 [DOI] [PubMed] [Google Scholar]
- 13.Lovchik R. D., Bianco F., Tonna N., Ruiz A., Matteoli M., and Delamarche E., Anal. Chem. 82(9 ), 3936–3942 (2010). 10.1021/ac100771r [DOI] [PubMed] [Google Scholar]
- 14.Efremov A. N., Stanganello E., Welle A., Scholpp S., and Levkin P. A., Biomaterials 34(7 ), 1757–1763 (2013). 10.1016/j.biomaterials.2012.11.034 [DOI] [PubMed] [Google Scholar]
- 15.Chung S., Sudo R., Mack P. J., Wan C. R., Vickerman V., and Kamm R. D., Lab Chip 9(2 ), 269–275 (2009). 10.1039/b807585a [DOI] [PubMed] [Google Scholar]
- 16.Ma H., Liu T., Qin J., and Lin B., Electrophoresis 31(10 ), 1599–1605 (2010). 10.1002/elps.200900776 [DOI] [PubMed] [Google Scholar]
- 17.Abhyankar V. V., Lokuta M. A., Huttenlocher A., and Beebe D. J., Lab Chip 6(3 ), 389–393 (2006). 10.1039/b514133h [DOI] [PubMed] [Google Scholar]
- 18.Srigunapalan S., Lam C., Wheeler A. R., and Simmons C. A., Biomicrofluidics 5(1 ), 013409 (2011) 10.1063/1.3530598. [DOI] [PMC free article] [PubMed] [Google Scholar]
- 19.Abbott A., Nature 424(6951 ), 870–872 (2003). 10.1038/424870a [DOI] [PubMed] [Google Scholar]
- 20.Yamada K. M. and Cukierman E., Cell 130(4 ), 601–610 (2007). 10.1016/j.cell.2007.08.006 [DOI] [PubMed] [Google Scholar]
- 21.Bissell M. J. and Labarge M. A., Cancer Cell 7(1 ), 17–23 (2005). 10.1016/S1535-6108(04)00375-7 [DOI] [PMC free article] [PubMed] [Google Scholar]
- 22.Griffith L. G. and Swartz M. A., Nat. Rev. Mol. Cell Biol. 7(3 ), 211–224 (2006). 10.1038/nrm1858 [DOI] [PubMed] [Google Scholar]
- 23.Takayama S., McDonald J. C., Ostuni E., Liang M. N., Kenis P. J., Ismagilov R. F., and Whitesides G. M., Proc. Natl. Acad. Sci. U.S.A. 96(10 ), 5545–5548 (1999). 10.1073/pnas.96.10.5545 [DOI] [PMC free article] [PubMed] [Google Scholar]
- 24.Wong A. P., Perez-Castillejos R., Christopher Love J., and Whitesides G. M., Biomaterials 29(12 ), 1853–1861 (2008). 10.1016/j.biomaterials.2007.12.044 [DOI] [PMC free article] [PubMed] [Google Scholar]
- 25.Sung K. E., Yang N., Pehlke C., Keely P. J., Eliceiri K. W., Friedl A., and Beebe D. J., Integr. Biol. 3(4 ), 439–450 (2011). 10.1039/c0ib00063a [DOI] [PMC free article] [PubMed] [Google Scholar]
- 26.Torisawa Y. S., Mosadegh B., Luker G. D., Morell M., O'Shea K. S., and Takayama S., Integr. Biol. 1(11–12 ), 649–654 (2009). 10.1039/b915965g [DOI] [PMC free article] [PubMed] [Google Scholar]
- 27.Huang C. P., Lu J., Seon H., Lee A. P., Flanagan L. A., Kim H. Y., Putnam A. J., and Jeon N. L., Lab Chip 9(12 ), 1740–1748 (2009). 10.1039/b818401a [DOI] [PMC free article] [PubMed] [Google Scholar]
- 28.Lee S. H., Heinz A. J., Shin S., Jung Y. G., Choi S. E., Park W., Roe J. H., and Kwon S., Anal. Chem. 82(7 ), 2900–2906 (2010). 10.1021/ac902903q [DOI] [PubMed] [Google Scholar]
- 29.Bauer M., Su G., Beebe D. J., and Friedl A., Integr. Biol. 2(7–8 ), 371–378 (2010). 10.1039/c0ib00001a [DOI] [PMC free article] [PubMed] [Google Scholar]
- 30.Berry S. M., Singh C., Lang J. D., Strotman L. N., Alarid E. T., and Beebe D. J., Integr. Biol. 6, 224–231 (2014) 10.1039/c3ib40136g. [DOI] [PMC free article] [PubMed] [Google Scholar]
- 31.Lorenz H., Despont M., Fahrni N., LaBianca N., Renaud P., and Vettiger P., J. Micromech. Microeng. 7(3 ), 121–124 (1997). 10.1088/0960-1317/7/3/010 [DOI] [Google Scholar]
- 32.Jo B. H., Van Lerberghe L. M., Motsegood K. M., and Beebe D. J., J. Microelectromech. Syst. 9(1 ), 76–81 (2000). 10.1109/84.825780 [DOI] [Google Scholar]
- 33.Renaud P., van Lintel H., Heuschkel M., and Guerin L., in Proceedings of Micro Total Analysis Systems '98 (Springer, 1998), pp. 17–22 10.1007/978-94-011-5286-0_4. [DOI] [Google Scholar]
- 34.Xia Y. N. and Whitesides G. M., Angew. Chem. Int. Ed. 37(5 ), 551–575 (1998). 10.1002/(SICI)1521-3773(19980316)37:5%3C550::AID-ANIE550%3E3.0.CO;2-G [DOI] [PubMed] [Google Scholar]
- 35.Abràmoff M. D., Magalhães P. J., and Ram S. J., Biophoton. Int. 11(7 ), 36–43 (2004). [Google Scholar]
- 36.Lang J. D., Berry S. M., Powers G. L., Beebe D. J., and Alarid E. T., Integr. Biol. 5(5 ), 807–816 (2013). 10.1039/c3ib20265h [DOI] [PMC free article] [PubMed] [Google Scholar]
- 37.Young E. W. and Beebe D. J., Chem. Soc. Rev. 39(3 ), 1036–1048 (2010). 10.1039/b909900j [DOI] [PMC free article] [PubMed] [Google Scholar]
- 38.Beutler B., Curr. Opin. Immunol. 12(1 ), 20–26 (2000). 10.1016/S0952-7915(99)00046-1 [DOI] [PubMed] [Google Scholar]
- 39.Fitzgerald K. A., Rowe D. C., and Golenbock D. T., Microbes Infect. 6(15 ), 1361–1367 (2004). 10.1016/j.micinf.2004.08.015 [DOI] [PubMed] [Google Scholar]
- 40.Baud V. and Karin M., Trends Cell Biol. 11(9 ), 372–377 (2001). 10.1016/S0962-8924(01)02064-5 [DOI] [PubMed] [Google Scholar]
- 41.Wajant H., Pfizenmaier K., and Scheurich P., Cell Death Differ. 10(1 ), 45–65 (2003). 10.1038/sj.cdd.4401189 [DOI] [PubMed] [Google Scholar]
- 42.Baeuerle P. A. and Henkel T., Annu. Rev. Immunol. 12, 141–179 (1994). 10.1146/annurev.iy.12.040194.001041 [DOI] [PubMed] [Google Scholar]
- 43.Ciocan E. and Ciocan R., in Annual International Conference of the IEEE Engineering in Medicine and Biology Society, 2009 (EMBC 2009) (IEEE, 2009), pp. 4925–4928 10.1109/IEMBS.2009.5332715. [DOI] [PubMed] [Google Scholar]
- 44. See supplementary material at http://dx.doi.org/10.1063/1.4887098E-BIOMGB-8-004404 for rate of TNF-α production by RAW cells at various LPS concentrations.
Associated Data
This section collects any data citations, data availability statements, or supplementary materials included in this article.
Data Citations
- See supplementary material at http://dx.doi.org/10.1063/1.4887098E-BIOMGB-8-004404 for rate of TNF-α production by RAW cells at various LPS concentrations.


