FIG. 3.
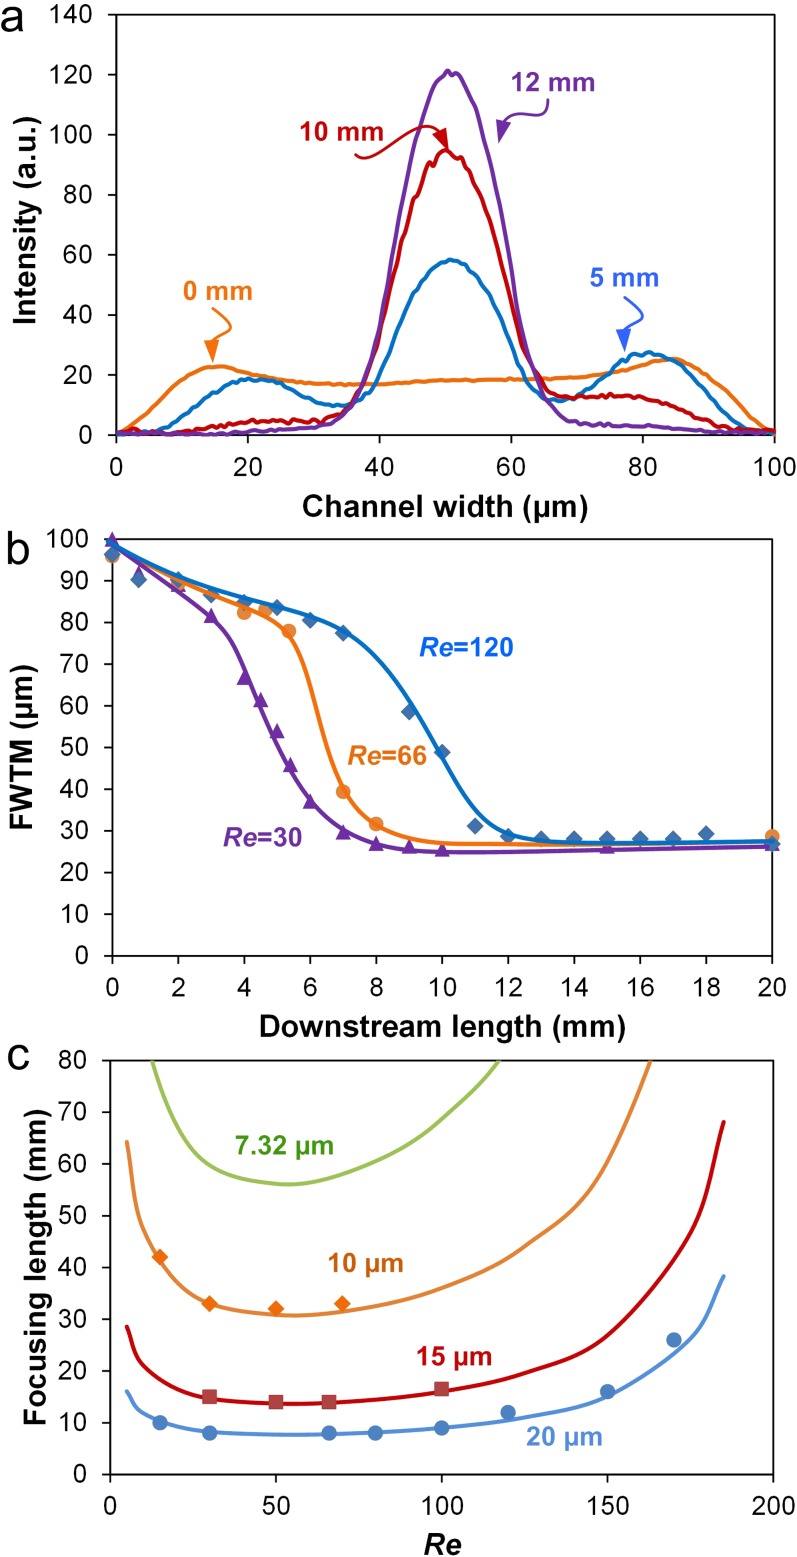
Measurements of focusing length. (a) Fluorescent intensity line scans across channel width at consecutive downstream positions. (b) FWTM of major peaks as a function of downstream length at various Re. (c) Focusing length as a function of Re. The prediction curves were calculated based on two-stage migration model. Solid symbols indicate experimental measurements. All data were obtained using polystyrene beads (10 μm, 15 μm, and 20 μm in diameter) in a 100 μm × 50 μm microchannel.

