Abstract
This paper presents a continuous flow microfluidic device for the separation of DNA from blood using magnetophoresis for biological applications and analysis. This microfluidic bio-separation device has several benefits, including decreased sample handling, smaller sample and reagent volumes, faster isolation time, and decreased cost to perform DNA isolation. One of the key features of this device is the use of short-range magnetic field gradients, generated by a micro-patterned nickel array on the bottom surface of the separation channel. In addition, the device utilizes an array of oppositely oriented, external permanent magnets to produce strong long-range field gradients at the interfaces between magnets, further increasing the effectiveness of the device. A comprehensive simulation is performed using COMSOL Multiphysics to study the effect of various parameters on the magnetic flux within the separation channel. Additionally, a microfluidic device is designed, fabricated, and tested to isolate DNA from blood. The results show that the device has the capability of separating DNA from a blood sample with a purity of 1.8 or higher, a yield of up to 33 μg of polymerase chain reaction ready DNA per milliliter of blood, and a volumetric throughput of up to 50 ml/h.
INTRODUCTION
Microfluidic magnetic separation devices create a platform to perform selective processes to isolate and enrich different types of biological particles. The devices can include, but are not limited to, rare cell isolators, DNA or RNA extractors, Lab-on-a-Chip devices, or micro-total analysis systems (μTAS). Microfluidic-based magnetic bio-separators are ideal for these applications due to their ability to separate individual cells with high levels of accuracy. Unlike their macro-scale counterparts, the nature of continuous flow microfluidic devices drastically reduces the amount of non-target material that could be trapped beneath target materials. Also because of the nature of magnetic fields, they do not apply any force on the non-target material further enhancing the selectivity of the device.1
Magnetophoretic bio-separation can target many different biomaterials. Two methods have been used to tag biomaterials some of which are inherently non-magnetic. The methods are direct and indirect binding. Binding describes the process of attaching a magnetic bead to a non-magnetic or weakly magnetic biomaterial.2,3 Direct binding is the process of binding magnetic beads directly to the surface of the target biomaterial.2 For direct binding to be possible the magnetic beads must be coated with suitable biological markers for the specific target biomaterial.4 Indirect binding requires at least one antigen to complete the binding between the bead and the target biomaterial. The magnetic beads can vary from tens of nanometers in diameter to several microns. The beads are encapsulated with either polymer or silica and are coated with varying bio-conjugates to make the beads highly selective for various target biomaterials.1,5,6 Magnetic separation can also utilize the inherent magnetic properties of target biomaterials compared to the medium they are contained in. An example of such process is separating red blood cells from whole blood. Since deoxygenated red blood cells have paramagnetic properties, they can be separated from white blood cells and plasma which are non-magnetic.7,8
With increasing advancements in microfluidics technology, it has become possible to capture these magnetic bead-particle complexes instead of guiding them to a separate output channel.9 For particle capturing, the magnetic force can be less precise because the goal of the magnetic force is to simply overpower the combination of the other forces. Although many different forces affect the movement of beads or bead-particle complexes including magnetic, drag, particle/fluid interactions, inertia, buoyancy, gravity, thermal kinetics, and inter-particle effects, only the magnetic, drag, and gravitational forces are dominant.2 Because the magnetic force can be very similar for various particles, it is currently difficult to simultaneously separate multiple biomaterials from samples.3 Keaveny and Maxey10 presented a model on the magnetic interactions between paramagnetic beads and reported that magnetic particles ranging from 0.3 to 10 μm when magnetized by a static magnetic field tend to form chains. However, the bead-bead interaction can be neglected when the distance between beads approaches four times the radius. It has been reported that the separation efficiency is also affected by temperature, and as the temperature increases, the separation efficiency increases due to a decrease in fluid viscosity.11
The use of continuous-flow magnetophoresis for bio-separation has been growing in recent years. The biological materials that microfluidic magnetophoresis can target range in size from DNA to biological cells.12,13 The separation process must be done efficiently in order for micro-scale separation to be possible. By separating biomaterials, the individual target materials can be analyzed.2 In general magnetophoresis has many benefits, including minimal to no damage to the target biomaterial. Another benefit of magnetic separation is that external magnets can be used which will allow the sample fluid to avoid contact with the magnet, preventing sample contamination.14 Conventional cell separation methods utilize a membrane filtering system. These systems have had a history of clogging issues, due to the varying pore size of the membrane.13 Other separation techniques include, but are not limited to biochemical interactions, sheath flow and streamline sorting, dielectrophoresis, fluorescence activated cell sorting (FACS), and deterministic lateral displacement.15,16 The end goal of the microfluidic magnetophoresis separators is to incorporate them into a complete μTAS.17 Magnetophoretic microfluidic platforms when compared to centralized lab based separation techniques have the potential to increase the ability for point-of-care diagnosis, reduce the required sample size, and provide faster sample processing.13 In addition, these devices have the potential to be integrated into more specific or advanced systems, with the possibility for continuous readout of the separation efficiency and other diagnostics.18
Karle et al.19 presented a similar approach for DNA extraction that utilizes a time-varying magnetic field generated by a rotating permanent magnet. However, their volumetric throughput was limited to 2.6 ml/h, while the present device performs at a range of 10–50 ml/h. Spinomix© (Ref. 20) has recently announced the development of a fully automated product, called MagPhase™ for nucleic acid extraction and cell separation using magnetic nanoparticles and microfluidic disposable cartridges. However, specific information regarding the performance of the product was not available.
THEORETICAL BACKGROUND
There are three dominant external forces acting on magnetic particles traveling through a microfluidic device. These forces include hydrodynamic drag force, gravitational force, and magnetic force. There are varying assumptions made by researchers in this field but the ones that are the most common are a Newtonian fluid (for the sample or the buffer solution),6 spherical magnetic particles,21 non-rotational,22 no slip conditions for the walls of the device,23 and laminar flow.24,25 The governing equations are Navier-Stokes for fluid flow and Maxwell's equations for magnetic fields. The equations for drag force (), gravitational force (), and magnetic force () are as follows:
| (1) |
| (2) |
| (3) |
In the drag force equation (Eq. (1)), is the viscosity of the fluid in which the particle is traveling, is the radius of the particle, while and are the particle and fluid velocities. The gravitational force equation (Eq. (2)) contains and which are the particle and fluid densities, and which is the volume of the particle. The magnetic force equation (Eq. (3)) contains which is the particle's magnetic dipole moment and which is the magnetic field. The magnetic dipole can be further written as
| (4) |
where is the particle's volumetric magnetization. The volumetric magnetization is correlated to the applied magnetic field on the particle. The magnetization of the magnetic beads plays a vital role in the success of a device. By choosing magnets that generate a magnetic field within the saturation region for the specific magnetic bead, the device will have an optimal magnetic force on the bead-particle complexes. The magnetization data can be often provided by the bead manufacturers. Some of the researchers in the numerical and simulation field modify and use less simplified equations to model the trajectory of the particles within their devices. Using Newton's second law focused on a magnetic particle it can be shown that
| (5) |
More details on the particle motion and trajectory can be found in a previous publication of the second author.21
DESIGN
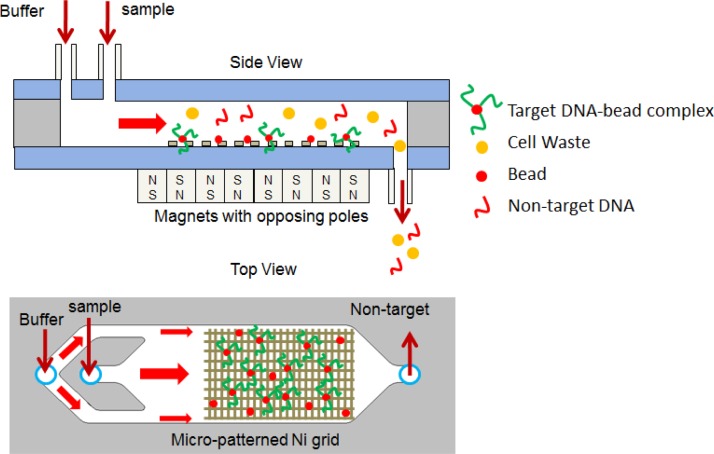
The DNA separation device presented in this work has two important features distinguishing it from previous devices. Namely, the utilization of a nickel grid along the bottom surface of the microfluidic channel to produce high magnetic gradients, and the use of oppositely oriented permanent magnets to create an increase in the magnetic gradient at the interface between the magnets. These features have been shown to be effective in the separation of cells.21 A schematic of the microfluidic device is shown in Fig. 1. The overall dimension of the device is 75 mm × 25 mm × 0.7 mm, with a 100 μm channel height. The permanent magnets have dimensions of 19 mm × 6.35 mm × 1.6 mm, and are a grade of N52. These features translate to an effective separation regardless of the target biomaterial. These features provide two benefits with regard to the magnetic field. The nickel grid produces short-range magnetic fields, while the permanent magnets produce long-range magnetic fields. The long-range magnetic fields are produced by the external permanent magnets and are used to pull down the magnetic particles to the bottom surface of the channel. The short-range magnetic field is used for the purpose of trapping and immobilizing the magnetic particles along the bottom surface of the device. This short-range magnetic field which is induced by the bias field of the external magnets, only has an effect on particles within a few microns.
FIG. 1.
Schematic of a microfluidic chip for DNA isolation. The overall dimensions of the device are 75 mm × 25 mm × 0.7 mm and the channel height is 100 μm. The schematic is not to scale.
COMPUTATIONAL MODEL
COMSOL Multiphysics was used to study the effects of a series of design parameters and to optimize the microfluidic chip. Two computational models were used in this study. The first model examines the entire microfluidic device including the permanent magnet array, glass substrates, and microfluidic channel. The second model is used to study the effects of the nickel strip dimensions and only takes into account the nickel strips and the surrounding fluid. The relative magnetic permeability of the substrate, fluid (which is assumed to be water), and air are set at 1.0. The permanent magnets have a relative permeability of 1.05, a remanent flux density of 1.48 T, and are given a positive or negative value depending on the orientation of the magnets. In the second model, a uniform magnetic flux boundary condition is applied to the bottom surface. In general, the magnetic flux varies along the channel due to the oppositely oriented external magnets. However, since the length of the computational domain is significantly smaller than the overall length of the device, a uniform boundary condition is a reasonable assumption. Also, the purpose of this model is to study the effects of nickel strip dimensions on the short-range magnetic field gradients and the exact value of magnetic flux at the bottom surface is unimportant. Periodic boundary conditions were applied to the left and right sides of the computational domain.
PARAMETRIC STUDIES
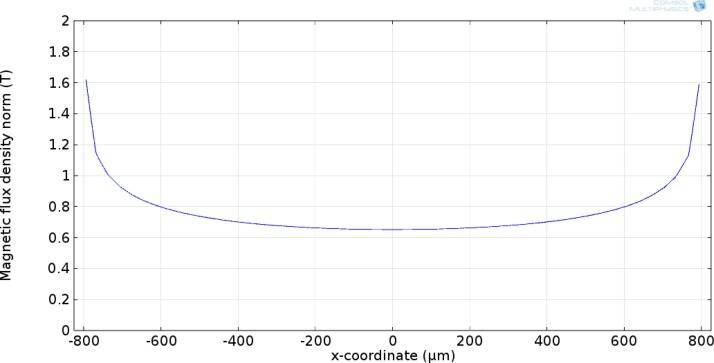
A paramedic study was performed to optimize a microfluidic device for DNA isolation. A schematic of the computational domain is depicted in Fig. 2. The parameters include nickel strip thickness, nickel width, the gap between the nickel strips, substrate thickness, channel height, and an array of permanent magnets. The model was first validated by modeling the magnetic flux for a single BC-14 N52 magnet (K&J Magnetics), and comparing it to the technical specifications provided by the manufacturer. A surface magnetic flux of 0.6913 T has been provided for this magnet by the manufacturer. As shown in Fig. 3, the computational model shows the surface flux of 0.68 T which is within 1.6% of the reported value.
FIG. 2.

Schematic of the computational domain. The width of the nickel strips corresponds to w. Gap is the distance between the nickel strips. t is the thickness of the nickel strips. The schematic is not to scale.
FIG. 3.
Magnetic field simulation of a single BC-14 N52 magnet used in order to validate the model.
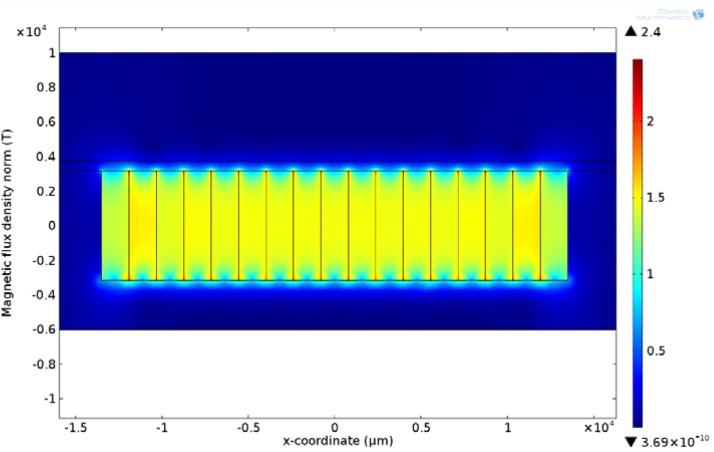
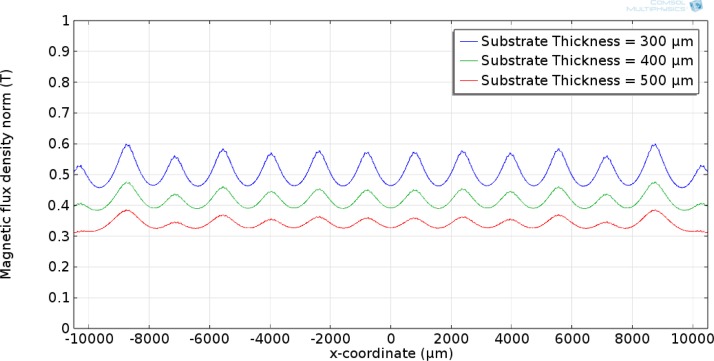
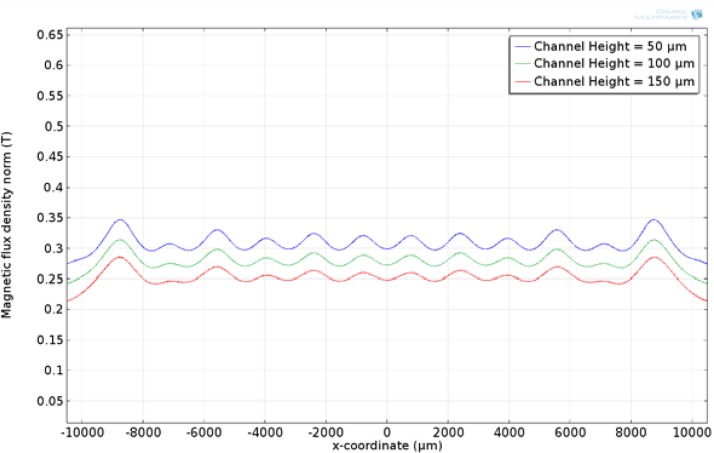
Figure 4 shows the surface plot of the entire microfluidic device. As can be seen, the maximum magnetic flux occurs at the interface between the magnets. The effect of substrate thickness on the magnetic field along the bottom surface of the microfluidic channel was studied. The substrate thickness was varied from 300 to 500 μm. 300 μm was the lower bound due to micro-fabrication constraints. If the substrate thickness is less than 300 μm, the likelihood of breaking the substrate during the fabrication process increases. The results show that the magnetic flux along the bottom surface of the device decreases as the thickness of the substrate increases. This would lead to choosing the thinnest possible substrate in order to increase the magnetic flux and thus the magnetic force. Using the same model, the effect of channel height was studied. The channel height was varied from 50 to 150 μm while keeping the substrate thickness constant at 500 μm. As shown in Figs. 5 and 6, the magnetic flux decreases when increasing the substrate thickness and channel height, respectively, while keeping the other parameter constant. An optimized device should utilize a channel that keeps the magnetic flux within the saturation region for the magnetic beads, but is not too tall to prevent beads flowing along the top surface from being captured.
FIG. 4.
2D surface plot of the microfluidic device with an array of permanent magnets.
FIG. 5.
Magnetic flux along the bottom surface of the microfluidic channel at various substrate thicknesses with a channel height of 100 μm.
FIG. 6.
Magnetic flux along the top surface of the microfluidic channel at various channel heights with a substrate thickness of 500 μm.
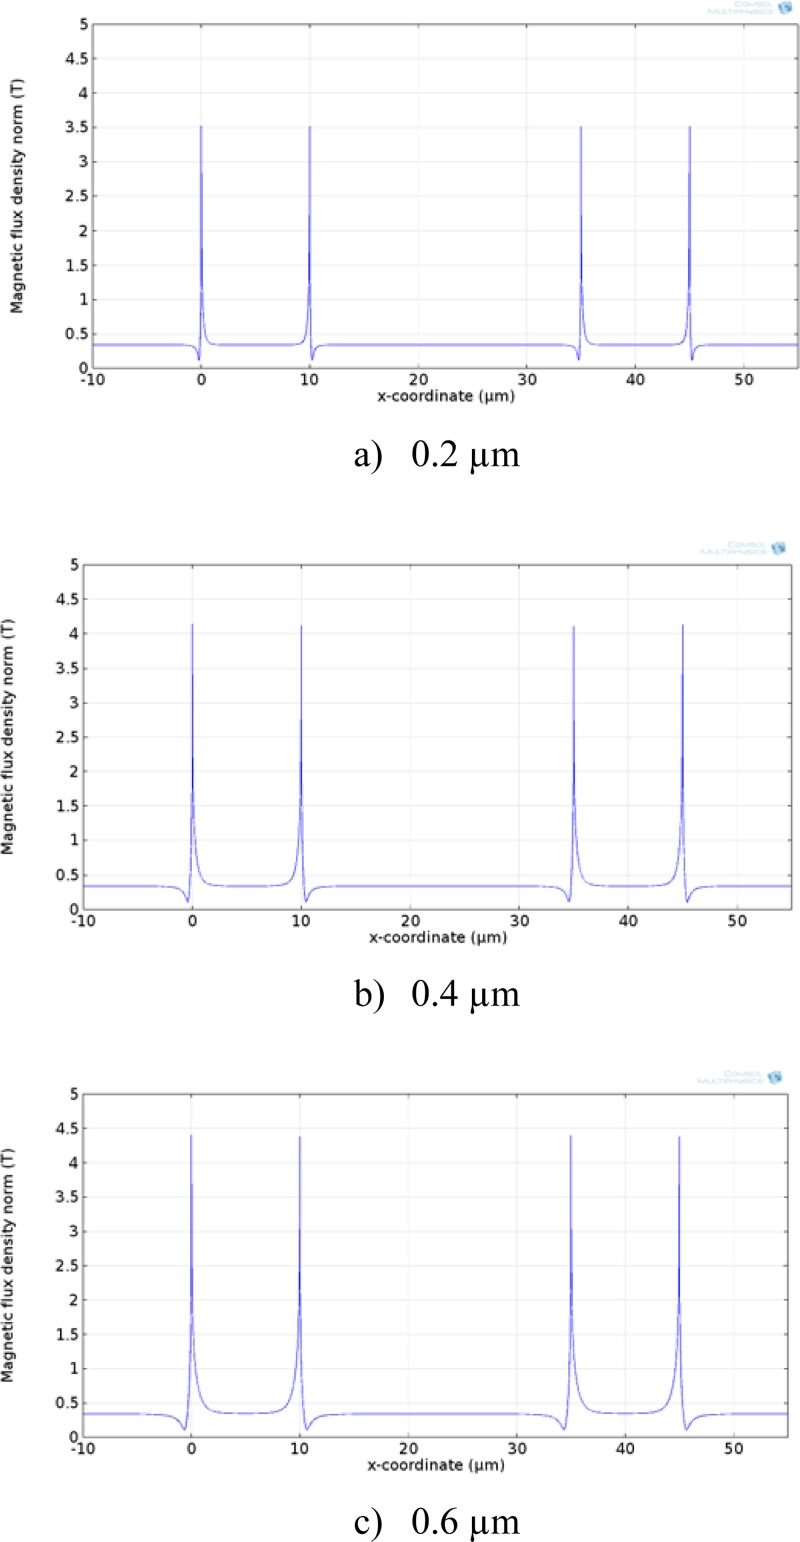
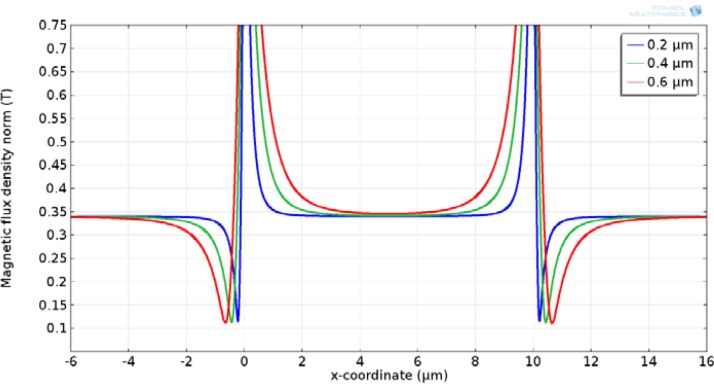
The effect of the nickel grid thickness on the magnetic flux is shown in Figs. 7 and 8. The results show that magnetic flux increases significantly at the edges of the nickel strips. This is an important design parameter since the purpose of the nickel grid is to create short-range magnetic gradients that are large enough to trap and immobilize magnetic beads once they reach the bottom surface of the device. While thicker nickel strips produce larger magnetic flux, they create physical barriers for flow. In addition, since the size of dynabead used for DNA isolation in this study was 2.8 μm, a thicker nickel grid could serve as trapping sites for dynabeads and more difficult to elute after the isolation. Thus, a nickel strip thickness of larger than 0.5 μm is not preferred. However, this issue is less significant when isolating large particles such as cells with sizes on the order of 10 μm.
FIG. 7.
Magnetic flux along the surface of the nickel grid. The magnitude of magnetic flux increases with increasing the nickel thickness. (a) 0.2 μm nickel thickness, (b) 0.4 μm nickel thickness, and (c) 0.6 μm nickel thickness.
FIG. 8.
An enlarged view of Fig. 7, depicting the variation of the magnetic flux at various nickel thicknesses.
Another parameter that was studied was the effect of nickel strip width, as well as the effect of the gap between nickel strips. The width was varied from 5 to 15 μm, while the gap ranged from 5 to 25 μm. The results (not shown) indicated that the width and gap between nickel strips had little or no effect on magnetic flux. However, smaller nickel strip width and spacing will result in a larger number of nickel edges per unit surface area. Thus, smaller nickel width and gap should be sought in order to increase the number of trapping sites and effectiveness of the device. However, the application and particle size will determine the minimum spacing. Ideally, the spacing between two nickel strips should be large enough to allow two rows of magnetic particles to be captured at the edges of the nickel strips.
EXPERIMENTAL RESULTS
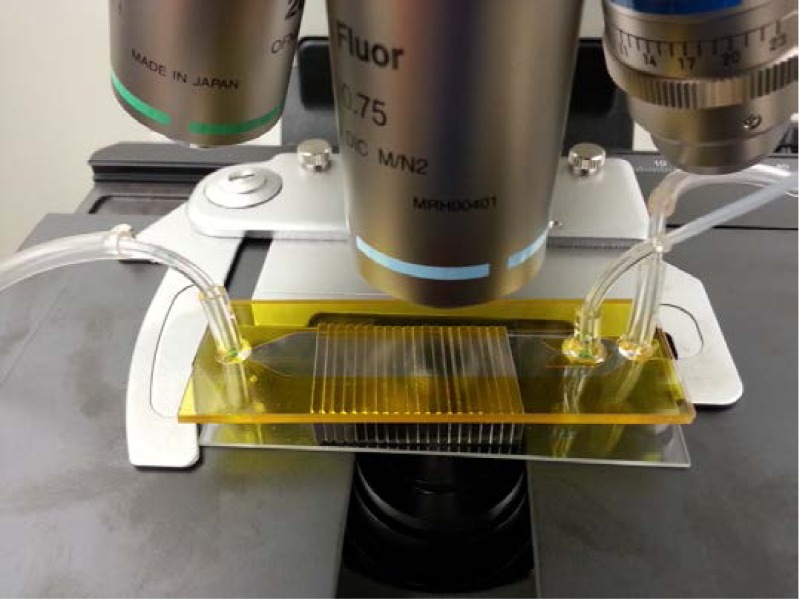
Using the results obtained from the parametric study, a microfluidic device was designed and fabricated. The device has a substrate thickness of 300 μm, a channel height of 100 μm, a nickel width of 10 μm, a nickel spacing of 25 μm, and a nickel thickness of 0.2 μm. A detailed description of the device fabrication and assembly has been described in an earlier publication and it is not repeated here for brevity.21 Briefly, the device consists of a glass substrate on which a nickel grid is deposited and patterned. The fluidic channels were cut into a double-sided polyimide film. The fluidic ports were drilled into another glass substrate. The glass substrates were then cleaned and bonded using a double-sided polyimide film. A photograph of the assembled device is shown in Fig. 9.
FIG. 9.
A photograph of an assembled device.
To begin an isolation experiment, the microfluidic device was first washed with de-ionised (DI) water, soaked with bovine serum albumin (BSA), and then rinsed with washing buffer. Dynabeads and DNA isolation reagents were purchased from Invitrogen (Carlsbad, CA). Physical properties of dynabeads are summarized in Table I. First, 100 μl of blood was mixed with the red blood cell (RBC) lysis buffer and incubated for 5 min at room temperature. Following RBC lysis, the sample was centrifuged for 30 s at 13 000 rpm and supernatant was discarded. The sample was then mixed with 200 μl dynabeads and incubated at room temperature for 5 min. After incubation, the sample (200 μl) was introduced into the microfluidic device at flow rates of 10, 20, 30, 40, and 50 ml/h using a milliGAT pump (Global FIA, Inc., WA). A buffer solution was simultaneously pumped into the device using a syringe pump at a flow rate of 5 ml/h. The buffer solution flow rate was kept constant for each sample flow rate. The continuous buffer flow prevents beads from sticking to the channel wall by focusing the sample on the center region of the channel. After isolation, the dynabeads were detached from the complex by incubation at 65 °C for 5 min. A buffer flush was then used to elute the isolated DNA from the trapping region to a collection tube for purity and separation efficiency analysis.
TABLE I.
Physical properties of dynabeads supplied with the DNA isolation kit.
| Property | Value |
|---|---|
| Bead size | 2.8 μm |
| Saturation magnetization | 13 A m2/kg (mass) and 20 kA/m (volume) |
| Magnetic susceptibility | 6 × 10⁻⁴ m3/kg |
| Density | 1600 kg/m3 |
The DNA purity and yield were determined by spectrophotometry method. The technique measures absorbance in the range of 230 nm–320 nm to detect possible contaminants present in the DNA sample. The DNA purity is estimated by calculating the absorbance at 260 nm divided by the absorbance at 280 nm. A pure DNA sample has an A260/A280 ratio of 2.0. A high-quality DNA sample, generally has an A260/A280 ratio between 1.7 and 1.9. The yield is typically 10–50 μg per 1 ml of blood. All absorbance measurements were performed using a Biophotometer Plus instrument (Eppendorf North America). Each experiment was repeated at least 3 times to ensure data accuracy and reproducibility.
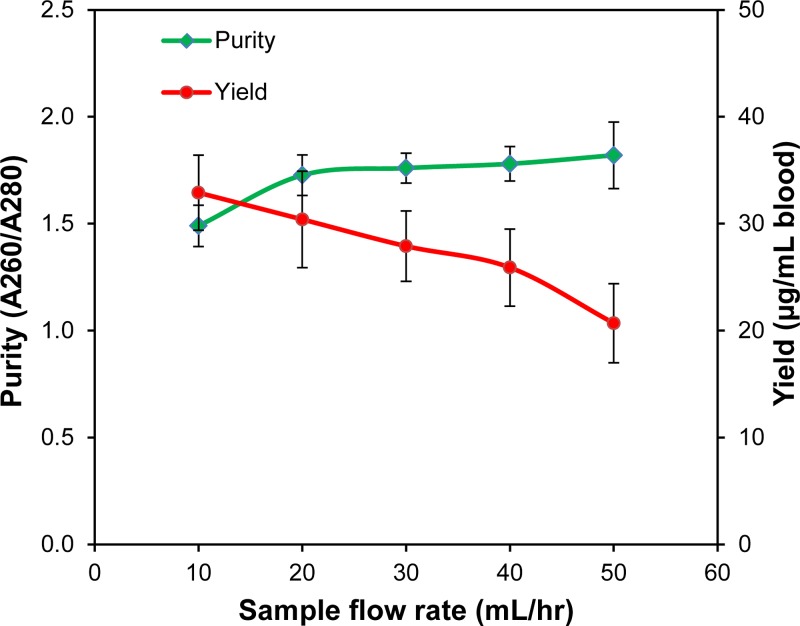
The DNA purity and separation yield results are shown in Fig. 10. As seen in the graph the purity rating is dependent on the sample flow rate, because as the flow rate increases, it is likely that less non-target cell waste is captured along with the DNA strands, thus improving purity. Additionally, the separation yield was found to decrease with increasing flow rate. This is due to the increase in drag force as the fluid velocity increases. A higher purity and yield performance is due to a combination of nearly single-layer trapping at the edges of the nickel grid and continuous buffer flush, which are unique features of our device.
FIG. 10.
Purity and yield of DNA isolation at various sample flow rates.
Figure 11 shows a comparison between the performance of our chip and a commercially available Dynal MPC. The error bars represent the standard deviation of the experiments. The DNA isolation experiments were performed at a sample flow rate of 20 ml/h and a buffer flow rate of 5 ml/h. Dynal MPC isolation was performed according to the manufacturer's protocol. Three DNA samples were isolated by each method. The total isolation process time using our chip was approximately 5 min (1 min isolation and a 5 min eluting) while the total process time with Dynal MPC isolation was about 15 min. The processing time for RBC lysis and DNA/Dynabead binding was the same for both methods. The data demonstrates that our chip consistently exceeds the performance of Dynal MPC in both purity and yield.
FIG. 11.

A comparison between the performance of our chip and a Dynal MPC.
CONCLUSIONS
In this study, a computational parametric study was performed to optimize a microfluidic device for DNA isolation using magnetophoresis. The effects of various parameters such as an array of permanent magnets, substrate thickness, channel height, nickel thickness, nickel width, and the spacing between the nickel strips were studied. Based on the results of the computational study, an optimized device was fabricated and tested to isolate DNA from blood. For the range of flow rates tested, a high purity performance of nearly 1.85 and a yield of up to 33 μg of DNA per ml of blood were obtained. This continuous flow microfluidic-based DNA isolation chip is more versatile than batch mode separation systems because its platform can be integrated with other instruments and diagnostic processes.
ACKNOWLEDGMENTS
This work was partially supported by a STEP grant from SIUE Office of Research and Projects and a RGGS grant supported by the SIUE Graduate School.
References
- 1.Pamme N., “ On-chip bioanalysis with magnetic particles,” Curr. Opin. Chem. Biol. 16, 436–443 (2012). 10.1016/j.cbpa.2012.05.181 [DOI] [PubMed] [Google Scholar]
- 2.Furlani E. P., Sahoo Y., Ng K. C., Wortman J. C., and Monk T. E., “ A model for predicting magnetic particle capture in a microfluidic bioseparator,” Biomed. Microdevices 9, 451–463 (2007). 10.1007/s10544-007-9050-x [DOI] [PubMed] [Google Scholar]
- 3.Adams J. D., Kim U., and Soh H. T., “ High throughput, multi-target magnetophoretic separation,” in Twelfth International Conference on Miniaturized Systems for Chemistry and Life Sciences (2008), pp. 1302–1304 [Google Scholar]
- 4.Khashan S. A., Elnajjar E., and Haik Y., “ Numerical simulation of the continuous biomagnetic separation in a two-dimensional channel,” Int. J. Multiphase Flow 37, 947–955 (2011). 10.1016/j.ijmultiphaseflow.2011.05.004 [DOI] [Google Scholar]
- 5.Sinha A., Ganguly R., Anindya K. D., and Ishwar K. P., “ Single magnetic particle dynamics in a microchannel,” Phys. Fluids 19, 117102 (2007). 10.1063/1.2780191 [DOI] [Google Scholar]
- 6.Mohanty S., Baier T., and Schönfeld F., “ CFD Modelling of Cell Capture in BioMEMs,” Proceedings of the World Congress on Engineering and Computer Science (2008), pp. 1–5 [Google Scholar]
- 7.Furlani E. P., “ Magnetophoretic separation of blood cells at the microscale,” J. Phys. D: Appl. Phys. 40, 1313–1319 (2007). 10.1088/0022-3727/40/5/001 [DOI] [Google Scholar]
- 8.Zborowski M., Ostera G. R., Moore L. R., Miliron S., Chalmers J. J., and Schechter A. N., “ Red blood cell magnetophoresis,” Biophys. J. 84, 2638–2645 (2003). 10.1016/S0006-3495(03)75069-3 [DOI] [PMC free article] [PubMed] [Google Scholar]
- 9.Nandy K., Chaudhuri S., Ganguly R., and Puri I. K., “ Analytical model for the magnetophoretic capture of magnetic microspheres in microfluidic devices,” J. Magn. Magn. Mater. 320, 1398–1405 (2008). 10.1016/j.jmmm.2007.11.024 [DOI] [Google Scholar]
- 10.Keaveny E. E. and Maxey M. R., “ Modeling the magnetic interactions between paramagnetic beads in magnetorheological fluids,” J. Comput. Phys. 227, 9554–9571 (2008). 10.1016/j.jcp.2008.07.008 [DOI] [Google Scholar]
- 11.Tarn M. D., Peyman S. A., Robert D., Iles A., Wilhelm C., and Pamme N., “ The importance of particle type selection and temperature control for on-chip free-flow magnetophoresis,” J. Magn. Magn. Mater. 321, 4115–4122 (2009). 10.1016/j.jmmm.2009.08.016 [DOI] [Google Scholar]
- 12.Pamme N. and Wilhelm C., “ Continuous sorting of magnetic cells via on-chip free-flow magnetophoresis,” Lab Chip 6, 974–980 (2006). 10.1039/b604542a [DOI] [PubMed] [Google Scholar]
- 13.Bhagat A. A. S., Bow H., Hou H. W., Tan S. J., Han J., and Lim C. T., “ Microfluidics for cell separation,” Med. Biol. Eng. Comput. 48, 999–1014 (2010). 10.1007/s11517-010-0611-4 [DOI] [PubMed] [Google Scholar]
- 14.Pamme N., “ Magnetism and microfluidics,” Lab Chip 6, 24–38 (2006). 10.1039/b513005k [DOI] [PubMed] [Google Scholar]
- 15.Pratt E. D., Huang C., Hawkings B. G., Gleghorn J. P., and Kirby B. J., “ Rare cell capture in microfluidic devices,” Chem. Eng. Sci. 66(7), 1508–1522 (2011). 10.1016/j.ces.2010.09.012 [DOI] [PMC free article] [PubMed] [Google Scholar]
- 16.Autebert J., Coudert B., Bidard F. C., Pierga J. Y., Descroix S., Malaquin L., and Vivoy J. L., “ Microfluidic: An innovative tool for efficient cell sorting,” Methods 57(3), 297–307 (2012). 10.1016/j.ymeth.2012.07.002 [DOI] [PubMed] [Google Scholar]
- 17.Inglis D. W., Riehn R., Austin R. H., and Sturm J. C., “ Continuous microfluidic immunomagnetic cell separation,” Appl. Phys. Lett. 85(21), 5093–5095 (2004). 10.1063/1.1823015 [DOI] [Google Scholar]
- 18.Pamme N., “ Continuous flow separations in microfluidic devices,” Lab Chip 7, 1644–1659 (2007). 10.1039/b712784g [DOI] [PubMed] [Google Scholar]
- 19.Karle M., Miwi J., Czilwik G., Auwärter V., Roth G., Zengerle R., and von Stetten F., “ Continuous microfluidic DNA extraction using phase-transfer magnetophoresis,” Lab Chip 10(23), 3284–3290 (2010). 10.1039/c0lc00129e [DOI] [PubMed] [Google Scholar]
- 20.See http://www.spinomix.com/-MagPhase for more information about the MagPhase™ instrument.
- 21.Darabi J. and Guo C., “ On-chip magnetophoretic isolation of CD4 + T cells from blood,” Biomicrofluidics 7, 054106 (2013). 10.1063/1.4821628 [DOI] [PMC free article] [PubMed] [Google Scholar]
- 22.Jung Y., Choi Y., Han K. H., and Frazier A. B., “ Six-stage cascade paramagnetic mode magnetophoretic separation system for human blood samples,” Biomed. Microdevices 12, 637–645 (2010). 10.1007/s10544-010-9416-3 [DOI] [PubMed] [Google Scholar]
- 23.Liang L. and Xuan X., “ Continuous sheath-free magnetic separation of particles in a U-shaped microchannel,” Biomicrofluidics 6, 044106 (2012). 10.1063/1.4765335 [DOI] [PMC free article] [PubMed] [Google Scholar]
- 24.Peyman S. A., Iles A., and Pamme N., “ Mobile magnetic particles as solid-supports for rapid surface-based bioanalysis in continuous flow,” Lab Chip 9, 3110–3117 (2009). 10.1039/b904724g [DOI] [PubMed] [Google Scholar]
- 25.Tarn M. D., Hirota N., Iles A., and Pamme N., “ On-chip diamagnetic repulsion in continuous flow,” Sci. Technol. Adv. Mater. 10, 014611 (2009). 10.1088/1468-6996/10/1/014611 [DOI] [PMC free article] [PubMed] [Google Scholar]


