Abstract
The effects of gradients of bioactive molecules on the cell microenvironment are crucial in several biological processes, such as chemotaxis, angiogenesis, and tumor progression. The elucidation of the basic mechanisms regulating cell responses to gradients requires a tight control of the spatio-temporal features of such gradients. Microfluidics integrating 3D gels are useful tools to fulfill this requirement. However, even tiny flaws in the design or in the fabrication process may severely impair microenvironmental control, thus leading to inconsistent results. Here, we report a sequence of actions aimed at the design and fabrication of a reliable and robust microfluidic device integrated with collagen gel for cell culturing in 3D, subjected to a predetermined gradient of biomolecular signals. In particular, we developed a simple and effective solution to the frequently occurring technical problems of gas bubble formation and 3D matrix collapsing or detaching from the walls. The device here proposed, in Polydimethylsiloxane, was designed to improve the stability of the cell-laden hydrogel, where bubble deprived conditioning media flow laterally to the gel. We report the correct procedure to fill the device with the cell populated gel avoiding the entrapment of gas bubbles, yet maintaining cell viability. Numerical simulations and experiments with fluorescent probes demonstrated the establishment and stability of a concentration gradient across the gel. Finally, chemotaxis experiments of human Mesenchymal Stem Cells under the effects of Bone Morphogenetic Protein-2 gradients were performed in order to demonstrate the efficacy of the system in controlling cell microenvironment. The proposed procedure is sufficiently versatile and simple to be used also for different device geometries or experimental setups.
I. INTRODUCTION
Understanding the effects of gradients of soluble molecules on the cellular microenvironment is of great importance to unravel specialized cellular behaviors such as chemotaxis, angiogenesis, embryo development, and tumor progression.1–3 The implementation of such gradients requires the use of specifically designed culturing devices; in the past decades several examples have been reported in the literature. Among these, Boyden chambers/transwell assays,4 Dunn chambers,5 and Zigmond chambers6 have been largely used. These systems, although instrumental in shaping our knowledge on the interplay between signal gradients and cells, present some drawbacks, mainly due to intrinsic limitations in controlling gradient features both in time and space. Furthermore, they require the use of large volumes of conditioning media and are not readily scalable to native biological environments or for other selected applications. Recently, rapid advancements in microfluidics have provided new tools for a much more accurate control of the cellular microenvironment in terms of soluble molecules delivery. Microfluidic devices (μFds) proved to be very effective in establishing gradients of soluble biomolecules. In particular, devices exploiting the diffusion of molecules between juxtaposed parallel laminar streams or capable of mixing streams of different compositions proved to be effective in generating gradients with tunable features in 2D.7–9 However, most of the mammalian cells are embedded in a 3D environment in vivo. This brings in a new level of complexity for the implementation of a 3D culture in microfluidics. Several elegant examples of 3D culture in μFds have in fact been recently reported. For example, Saadi et al. developed a “ladder chamber” device in which a 3D cell populated gel separates two conditioning streams and gel is held in place by transverse ridges.10 This allows the formation of a concentration gradient in the 3D gel. An evolution of such a concept was reported in the works of Chung and colleagues, who fabricated microfluidic networks to study angiogenesis constituted by arrays of parallel channels in which the biopolymeric matrix is held in place by micropillars.11,12
These works clearly demonstrated the possibility of controlling cell microenvironment in 3D through an adequate confinement of biopolymeric matrices in μFds. Different devices based on this approach have been developed in order to study and unravel the intricate cell-signal interactions that occur in vivo.13–15 Although these μFds may differ in terms of shape, dimensions, and culturing conditions, they all rely on the resistance effects of a cell laden biopolymeric gel to the flow of soluble molecules of interest. The presence of short cuts within the cell containing 3D matrix affects the spatial distribution of molecules and matrix collapse or the local densification impairs the diffusion mechanisms. Therefore, fluid-dynamic based problems or non-controllable interactions between the device and the matrix can potentially cause the distribution of biomacromolecules to unpredictably evolve towards states that can be very different from those originally intended.
In the present work, we report a sequence of actions to undertake in order to fabricate a reliable and robust microfluidic device for the culture of mammalian cells in 3D subjected to a constant gradient of biomolecular signals. In particular, we highlight the most frequent issues that can arise from non-optimized designs, fabrication, and testing procedure, eventually leading to unpredictable spatio-temporal evolutions of the gradient and propose technical solutions to these issues. Finally, in order to assess the efficacy of the proposed method, we created constant gradients of bone morphogenetic protein 2 (BMP-2) within a 3D collagen gel and report some preliminary results on the effects of gradient features on stem cell migration.
II. MATERIALS AND METHODS
A. Design, simulation, and fabrication of the μFd
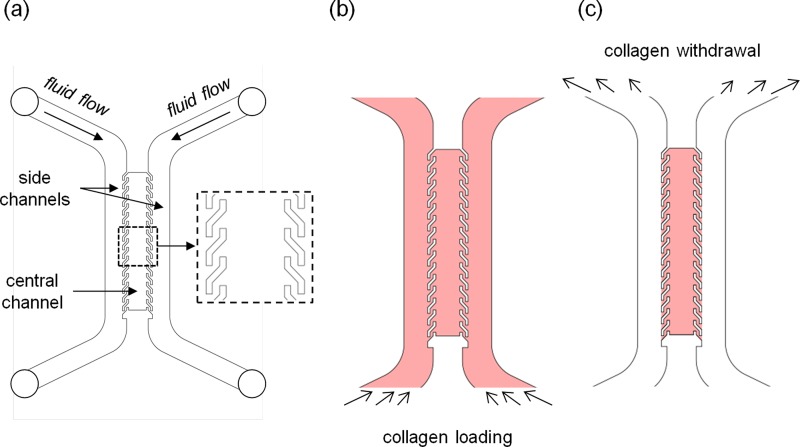
The basic design of the μFd consists of three parallel channels: a central channel containing the cell laden hydrogel, and two identical channels, juxtaposed to the lateral edges of the hydrogel, in which culturing or conditioning media flow. The channels will be referred to as central channel and side channels throughout the text, respectively [Fig. 1(a)]. In order to cultivate a considerable number of cells, yet minimizing possible cell-cell contacts (sparse cell culture) we designed the central channel, 1 mm in width and 300 μm in height. Central and side channels were divided by an array of S-shaped micropillars (100 μm in width, 300 μm in height, and 750 μm in unilinear length). In order to compare the effectiveness of the above geometry with that of conventional and straight pillars, we designed an identical device with an array of rectangular pillars (250 μm long and 100 μm wide) separated by a 250 μm gap.
FIG. 1.
(a) Schematic of the three channel μFd. Inset, magnification of the S-shaped pillars; (b) collagen solution loading process; and (c) collagen solution removal from the side channels.
In order to verify whether the proposed device design allowed for the establishment of concentration gradients in a reasonable timeframe, we performed numerical simulations. The fluid dynamics and the macromolecular transport in the hydrogel were simulated through finite element analysis using COMSOL (COMSOL Inc.). In particular, we combined the incompressible Navier-Stokes equation and the transient diffusion/convection model. For the molecular transport we chose to simulate the diffusion of a 10 kDa molecule with a diffusion coefficient of 2 × 10⁻⁶ cm2/s in collagen gel.16 We assumed that the chemical concentration within the two side channels is always reported in terms of normalized values, thus varying from 0 to 1. The density and the dynamic viscosity of the fluid in the side channels were 1000 kg/m3 and 10−3 kg/m/s, respectively. The inlet fluid velocity for both streams was set at the mean linear velocity obtained by dividing the volumetric flow rate (1 μl/min) by the cross-sectional area of the side channel.
The μFd was created by replica molding technique. The μFd master was carved onto a Poly(methyl methacrylate) (PMMA, Goodfellow) slab with a micromilling machine (Minitech CNC Mini-Mill). Polydimethylsiloxane (PDMS, Sylgard 184, Dow Corning) was prepared on a 10:1 w/w basis (polymer to curing agent), mixed, and degassed under vacuum. The solution was poured onto the master and heated in oven at 70 °C for 1 h. Afterwards, solid PDMS was peeled off the PMMA master. The holes for the fluidic connectors were punched at the end of the side channels with a tissue biopsy puncher (1.5 mm diameter, Kai Industries), 1 mm thick microscope glass slides were bonded to the open side of the PDMS device. To this aim, the PDMS was treated with oxygen plasma for 1 min at 50 W in a plasma oven (Plasma Femto, Diener). The glass was placed onto the PDMS and the sandwich was heated 70 °C for 30 min to stabilize the bonding between the PDMS and glass. Afterwards, the μFd was sterilized by placing it under UV light overnight.
B. μFd loading with collagen
Prior to μFd filling with the biopolymeric gel, internal surfaces of the μFd were coated with a collagen solution. Briefly, a 50 μg/ml type I collagen solution (BD Biosciences) was loaded into the device. The device was then incubated at room temperature for 1 h, according to the manufacturer's standard coating protocol, then the proteic solution was aspirated and the channels were washed with phosphate buffer solution (PBS). After such coating, a 3 mg/ml type I collagen was prepared according to the manufacturer's instructions and was kept at 4 °C. The μFd was completely filled with the collagen solution by injecting the solution from the inlets as depicted in Figure 1(b). Gas bubbles entrapped within the collagen solution were removed by applying an overpressure. Briefly, three ports of the μFd (one inlet and the outlets) were closed with PDMS plugs and the collagen solution was forced through the device with a syringe pump (Harvard Apparatus, Standard Infuse/Withdraw Harvard 33 Twin) at 0.1 ml/min. Once the gas bubbles disappeared, the excess collagen solution in the side channels was removed by sucking it up with a micropipette from the inlet, as depicted in Figure 1(c). The entire procedure was performed while the device was placed on a water/ice bath, to prevent collagen fibrillogenesis. Subsequently, the device was transferred for 15 min at 37 °C in a humidified incubator to allow the fibrillogenesis. The side channels were then loaded with PBS to prevent hydrogel dehydration and the device was placed back in the incubator for additional 15 min to complete the polymerization process.
C. Gradient characterization
To monitor gradient establishment and evolution we used a soluble fluorescent probe. In detail, after the loading and polymerization steps, a 10 μg/ml solution of dextran rhodamine (10 kDa, Molecular Probes) in PBS was injected with a syringe pump in one side channel (source), whereas pure PBS was injected in the other side channel (sink). Flow rate was set at 1 μl/min for both solutions. The device was placed under a confocal laser scanning microscope (LSM510, Zeiss) and the fluorescence images were collected by exciting the channels with a HeNe laser (543 nm) and collecting the emission with a high pass filter (633 nm). Images were acquired every 30 min for 24 h. Time lapse videos were analyzed using ImageJ with which intensity profiles of grayscale images were extracted. In particular, the profiles were obtained by averaging over the cross sections constituting the central channel.
D. Cell cultures and chemotaxis experiment
Human Mesenchymal Stem Cells (hMSCs) were purchased from Lonza and were expanded in alpha Modified Eagle's medium (αMEM, Bio-Wittaker) containing 10% (v/v) foetal bovine serum (FBS, HyClone), 100 U/ml penicillin, 0.1 mg/ml streptomycin, and 2 mM l-glutamine (Sigma). Cell cultures were kept in a humidified atmosphere at 37 °C and 5% of CO2 and the medium was replaced every 3 days. Cells were trypsinized by standard protocol and washed in PBS and resuspended in collagen solution (3 mg/ml) at the concentration 105 cells/ml. In order to maintain cell viability, the collagen-cell solution was injected in a μFd previously filled with a bubble-free collagen solution. In this case, the cell-free solution allowed the cell-laden solution to penetrate within the device without the formation of gas bubbles. Afterwards, to empty the lateral channels the device was treated as previously described, with the only exception of using medium with 5% FBS in the side channels, instead of pure PBS. The device was then placed in a humidified incubator for 12 h at 37 °C.
Chemotactic gradients were generated by pumping with a syringe pump culture medium supplemented with BMP-2 (Peprotech) in one side channel (source) and medium in the other channel (sink). To ensure proper gas exchange with the surrounding environment, gas permeable silicone tubing (Goodfellow) was used. Three different growth factor concentrations were employed, namely, 1, 10, and 100 ng/ml, in order to obtain gradients with different features. Conversely, control experiments characterized by uniform distribution of BMP-2 (no gradients) were performed by injecting solutions containing the same factor concentration in both channels. Flow rates of the media were set at 1 μl/min. Chemotaxis experiments were performed with an Olympus IX 50 optical inverted microscope equipped with a mini incubator on a motorized stage (PRIOR). The μFd and the tubing were placed in the mini incubator and images of the central channel were collected with a 4× magnification objective and a digital camera (CoolSnap Camera, Photometrics) thus obtaining 1.6 × 1.2 mm grayscale images. These were acquired every 10 min for 24 h. Cell trajectories were extracted from the time lapse videos analyzed with Metamorph (Molecular Devices). Drift speed of the cell population along the gradient (SD) and the chemotactic index (CI)17 were chosen as the representative parameters to quantify gradient effects on hMSC migration. SD was estimated by plotting the average position of the cell population along the gradient direction against time. SD was then evaluated by fitting the average position of the cell population with a straight line. CI was defined as the ratio of length of the cell trajectory with the magnitude of the head-to-tail vector of the trajectory. SD values were considered to be significantly different if the corresponding 95% confidence intervals were non-overlapping. Kruskal-Wallis test was performed to assess significant differences among CI values. Calculations were performed with Matlab (The Matworks).
III. RESULTS AND DISCUSSION
Microfluidic devices that allow cell culturing in 3D networks are usually designed in order to entrap the cell-laden hydrogel between arrays of microposts, while conditioning fluids or culturing media flow laterally.11–15
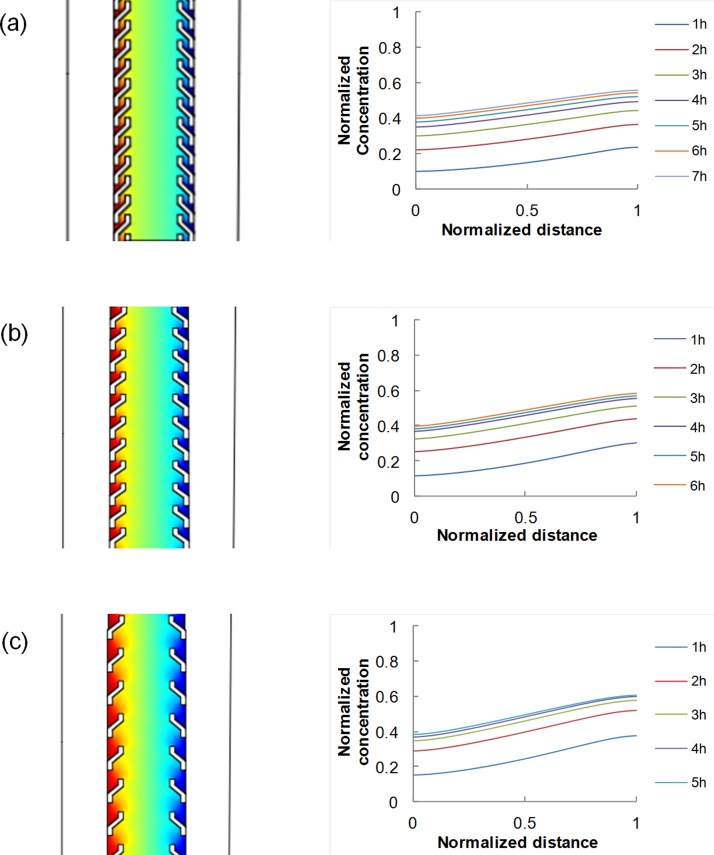
To verify that the device design with non-straight pillars allows the formation of a concentration gradient within the central channel, we performed preliminary numerical simulations in COMSOL. Generally, the generation and maintenance of a stable concentration gradient between the source and the sink depend on the diffusion coefficient of the diffusing molecule within the hydrogel, as well as on the geometrical features of the device. We first simulated the diffusion of 10 kDa dextran molecule, having a diffusion coefficient of 2 × 10⁻⁶ cm2/s in collagen gel,16 in the case of 450 μm gap between consecutive pillars, and found that a stable gradient established after around 6 h [Fig. 2(a)]. Second, we assessed the influence of pillar spacing on gradient features. In particular, we simulated the diffusion of the dextran molecule for the case of pillar spacing of 650 μm or 900 μm. In these cases, a gradient was established in approximately 5 h and 4 h, respectively [Figs. 2(b) and 2(c)]. Gradient values are summarized in Table I. The slope was affected by pillar positioning.
FIG. 2.
Concentration profiles of 10 kDa dextran molecule having diffusion coefficient of 2 × 10⁻⁶ cm2/s in collagen gel, as evaluated from the numerical simulation with COMSOL, for three different pillar spacing: 450 μm (a); 650 μm (b); and 900 μm (c).
TABLE I.
Steady state gradient, reported in terms of normalized values, for different pillar spacing.
| Pillar spacing | 450 μm | 650 μm | 900 μm |
|---|---|---|---|
| Gradient | 0.16 | 0.20 | 0.25 |
All the procedures reported in the following, concerning device fabrication and testing, refer to the geometry of Figure 2(a). Such procedures, however, are of general validity, and can be extended to the other designs.
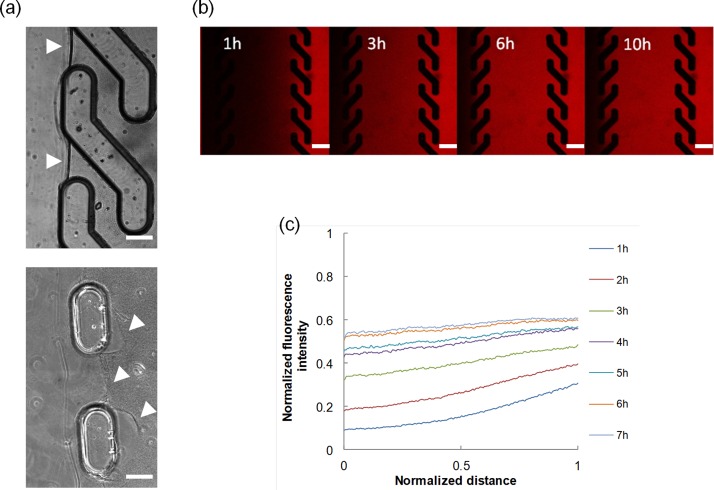
For the practical implementation of the proposed design, improving the stability of the gel within the PDMS housing is central. In fact, detachments or gel disruptions may cause fluids to penetrate within the gel compartment, thus significantly altering the microenvironment in a non-controllable manner. We addressed the issue in different ways. First, we performed a collagen pre-coating of the inner surfaces of the microfluidic network, prior to the hydrogel loading phase. This caused collagen molecules to firmly adsorb onto the PDMS surface, which constituted nucleation points for the collagen fibrillogenesis to occur. Indeed, we observed a strong interaction between the PDMS and the proteic gel, with no evident formation of gaps in between. Then, we selected the geometrical features of the channels to be sufficiently large to minimize the shear stress at the fluid-hydrogel interface. In particular, by using the Hagen-Poiseuille equation for a rectangular conduit we estimated the shear stress at the collagen interface to be approximately 4 mPa—much lower than the shear strength of the collagen gel.18 Additionally, we changed the geometry of the pillars in order to increase the contact area, yet allowing macromolecules to diffuse within the hydrogel. Pillars were shaped in the form of an “S,” which physically locked the hydrogel because it penetrates within the coves of the pillars. Furthermore, the peculiar S-shape enabled a complete and effective removal of the hydrogel in excess (during the hydrogel loading/unloading phase) since the off-axis winglets of the pillars deflected the fluid flow from penetrating inside the central channel, which would have damaged the hydrogel [Fig. 1(c)]. In contrast, we observed gel-pillars detachment in μFds with rectangular pillars in 40% of the cases, even when a collagen precoating was performed [Fig. 3(a)]. Occasionally, small air bubbles remained entrapped within the gel solution. Although their dimension was initially very small (∼100 μm), the bubbles invariably grew in time owing to the pressure gradients that were established during the experiment.19 The expansion was at times so severe as to cause the gel to collapse, as reported in supplementary Video S1 (see supplementary material; Ref. 20). Therefore, in order to remove the entrapped bubbles, we forced the collagen solution from one outlet, while the other ports were kept closed with silicone plugs. Owing to the good gas permeability of the PDMS, bubbles under pressure permeate through the PDMS walls.21 The whole procedure took a few minutes and did not affect μFd stability. Additionally, cell viability was maintained since the collagen-cell solution was injected in a pre-filled and bubble-free device, thus the solution pushed out the pre-existing one and such a continuity avoided gas bubble formation.
FIG. 3.
(a) Stability of the collagen gel matrix between S-shaped (top) and straight pillars (bottom). White arrowhead points towards the gel-fluid boundary. Bar 100 μm. (b) Diffusion of 10 kDa fluorescently labelled dextran. The images were collected with a confocal laser scanning microscope. Bar 200 μm. (c) Evolution of the fluorescent intensity profiles with time.
At this stage the device was filled, degassed and deprived of the hydrogel in excess, and was therefore ready to be used as a gradient generator. We set up an experiment to monitor the diffusion of 10 kDa fluorescently labelled dextran from the source to the sink, using time lapse video confocal microscopy. Temporal evolution of the diffusion of the fluorescent molecule is reported in Figure 3(b), whereas the quantitative analysis of the intensity profiles is reported in Figure 3(c), which is in good agreement with the numerical simulation (see Figure 2(a)). Deviations from the predicted gradient evolution might possibly reside in some dextran-collagen interactions occurring during diffusion.
Cell cultures require the use of gas-saturated media that are necessary to maintain pH and oxygen concentration at physiologic values. When cultures are performed in microfluidics, media are usually contained in tubes and sealed reservoirs. For long term experiments, gas may separate from the medium, thus creating bubbles. These, owing to the low flow rates (1 μl/min), reside in the side channels for long times, thus altering the gradient features within the gel. In fact, Figure 4(a) shows the changes in the fluorescence intensity of labelled dextran when a gas bubbles passes through the side channel. Figure 4(b) shows that the establishment of a steady-state gradient occurred in approximately 6 h, but its features were altered by the presence of a gas bubble (which in the experiment crossed the side channel at 9 h).
FIG. 4.
(a) Variation in the diffusion of 10 kDa fluorescently labelled dextran arising from the presence of a gas bubble in the side channel. (b) Evolution of the fluorescent intensity profiles of 10 kDa fluorescently labelled dextran diffusing in the collagen gel. Profiles were calculated on the frames of Video 2. Note the change in slope occurring at 10 h, due to the presence of a gas bubble in the side channel. (Multimedia view) [URL: http://dx.doi.org/10.1063/1.4893913.1]
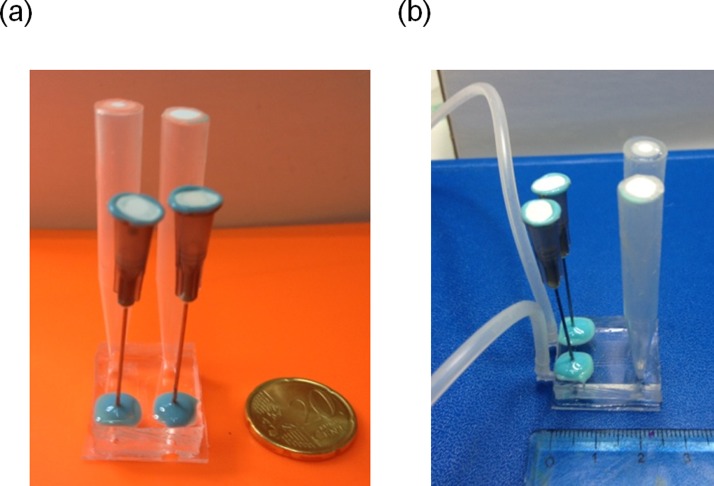
Therefore, gas bubbles must be separated from the fluid stream before they enter the lateral channels. To this aim, we added two bubble traps in the form of a gas vent, one per each inlet. The trap consisted in a cylindrical hole (2.5 mm in diameter and 2.5 mm in height) punched in correspondence of the side channel ports. The hole was sealed with a silicone membrane through which a syringe needle was inserted. The connector above the needle was capped with a filter (0.22 nm pore size), to prevent bacterial contamination. Figure 5 shows the μFd in its final configuration.
FIG. 5.
(a) μFd equipped with the bubble trap and medium reservoirs. The device can be contained in a standard 35 mm Petri dish; (b) μFd in its final configuration.
Finally, to validate the device, we set up a chemotaxis experiment of hMSC subjected to linear gradients of BMP-2. Indeed, the understanding of the effect of chemotactic gradients on cell motility requires a tight control of the gradient features over a large sample area and for sufficiently long time frames. It should be emphasized that cells, and more specifically primary cells, display heterogeneous responses to concentration gradients of soluble factors. Therefore, in order to draw definitive conclusions on cell behaviour during chemotaxis, a statistically relevant number of cells must be tracked for long times under controlled conditions. This means that the area for cell tracking must be large enough to contain at least 100 isolated cells, and that the gradient features must be stable during the experiment, and already known. The growth factor BMP-2 has been widely studied as a potent signalling molecule that regulates bone regeneration in vivo, and is often used in bone tissue engineering.22 It also showed chemotactic effect in vitro on different cell types, among which are osteoblastic cells,23 bone marrow stem cells,24 and microvascular endothelial cells.25 However, the effect of specific presentation modes of the signal BMP-2 on cell migration in a 3D environment is not entirely known. The microfluidic chamber we developed represents an ideal platform to address this issue.
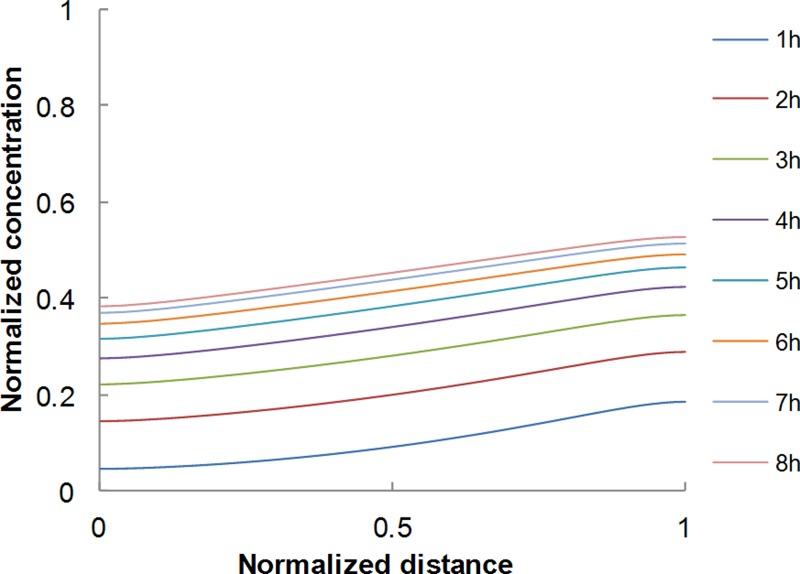
hMSC cells cultivated in the μFd were subjected to concentration gradients of BMP-2. Three different BMP-2 concentrations used in the side channel were 1, 10, and 100 ng/ml. The corresponding gradient values at steady state and the time needed to reach the steady state were all computed on the basis of numerical simulations akin to those presented above. The diffusion coefficient of BMP-2 in collagen needed in the simulations was extrapolated from the works of Vasaturo et al.,16 Vickerman et al.,13 and Ramanujan et al.26 on dextran of different molecular weights (10, 40, and 70 kDa, respectively), the molecular weight of BMP-2 being 24 kDa. Figure 6 reports the temporal evolution of the (normalized) concentration profile of BMP-2, evaluated with the numerical simulations. It was seen that steady state conditions were reached in around 7 h. The steady state gradient values are 0.16 ng/ml/mm, 1.6 ng/ml/mm, and 16 ng/ml/mm corresponding to the three BMP-2 concentrations examined. Cells were tracked for 24 h and the central channel was divided in two halves, one closer to the BMP-2 source and the other closer to the sink. In these regions, the average steady state BMP-2 concentrations were different.
FIG. 6.
BMP-2 concentration profiles evaluated from numerical simulations.
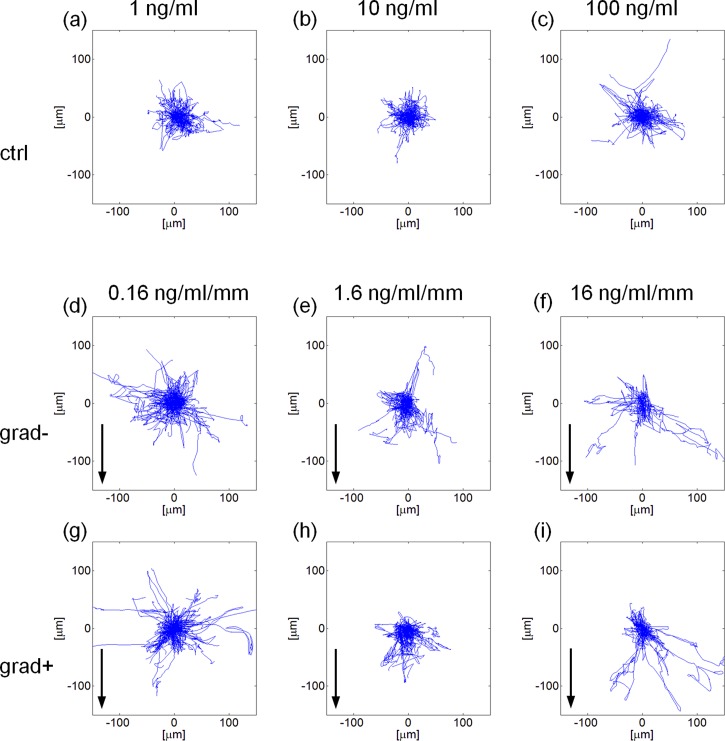
In the following, we refer to grad+ or grad− for the regions at higher or lower BMP-2 concentration, respectively. Tracking cells in the two compartments allowed us to obtain information on the synergistic effect of gradient slope and local average concentration of BMP-2 on cell migration. The experimental conditions we monitored are reported in Table II. Windrose plots of the hMSCs trajectories are reported in Figure 7. hMSC trajectories are reported in Figure 7 in the form of windrose plots, i.e., plots in which all the trajectories start from a common origin.
TABLE II.
Average BMP-2 concentration (ng/ml) in the two microfluidic compartments.
| Gradient slope | 0.16 (ng/ml/mm) | 1.6 (ng/ml/mm) | 16 (ng/ml/mm) |
|---|---|---|---|
| grad+ | 0.54 | 5.4 | 54 |
| grad− | 0.46 | 4.6 | 46 |
FIG. 7.
Windrose plots of the trajectories described in case of a uniform concentration of BMP-2 (a)–(c) or in presence of a gradient thereof (d)–(i). BMP-2 source is at the bottom of the plots and arrows indicate the gradient direction. The terms grad− or grad+ refer to cells closer to the factor sink or source, respectively. Each plot refers to a 300 × 300 μm area.
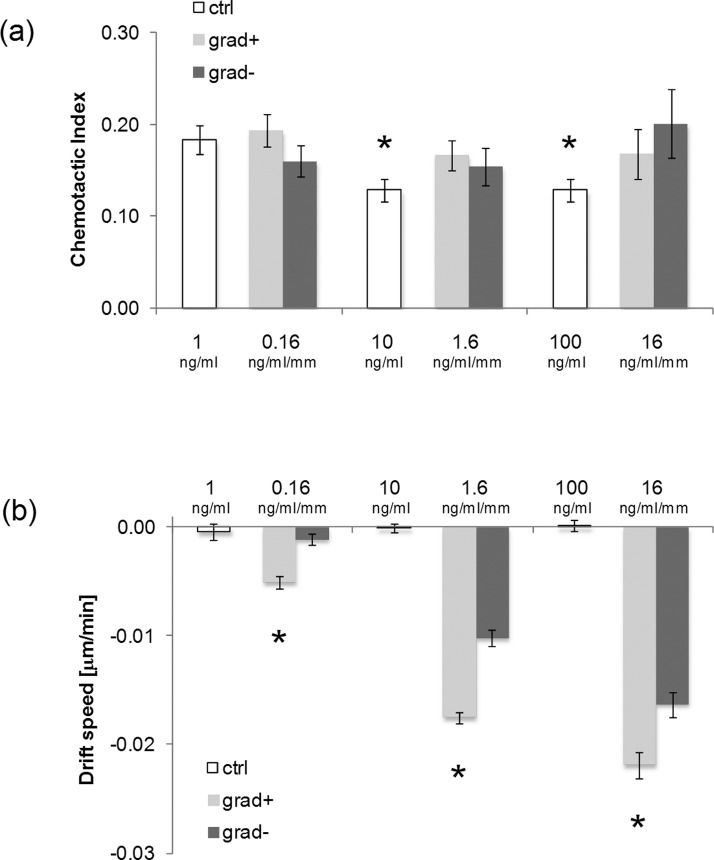
In the presence of a uniform concentration of BMP-2, cell trajectories were isotropically distributed [Figs. 7(a)–7(c)]. When the BMP-2 gradient was established, cells moved towards the zones with higher BMP-2 concentrations. This was particularly evident for the −1.6 ng·ml−1 mm−1, −16 ng·ml−1 mm−1 gradients, in which cases cell trajectories were stretched towards the BMP-2 source [Figs. 7(e) and 7(f) and Figs. 7(h) and 7(i)]. To quantify the effects of gradient features on cell migration we evaluated the chemotactic index and the cell population drift speed. The former provides an estimate on how effective cell motion is, i.e., CI close to 0 denotes a random motility, whereas CI ∼ 1 implies that a cell describes a nearly straight path. This parameter, however, does not convey any directional meaning. Conversely, drift speed is the cell population average speed towards the chemotactic source. Interestingly, we found that the increase in the uniform concentration of BMP-2 from 1 ng/ml to 10 or 100 ng/ml forced the cells to move more randomly, i.e., lower CI values. A more effective cell migration was recovered as soon as the signal gradient was established, irrespective of the relative position of cells with respect to the factor source [Fig. 8(a)]. Factor gradient had a profound effect on drift speed. In control experiments, i.e., for uniform presentation of BMP-2, SD was not significantly different from zero. In the case of signal gradients, a non-zero drift speed was instead clearly observed. In particular, SD increased with BMP-2 gradient values in a dose dependent manner, and the highest speed value was recorded in the −16 ng·ml−1 mm−1 setup for the cells closest to the factor sink [Fig. 8(b)]. The speed was invariably higher for cells closer to the factor than for those closer to the sink. In conclusion, not only BMP-2 gradients but also local factor concentrations have a major role in determining cell migration.
FIG. 8.
(a) Bar chart of the CI values in case of uniform presentation of BMP-2 (white columns) or gradients (grey columns). Asterisk denotes a significant difference with respect to the uniform 1 ng/ml case (p < 0.05). Error bars represent s.e.m.; (b) bar chart of the SD values in case of uniform presentation of BMP-2 (white columns) or gradients (grey columns). In each group, asterisk denotes a significant difference with respect to the grad− case (p < 0.05). Error bars represent 95% confidence interval.
IV. CONCLUSIONS
In this paper, we reported a method for the design, fabrication, and testing of a microfluidic device for controlling cell microenvironment in three dimensional biopolymeric gels. The practical actions we developed are focused to make the device as stable as possible thus allowing us to achieve a high degree of consistency and confidence in the experimental procedure. We addressed three potential sources of inconsistency: hydrogel mechanical stability, local heterogeneities within the gel (entrapped gas bubble), and gas-liquid separation in the culturing media. In fact, these problems may occur in a large variety of experimental setups concerning cell cultures in microfluidic devices, irrespective of a specific design. The solutions we proposed are very easy to implement, inexpensive, do not alter cell viability, and are sufficiently versatile to be applied to the majority of the microfluidic designs usually used for cell culturing experiments.
References
- 1.Coultas L., Chawengsaksophak K., and Rossant J., Nature 438, 937 (2005). 10.1038/nature04479 [DOI] [PubMed] [Google Scholar]
- 2.Ashe H. L. and Briscoe J., Development 133, 385 (2006). 10.1242/dev.02238 [DOI] [PubMed] [Google Scholar]
- 3.Roussos E. T., Condeelis J. S., and Patsialou A., Nat. Rev. Cancer 11, 573 (2011). 10.1038/nrc3078 [DOI] [PMC free article] [PubMed] [Google Scholar]
- 4.Boyden S., J. Exp. Med. 115, 453 (1962). 10.1084/jem.115.3.453 [DOI] [PMC free article] [PubMed] [Google Scholar]
- 5.Zicha D., Dunn G. A., and Brown A. F., J. Cell Sci. 99, 769 (1991). [DOI] [PubMed] [Google Scholar]
- 6.Zigmond S. H., J. Cell Biol. 75, 606 (1977). 10.1083/jcb.75.2.606 [DOI] [PMC free article] [PubMed] [Google Scholar]
- 7.Jeon N. L., Dertinger S. K. W., Chiu D. T., Choi I. S., Stroock A. D., and Whitesides G. M., Langmuir 16, 8311 (2000). 10.1021/la000600b [DOI] [Google Scholar]
- 8.Holden M. A., Kumar S., Castellana E. T., Beskok A., and Cremer P. S., Sens. Actuators, B 92, 199 (2003). 10.1016/S0925-4005(03)00129-1 [DOI] [Google Scholar]
- 9.Irimia D., Geba D. A., and Toner M., Anal. Chem. 78, 3472 (2006). 10.1021/ac0518710 [DOI] [PMC free article] [PubMed] [Google Scholar]
- 10.Saadi W., Rhee S. W., Lin F., Vahidi B., Chung B. G., and Jeon N. L., Biomed. Microdevices 9, 627 (2007). 10.1007/s10544-007-9051-9 [DOI] [PubMed] [Google Scholar]
- 11.Chung S., Sudo R., Mack P. J., Wan C. R., Vickerman V., and Kamm R. D., Lab Chip 9, 269 (2009). 10.1039/b807585a [DOI] [PubMed] [Google Scholar]
- 12.Chung S., Sudo R., Zervantonakis I. K., Rimchala T., and Kamm R. D., Adv. Mater. 21, 4863 (2009). 10.1002/adma.200901727 [DOI] [PubMed] [Google Scholar]
- 13.Vickerman V., Blundo J., Chung S., and Kamm R., Lab Chip 8, 1468 (2008). 10.1039/b802395f [DOI] [PMC free article] [PubMed] [Google Scholar]
- 14.Jeong G. S., Han S., Shin Y., Kwon G. H., Kamm R. D., Lee S. H., and Chung S., Anal. Chem. 83, 8454 (2011). 10.1021/ac202170e [DOI] [PubMed] [Google Scholar]
- 15.Song J. W. and Munn L. L., Proc. Natl. Acad. Sci. U. S. A. 108, 15342 (2011). 10.1073/pnas.1105316108 [DOI] [PMC free article] [PubMed] [Google Scholar]
- 16.Vasaturo A., Caserta S., Russo I., Preziosi V., Ciacci C., and Guido S., PLoS One 7, e52251 (2012). 10.1371/journal.pone.0052251 [DOI] [PMC free article] [PubMed] [Google Scholar]
- 17.Moghe P. V., Nelson R. D., and Tranquillo R. T., J. Immunol. Methods 180, 193 (1995). 10.1016/0022-1759(94)00314-M [DOI] [PubMed] [Google Scholar]
- 18.Wu C. C., Ding S. J., Wang Y. H., Tang M. J., and Chang H. C., J. Biomater. Sci., Polym. Ed. 16, 1261 (2005). 10.1163/156856205774269494 [DOI] [PubMed] [Google Scholar]
- 19.Kim L., Toh Y. C., Voldman J., and Yu H., Lab Chip 7, 681(2007). 10.1039/b704602b [DOI] [PubMed] [Google Scholar]
- 20.See supplementary material at http://dx.doi.org/10.1063/1.4893913E-BIOMGB-8-027404 for gas bubble expansion within 3D collagen gel and matrix collapse.
- 21.Kang J. H., Kim Y. C., and Park J. K., Lab Chip 8, 176 (2008). 10.1039/b712672g [DOI] [PubMed] [Google Scholar]
- 22.Kimura Y., Miyazaki N., Hayashi N., Otsuru S., Tamai K., Kaneda Y., and Tabata Y., Tissue Eng., Part A 16, 1263 (2010). 10.1089/ten.tea.2009.0322 [DOI] [PubMed] [Google Scholar]
- 23.Gonnerman K. N., Brown L. S., and Chu T. M., Biomed. Sci. Instrum. 42, 60 (2006). [PubMed] [Google Scholar]
- 24.Pattappa G., Peroglio M., Sakai D., Mochida J., Benneker L. M., Alini M., and Grad S., Eur. Cells Mater. 27, 124 (2014). [DOI] [PubMed] [Google Scholar]
- 25.Li G., Cui Y., McIlmurray L., Allen W. E., and Wang H., J. Orthop. Res. 23, 680 (2005). 10.1016/j.orthres.2004.12.005 [DOI] [PubMed] [Google Scholar]
- 26.Ramanujan S., Pluen A., McKee T. D., Brown E. B., Boucher Y., and Jain R. K., Biophys. J. 83, 1650 (2002). 10.1016/S0006-3495(02)73933-7 [DOI] [PMC free article] [PubMed] [Google Scholar]
Associated Data
This section collects any data citations, data availability statements, or supplementary materials included in this article.
Data Citations
- See supplementary material at http://dx.doi.org/10.1063/1.4893913E-BIOMGB-8-027404 for gas bubble expansion within 3D collagen gel and matrix collapse.


