

Abstract
We report a fundamental study of how the electropermeabilization of a cell is affected by nearby cells. Previous researchers studying electroporation of dense suspensions of cells have observed, both theoretically and experimentally, that such samples cannot be treated simply as collections of independent cells. However, the complexity of those systems makes quantitative modeling difficult. We studied the change in the minimum applied electric field, the threshold field, required to affect electropermeabilization of a cell due to the presence of a second cell. Experimentally, we used optical tweezers to accurately position two cells in a custom fluidic electroporation device and measured the threshold field for electropermeabilization. We also captured video of the process. In parallel, finite element simulations of the electrostatic potential distributions in our systems were generated using the 3-layer model and the contact resistance methods. Reasonably good agreement with measurements was found assuming a model in which changes in a cell's threshold field were predicted from the calculated changes in the maximum voltage across the cell's membrane induced by the presence of a second cell. The threshold field required to electroporate a cell is changed ∼5%–10% by a nearby, nearly touching second cell. Cells aligned parallel to the porating field shield one another. Those oriented perpendicular to the field enhance the applied field's effect. In addition, we found that the dynamics of the electropermeabilization process are important in explaining observations for even our simple two-cell system.
INTRODUCTION
Electropermeabilization or electroporation is the process in which a strong external electric field is applied to cells to render their membranes temporarily and reversibly permeable to various molecules. The technique has found wide use for in vitro drug and gene delivery. Despite over forty years of study, fundamental questions remain open and controversial.1,2 While the bulk of both experimental and theoretical basic research on the electropermeabilization process concerns isolated cells, lately, studies have appeared of systems at cell densities for which the effects of nearby cells cannot be ignored.
Theoretically, the electroporation apparatus may be treated as two parallel plate electrodes that, when no cells are present, create a pulsed, uniform applied electric field, , where is the voltage pulse(s) applied to the electrodes and is the distance between the plates. The simplest model (referred to as the “simple cell” model below) for the cell treats it, electrically, as an infinitesimal spherical insulating membrane enclosing a uniform-conductivity cytoplasm and isolating it from a conducting buffer (see Fig. 1). For this configuration, an analytic solution exists for the electrostatic problem. It is generally thought that the voltage drop across the cell membrane, the “transmembrane potential” is central to describing the electropermeabilization process. Specifically, a region of the cell membrane becomes permeable when the magnitude of the transmembrane potential locally exceeds some threshold value, . The value of this threshold is somewhat controversial, but is usually thought to be between 0.2 and 1.5 V.3,4 depends on the cell line and may depend on permeabilization parameters such as the voltage pulse length and number of pulses. Using the simple-cell model, the Schwan equation predicts for that part of electrostatic transmembrane potential due to the applied field
| (1) |
where is the cell radius and is the angle on the cell membrane relative to the electric field axis. The electrical structure of the cell is seen as focusing or concentrating on the applied field. The resulting maxima in the magnitude of the induced transmembrane potential magnitude lie at the poles of the cell along the electric field axis and it is there that electropermeabilization first occurs.
FIG. 1.

Geometry for single-cell electropermeabilization. represents the applied electric field. In the figures that follow showing experimental data, the direction of the applied field will be from the top to the bottom of the figure. is the cell's radius; is the cell membrane thickness; and refers to the angle on a point on the cell membrane relative to the direction of the applied field.
Theoretical work on multiple cell systems began with the 1998 paper of Susil et al.5 who used a finite element method to calculate the transmembrane potential for various infinite arrangements of spherical cells including a simple cubic lattice, 2D planes of cells for both parallel and perpendicular orientations relative to the applied field and—most relevant to our work—1D chains of cells both parallel and perpendicular to the applied field. Pavlin et al.6 described numerical calculations in which they found transmembrane potentials for additional 3D crystalline cell arrangements including body centered cubic and face centered cubic lattices. They also studied finite crystalline systems of various densities and included a discussion of the effect of the position of a cell within a crystalline cluster on its transmembrane potential. In 2003, Gowrishankar and Weaver7 outlined a general theory for modeling electrical properties of multiple cell systems. On the experimental side, Canatella et al.8 measured molecular uptake following electroporation of dense suspensions—cell concentrations up to 23% by volume—of DU145 prostate cancer cells. They found fairly complex dependences for molecular uptake vs. various electropermeabilization parameters. Extending that work, in 2004 Canatella et al.9 compared the molecular uptake of individual cells to that of small (diameters 50 m–200 m) spheroid tumors of DU145 cells and developed a semi-empirical description of a cell's uptake as a function of its position within a tumor. Pavlin et al.10 measured permeabilization and survival fraction of dense (up to 30% cell fraction) suspensions. The focus of that study was to detect and model variations in the conductivity of the buffer medium resulting from electroporation. In 2007, Pavlin et al.11 extended that work and presented a quantitative explanation for their measurements in terms of a detailed model based on the creation of two types of pores: transient pores, open only during the application of the electric field and long-lived “transport pores.” Gaynor and Bodger12 used their “balloon model” to simulate electrical effects of cell-cell interactions in the electroporation process. In that work, spherical latex membranes were used to simulate cells; various two-cell, “couplet” arrangements and a 3 × 3 × 3 simple cubic lattice of “cells” were studied. Especially noteworthy from a fundamental-science perspective is the 2007 work of Pucihar et al.13 who carefully measured the fraction of cells permeabilized and the resulting uptake of propidium iodide (PI) dye for dense suspensions (1%, 18%, and 36% by volume) of CHO cells. They were able to qualitatively explain their observations using a face centered cubic lattice model of single simple cells. However, detailed quantitative comparisons were hampered by cell swelling and the dilution of the dye solution by permeabilized cells. Very recently, Wasungu et al.14 studied geometrical effects in the electropermeabilization DNA transfection of ∼500 diameter spheroidal clusters of cells.
Most previous laboratory research on cell-cell interactions in electropermeabilization have taken a “top down” approach, where large numbers of densely packed cells were studied and models created to describe experimentally accessible measurements. In general, good qualitative explanations of these many-cell systems were usually possible and frequently quantitative trends could be identified and described using parameters experimentally identified and empirically determined. By contrast, for this work, we used a “bottom up” approach in which we consider the simplest system capable of exhibiting cell-cell interactions—a two-cell system—with the goal of comparing measurements to a basic principles model. We undertook a focused program of studying the initiation of electropermeabilization in two-cell systems by measuring the minimum, threshold, applied electric field required to cause permeabilization and comparing it to the threshold field needed for a single, isolated cell. Experimentally, our basic method for measuring was to use laser tweezers to accurately position either a single-cell or two identically sized cells in an electroporation apparatus. We then subjected the cell(s) to a series of electropermeabilization “trials” using increasing voltages on the pulsing electronics until we saw permeabilization by observing that PI dye had penetrated the membrane of one of the cells and figuring the threshold field based on the voltage resulting in permeabilization. We measured thresholds of single-cells and for two-cell arrangements both parallel and perpendicular to the direction of the electric field. Our working hypothesis was that our two-cell measurements could be understood in terms of the threshold field for the single-cell case multiplied by an enhancement/shielding factor describing how the electrostatic transmembrane potential of a cell was modified by the presence of a second, nearby cell. Accordingly, we also numerically solved the relevant one-cell and two-cell electrostatic problems.
MATERIALS AND METHODS
Cells
Animal cell line K562 was used in these experiments. K562 cells are immortalized leukemia cells. The average cell diameter was 13 μm (standard deviation 1.2 μm). Cells were grown in suspension on 1640 RPMI media (Gibco) supplemented with newborn calf serum (NCS), L-glutamine and sodium pyruvate. Cells used in experiments were at a growth phase as recommended for electroporation processes.
Electroporation and cell manipulation
The electropulse generation apparatus consisted of a complete Bio-RAD gene pulser system with custom electrode contacts.
A custom fluidic was used to carry out the electroporation. The fluidic consisted of a 1.2 mm × 10 mm channel milled in 1 mm poly(methylmethacrylate) (PMMA) sheet and lined with parallel copper foil electrodes along the 10 mm side lengths of the channel. This system provided a uniform electric field across the channel. The copper electrodes were soldered to electrical leads that connected to the power supply. The channel in the fluidic was sealed with a glass cover slip (no.1 thickness) and instant adhesive (Loctite). This allowed images to be captured from an inverted microscope while operating the optical trapping laser through the glass cover slip. The fluidic was capable of generating electric fields of 100–10 000 V/cm when combined with the Bio-RAD power supply.
Cell manipulation was accomplished using an optical tweezers (more information can be found in our earlier paper15). Typically, 300–400 mW of 1064 nm laser power was used to trap individual cells.
Microscopy
A Nikon X-81 inverted microscope in conjunction with a Photometrics Cascade II: 512 EMCCD camera was used to capture video of electroporation events.
To detect electroporation, cell impermanent PI dye was used. Under normal circumstances, a cell has an intact cell membrane and this dye cannot pass through it. As a result, the cell exhibits low fluorescence. If the cell membrane is compromised or damaged this dye is able to pass into the cell and combine with nucleic acids to exhibit a 30 fold enhancement of its fluorescence. In this work, most of the observed fluorescence results from interaction of the PI dye with RNA in the cytoplasm.
In the experiments, cells were incubated in a 100 μM PI in phosphate buffered saline (PBS) solution for 10 min prior to electroporation.
Simulations
The general equation for the DC electric potential distribution in a conductive medium is given by
| (2) |
where is the electrical conductivity (S/m), is the electrical potential. Fig. 1 shows the single-shell (or 3-layer) model to mimic a cell in the surrounding medium. Here, single shell means the cell membrane and the 3 layers are external, membrane, and intercellular layers. is the cell membrane thickness. The cell membrane, cytoplasm, and the external solution are treated as conductive media with , , and the electrical conductivities of intercellular cytoplasm, external solution, and cell membrane, respectively. We solved for electric fields and transmembrane potentials for the two geometries we studied experimentally: two cells oriented parallel to the applied poration field and two cells perpendicular to the field. The parallel case is considerably easier because the rotational symmetry about the electric field axis allows the reduction to a 2D problem. For the perpendicular case, a full 3D calculation is required.
The “simple-cell” discussed above treats the membrane as an infinitesimally thin, perfect insulator, . Laplace's equation, is solved in the exterior region of the cell subject to boundary conditions 1) the parallel plate field of the poration apparatus is reproduced at infinity and 2) the normal component of electric field ( current density) at the cell's membrane equals 0. The interior of the cell is modeled as a uniform, non-zero conductivity conductor and screening charges on the membrane produce a constant voltage throughout the interior of the cell. In calculating the electric field distributions and the transmembrane potential, the values of the conductivities in the three regions do not matter as long as the interior and exterior regions have non-zero conductivities and the cell membrane is a very good insulator. This is the model used for much of aforementioned previous work discussed above. To the extent that the simple-cell model is valid there is only one scale length in the problem—the cell diameter. This means that the results of a given system are readily scalable to geometrically similar systems. Accordingly, we measure lengths for what follows in units of cell diameters. We are ultimately interested in modeling systems after permeabilization and the finite element computer codes we used have a more detailed description of the cell, including a non-zero-thickness cell membrane with a finite conductivity. However, the numerical results in the present work were found to be equal (to within 0.5%) to those of the corresponding simple-cell model.
For the finite element models, we used for the cytoplasm conductivity measured by Yang et al.16 for a human leukocyte (B-cell), S/m. The conductivity of the PBS buffer, S/m. This is representative of extra-cellular fluid in tissues: the conductivity of blood plasma is 2 S/m. The cell membrane conductivity, , was taken from Kotnik et al.17 and were taken for the cell radius and the membrane thickness, respectively. As noted, the electrostatic calculations are insensitive to these values as long as the membrane conductivity is low enough that it is well-modeled as an electrical insulator. However, in the discussion of dynamics that follows, it is important that the conductivity of the buffer is significantly larger than that of the cytoplasm of the cell.
RESULTS
Single-cell measurements
Initially, we carried out measurements to characterize the near-threshold electropermeabilization behavior for a single-cell. This work has been summarized in an earlier paper.15 Additionally, that paper describes several experimental checks on the reliability of our experimental approach. Three important conclusions of that work are (I) the permeabilization threshold electric field does not depend on cell size; (II) the measured threshold poration field of a cell is not affected by the history of earlier poration attempts at lower voltages—to the accuracy of our measurements; (III) the optical tweezers have no impact on the measured poration threshold.
Data were acquired as follows. A cell was captured by the optical tweezers and positioned midway between the two electrodes in the poration fluidic. Cells were selected for their healthy appearance, near-spherical shape and—at least before permeabilization—an absence of blebs. Testing began by pulsing the sample at a voltage substantially below the expected permeabilization threshold. The electropermeabilization pulsing program used for all the measurements in this work consisted of ten unipolar rectangular 1 ms voltage pulses applied to the electroporation electrodes at a frequency of 10 Hz. The cell was observed for 30 s to 1 min and then, if no poration, the pulsing program was run again—this time at a higher voltage. The voltage options of the pulsing electronics allowed increasing the applied field in increments of either 8 V/cm or 16 V/cm. The procedure was repeated until electropermeabilization was observed by penetration of PI dye into the cell. Note: we identified the electroporation threshold on the detection of any dye within one of the cells in a system. Large cell to cell variations in the net dye uptake were seen for all arrangements. However, the identification that electroporation had occurred was always experimentally unambiguous. Typically, between 4 and 8 trials would be required before permeabilization was observed. We photographically recorded every measurement with our CCD camera at 10 FPS. After a successful data run, the fluidic was flushed and a new sample of cells introduced for the next measurement.
Fig. 2 shows a typical near threshold attempt in which die preferentially enters through the anode-facing pole. Often we saw a more symmetric dye entry at both poles. For single-cell measurements, we never saw preferential entry from the cathode side. The principal results of this section are our measurements of the threshold field for permeabilization of a single-cell. First, we found that electropermeabilization was a stochastic process in the sense that two apparently identical cells would have different permeabilization thresholds. The mean threshold was measured to be 723 V. The data were nominally normally distributed about the mean with a standard deviation of 30 V (see Fig. 3).
FIG. 2.
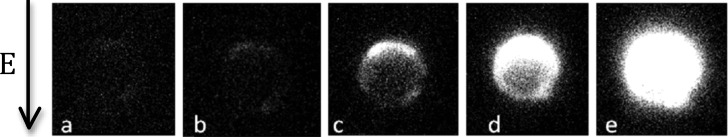
Video excerpts taken from near threshold single-cell electropermeabilization observations. Here, we saw entry of dye preferentially through the anode pole. Times shown are at (a) 0 s, (b) 7.5 s, (c) 15 s, (d) 22.5 s, and (e) 30 s, after the poration pulsing.
FIG. 3.

Measured electropermeabilization thresholds for a single-cell and for two cells oriented parallel and perpendicular to the applied poration field. Individual runs are shown by the black squares. The red bars are voltage ranges within one standard deviation of the mean for the different arrangements.
Two-cell systems
For the two-cell measurements, two independently controllable optical tweezer traps were created using two orthogonal linear polarizations of the laser light. Two healthy appearing, nearly identically sized cells were selected and positioned by the two traps. Trials again consisted of a program of ten 1 ms pulses at 10 Hz. The sequence of permeabilization trials was continued until permeabilization was observed in either cell.
Two cells oriented parallel to the electric field lines
We carried out two sets of experiments with cells oriented parallel to the electric field: a far-separated case and a near-cell case. For the far case, cells were separated by over two cell diameters. The results were fairly uninteresting and well described by two independent single-cell systems. The near-cell measurements used two cells that were positioned as close as possible without the cell membranes actually touching. Typically, the two membranes were within 1 m of one another at their closest points (see Fig 4). The principal experimental results are shown in Fig. 3. Qualitatively, cells oriented parallel to the porating electric field shield each other from permeabilization: larger fields are required to effect permeabilization. To this end, we conducted a statistical t-test to compare the mean electric field needed to produce electroporation for the two cases: an isolated cell and two cells oriented parallel to the electric field. The null hypothesis is that these two cases require equal field strength to produce electroporation while the alternative hypothesis is that they do not. This was a two tailed test assuming equal variance in the breakdown thresholds. Based on the t-test, there is a less than 1% chance of observing the values we obtained in our experiments; therefore we reject the null hypothesis. Quantitatively, the mean threshold required for permeabilization increased from 723 V/cm to 817 V/cm. We define an empirical enhancement/shielding factor, F, as the ratio of the average field required to porate a single-cell to that required for the two-cell system. That is, for two cells oriented parallel to the field, we measure a near-cell limit for the enhancement/shielding factor of 0.89.
FIG. 4.
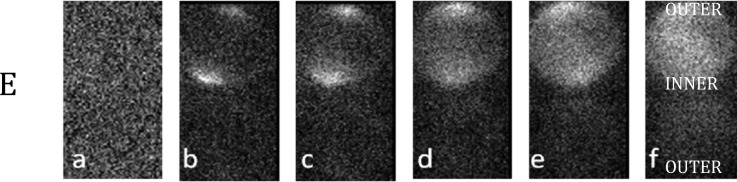
PI entrance into two closely separated cells oriented parallel to the electric field for times (a) 0 s; (b) 6 s; (c) 12 s; (d) 18 s; (e) 24 s; (f) 30 s. Calculations predict that the cells shield each other's “INNER” poles strongly, F = 0.72. At the “OUTER” poles, the shielding is predicted to be much less effective, F = 0.96 and so the initial electroporation of a cell is expected to occur there. In the case shown, both poles of the top cell are porated. We argue this must be due to dynamics of the poration process. The bottom cell remains intact.
We carried out electrostatic potential calculations for this two-cell system. The basic idea was to solve the Laplace equation as described above to find the maximum transmembrane potential for the two-cell system and compare it to the maximum for an isolated cell () in the same field. The “theoretical” enhancement/shielding factor, then, was taken as the ratio of the two-cell maxima to the single-cell result. Fig. 5 shows that ratio as a function of distance between the cells. The maxima, where the initial permeabilization is expected, are located on the outer poles of the two-cell system and the enhancement/shielding factor, F = 0.95. In other words, the calculation predicts that to achieve poration in the near-cell two-cell system it is necessary to increase the applied field by 5% over the isolated cell value. Note: the regions where the cells are next to one another are relatively well shielded: the presence of the second cell reduces the field at the nearby, “inner” pole of its neighbor by a factor, F = 0.74.
FIG. 5.

The enhancement/shielding factor for the transmembrane potential of a cell due to the electrostatic effect of a nearby cell oriented parallel to the applied field. The distance between cells is measured in units of “D,” the cell diameter. For this geometry, the second cell reduces the field on the first and therefore a larger field must be applied to effect electropermeabilization.
Two cells oriented perpendicular to the electric field lines
We carried out a second series of measurements, this time with two cells positioned by the optical tweezers to be perpendicular to the applied field. Again, we considered two separations a “far-separation” case with cells separated over two cell diameters, and a “near-cell” case with two cells very close but not touching. The electropermeabilization threshold measurements for this far-separation case were again consistent with the system behaving as two independent cells and we will discuss those no further. Fig. 6 is a video record from a representative near-cell run. We analyzed our data similarly to the parallel case and for cells oriented perpendicular to the field we found that the electroporation threshold was reduced over that of and isolated cell (t-test, p < 0.01) (see Fig. 3). Specifically, we found, that the mean threshold field required for permeabilization was reduced from 723 V/cm for an isolated cell to 669 V/cm for two adjacent cells perpendicular to the field. We can define an enhancement/shielding factor, as described above: .
FIG. 6.

Electropermeabilization of two cells oriented perpendicular to the applied field. Times shown are 0 s, 7.5 s, 15 s, 22.5 s, and 30 s.
We also carried out numerical calculations for the transmembrane potential of cells for the two-cell perpendicular case for several different separations between the two cells. Fig. 7 shows those results. The near-cell limit of those calculations predicts an enhancement/shielding factor of 1.06, i.e., an enhancement of the transmembrane potential 6% over the isolated cell value.18 In addition as we discuss below, even for this simplest of multi-cell systems, the simple electrostatic view we are taking may not be adequate for modeling the location and extent of the cell membrane made permeable: even here dynamics are important.
FIG. 7.

Modeling results for two cells aligned perpendicular to applied field. (a) Angular displacement of transmembrane potential maxima: adjacent cells would be expected to porate first at positions 4° from the poles. (b) The enhancement/shielding factor of a cell due to the electrostatic effect of a nearby cell. For this geometry, the second cell increases the field on the first, reducing the size of the applied field needed for electropermeabilization.
While the major focus of our work was to measure enhancement and shielding in two-cell systems we noted an interesting feature in the video for the near-cell perpendicular case. After the data were collected, we went though all of our two-cell video and recorded whether one cell (e.g., Fig. 4) or both cells (e.g., Fig. 6) were permeabilized at the end of a given trial. Table I shows the results for the different cases investigated. In general, we see about a 50–50 distribution in the video observations of one-cell vs. both cells being porated at the end of a trial. However, for the near-cell perpendicular case we always observed that both cells were electropermeabilized. Moreover, for that case, the two cells showed very similar fluorescence intensity. Specifically, when we summed the CCD signals for pixels from each individual cell, we found that, in the perpendicular near-cell runs, the signals from the two cells were always within a factor of two of one another. We suggest a dynamic model explaining this observation, below.
TABLE I.
Trials resulting in a single cell and both cells being porated.
| Orientation of cells | One cell fluorescent (No. of trials) | Both cells fluorescent (No. of trials) |
|---|---|---|
| Parallel: far | 2 | 5 |
| Parallel: near | 9 | 12 |
| Perpendicular far | 8 | 3 |
| Perpendicular near | 0 | 9 |
DISCUSSION
Single-cell measurements
Referring to Fig. 2, the preferential penetration of dye on the cell's anode side may be understood by considering the total transmembrane potential felt during a pulse,
| (3) |
The first term is the simply the applied field's contribution from Eq. (1). The second term is the cell's rest potential. For most mammalian cells, the rest potential is negative and can be as large as several hundred millivolts. This means that the magnitude of the transmembrane potential is largest at the anode pole and permeabilization will first occur there. The symmetric vs. asymmetric entry of dye into a permeabilized cell has been discussed previously by several groups.19–21 Novel to our work is that our observations were made at voltages very near the minimum required to effect the permeabilization of a cell and so it is not surprising that we saw preferential dye entry anode side where the magnitude of the transmembrane potential was the largest. There are at least two possible explanations for those instances we saw symmetric dye entry. First, it may be that our porator's voltage increments were large enough and the cell's rest potential small enough that in the final trial we increased the applied field to a value large enough to porate both poles of the cell. Alternatively, we could be observing a dynamic effect due to the cell's electrically discharging through the newly permeabilized, conductive region at the anode-facing pole of the cell. Following Hibino et al.,20 in the simple-cell model, the interior of the cell is a good conductor (=electrostatic constant potential) and initially, the cell membrane is a perfect electrical insulator. On applying a voltage to the system, after membrane-charging transients are over, along the cell's axis, the applied part of the pole-to-pole voltage of the cell is divided half across the cathode-facing pole membrane, half across the anode-pole membrane: Eq. (3) applies. An initial disruption of the cell membrane at the anode facing pole allows current flow, effectively shorting out that voltage drop (the field outside the cell is little-affected). Now, after a transient discharge of the cell membrane, the full applied pole-to-pole voltage appears across the cathode-facing membrane and this likely results in permeabilization at that pole. Shortly, we will argue that, at least some of the time, this latter dynamic cell-discharge process is occurring.
Two cells oriented parallel to the electric field lines
We first compare our calculations with the results of Susil et al.5 for an infinite chain of touching cells oriented parallel to the electric field. Qualitatively, they too predict that the cells shield one another: cells in a parallel-oriented chain require a stronger permeabilization field than isolated ones. The enhancement/shielding factor derived from that work is 0.67. That is, the field maxima at the cell poles in a column of cells is reduced by 33% from that of a single cell in the same apparatus. In an infinite chain all cell poles are “inside” ones. From our two-cell calculations, we found for the inner-poles an enhancement/shielding factor of 0.74: i.e., the second cell reduces the field on its neighbor by 26%. Taken together, these results imply that most—over ¾'s—of the reduction of the field on a cell in an infinite chain is due to the cell next to it.
Gaynor and Bodger12 used their “balloon” model to simulate multi-cell electroporation and specifically studied the case of two equal sized spherical cells parallel to an applied field. Small and large cells were represented by water filled spherical latex membranes latex of 30 mm and 65 mm in diameter. These were positioned in a suitably scaled up water filled electroporation apparatus and subjected to ever increasing electric field pulses until “electroporation” was observed when one of the balloons began leaking. Earlier balloon model work had reproduced general features of electroporation. However, in contrast to our results, they measured that the field needed to porate cell couplets was reduced from than that needed for single cells. That is, the threshold was changed in a direction opposite to that we measured and calculated: their data showed enhancement/shielding factors greater than 1, typically 1.4–1.5.
In comparing our own experimental data to our own calculations, we measured a near-cell-limit enhancement factor of 0.89 while our calculations predicted 0.95. To the positive, both theory and experiment predict a net shielding effect and the order of magnitudes agree. However, even given the experimental uncertainties, the measured shielding effect is higher than our calculation predicted (t-test, p < 0.01). An examination of the distribution of individual measurements reinforces this observation. We are presently at a loss to explain this discrepancy. Interestingly, Pucihar et al.13 reported a similar discrepancy in their measurements on dense cell suspensions. In that work, they observed that stronger fields were needed to permeabilize dense suspensions of cells compared to what was required for isolated cells. This was qualitatively consistent with their calculations. However, similar to us, they measured the shielding to be stronger than that predicted by calculation. Using our language to describe their results, their calculations predicted an enhancement/shielding factor of 0.88 where their measured value was about 0.77.
A tangential insight on permeabilization dynamics can be gotten from the two-cell work concerning the origin of the polar-symmetric poration for single cells that was discussed above. Specifically, one possibility suggested was that because of the way we incremented the porator voltages during trials, for the final trial, the voltage was high enough to exceed the require threshold at both poles.19 However, we see bipolar dye penetration behavior for the cell that is porated in Fig. 4. For this case, electrostatically, the inner pole (see Fig. 4) of that cell should have been very well shielded by the lower cell: the applied transmembrane potential for the inner poles is much too small to effect permeabilization. This suggests that, in at least some cases, the dynamic cell-discharge mechanism discussed above accounts for symmetric-case permeabilization. In the same vein, the first steps in the electrofusion process between two cells are to position the cells next to one another and then simultaneously electroporate both adjacent cell membranes. If this process required the initial, applied electrostatic potential to be large enough to do this, our calculated shielding factor for the inner surface would lead to the prediction that to cause electrofusion, the minimum applied electric field must be increased to at least times that required for single-cell electropermeabilization. Marszalek et al.22 have noted that for many types of mammalian cells the threshold for electrofusion is 1.5–2 times the electropermeabilization threshold and this is consistent with this lower limit based on our electrostatic shielding prediction. On the other hand, we see that the dynamic cell-discharge process can also disrupt the membrane at the inner surfaces of the two-cell structure and if that is the way electrofusion proceeds, our lower limit may not apply.
Two cells oriented perpendicular to the electric field lines
Susil et al.5 calculated transmembrane potentials for an infinite chain of cells perpendicular to the applied and also found that for this case, the net effect was to enhance the transmembrane near the poles of the cells. Quantitatively, they found an enhancement/shielding factor of 1.10%–10% over the isolated cell value. That their calculated enhancement is about twice ours—10% vs. 6%—is readily understood: a cell in an infinite chain has two neighbors, each contributing enhancement approximately equal our single-neighbor result.
For this case, our measured experimental enhancement/shielding factor of 1.08 agrees reasonably well of with our calculated prediction of 1.06.
We turn to the observation that for the near-cell perpendicular case, our video showed that successful attempts always resulted in both cells porating nearly equally. Now, in general, for any two-cell system we might expect the opposite: always to observe only a single cell permeabilized at the end of any two-cell experiment. The argument goes as follows. Because of the stochastic nature of electropermeabilization discussed above, for the two cells in a trial, one will likely have a smaller electropermeabilization threshold than the other. Since we stop a trial when we see any PI fluorescence, we might expect a sequence to end when the more sensitive cell has been disrupted. On the other hand, because of the fairly large field increment used between attempts—either 8 V/cm or 16 V/cm—sometimes the last increment takes the field above the threshold for both cells and this leads to both cells porating. But why, for the near-cell perpendicular case do we always observe both cells porated?
We suggest this is a consequence of dynamics of the system. To help explain our observations, we consider the circuit model for the two-cell + electroporation system shown in Fig. 8. The two cells are designated “A” and “B” with “A” assumed to have the lower threshold for electropermeabilization. “V” designates the voltage applied by the pulsing system. “,” “,” “,” and “” represent the resistances of the volumes of buffer just outside of the polar regions of the cells. In a quantitative model, we would precisely and symmetrically define equal volumes for these four regions but by the symmetry of the problem, we would expect the four resistances to be equal, initially. Similarly, we model the buffer on the sides of the cells by “shunt resistances,” . describes the buffer far from the two-cell region. Note, because of the extremely high electrical resistance of the cell membrane, the cells themselves are essentially insulators and do not contribute significantly to the current flows in the problem. This is true even after electropermeabilization: cells porated at both poles are then less resistive. But still in comparison with the buffer regions, their current conduction can be ignored. A successful electropermeabilization trial begins by disrupting the cell with the lower electropermeabilization threshold, cell “A” in our example. At this time fluid from the cytoplasm starts flowing out from the pole regions, and since for our system the cytoplasm is less conductive than the buffer, and increase. This has two effects. First, , the current in the “A” leg of the circuit decreases and the pole-to-pole voltage across cell “A” () decreases—possibly limiting the electropermeabilization process for cell A. Second, since the current through the “A” leg is reduced, the net current drawn by the two-cell system is also reduced (the “load” represented by the two-cell system is reduced) and as a result, , the voltage across the volume of the “neighborhood” of the two cells is increased. In particular, the voltage across cell “B” is increased, ultimately causing electropermeabilization once its threshold is exceeded. At that point cell “B's” release of cytoplasmic fluid acts similarly on cell “A.” The net result is a negative feedback system: an increasing permeabilization of a cell acts to limit its own pole-to-pole voltage and increase that of its neighbor. The feedback loop pushes the cells toward equal poration. What about the parallel orientation case? A similar model for two-cells oriented parallel to the electric field indicate the dynamics of that system favor single cell poration; the cases where both cells porate are simply the result of the thresholds for both cells being exceeded by the final field increment.
FIG. 8.

Circuit model for two-cell electropermeabilization. Cell “A” is assumed to have the lower threshold. Upon disruption at its poles, cell “A” leaks cytoplasmic fluid causing the resistances representing to buffer just outside the cell at the top and bottom of the cell to increase and ultimately increase the voltage across cell “B.”
CONCLUSIONS
In this work, we measured changes in the electric field threshold required to electroporate a cell in two systems compared to that for an isolated cell. We found that these measured changes were fairly well described by the corresponding changes in the maximum transmembrane potentials calculated in the electrostatic limit. Specifically, cells arranged along electric field lines shield one another from the applied fields and those arranged in the plane perpendicular to the field produce a net focusing effect: those cells increase the effective field felt by their neighbors. Our two-cell results were consistent with earlier infinite-chain calculations of Pavelin et al. Good theory-experiment agreement was found in the case of two cells perpendicular to the field. For the parallel case, experimentally the measured shielding was about a factor of two larger than would be expected from our electrostatic calculations. This is a little puzzling because prior to the disruption of a cell's membrane, the calculation of the potential distribution is insensitive to the details of the cell model and that potential distribution—specifically the transmembrane potential of the cell—is expected to be the determining factor in the onset of permeabilization. However, this discrepancy is similar in both the direction and the order of magnitude to a discrepancy reported previously for dense cell suspensions. The effects themselves are small and for our two-cell measurements to observe measurable interactions we needed to position cells to be nearly touching
A final conclusion from our experimental work is that even for our simple two-cell system the electrostatic calculation cannot be pushed much beyond predicting the field needed for the onset of permeabilization. Very shortly after a single cell's membrane is disrupted at a single location the potential distribution changes from the electrostatic calculation: dynamics of the process become important in determining the subsequent permeabilization of that cell's membrane and the permeabilization of nearby cells.
A primitive feedback loop was suggested to explain the near-equal permeabilization observed in all of our measurements on nearby two-cell oriented perpendicular to the applied field.
ACKNOWLEDGMENTS
This work was partially supported by the National Science Foundation sponsored Nanoscale Science and Engineering Center for Affordable Nanoengineering of Polymeric Biomedical Devices (Grant Nos. EEC-0425626 and 0914790).
References
- 1.Sukhorukov V., Reuss R., Zimmermann D., Held C., Muller K., Kiesel M., Gessner P., Steinbach A., Schenk W., Bamberg E., and Zimmermann U., J. Membr. Biol. 206(3), 187–201 (2005). 10.1007/s00232-005-0791-2 [DOI] [PubMed] [Google Scholar]
- 2.Teissie J., Golzio M., and Rols M., Biochim. Biophys. Acta 1724(3), 270–280 (2005). 10.1016/j.bbagen.2005.05.006 [DOI] [PubMed] [Google Scholar]
- 3.Teissie J. and Rols M., Biophys. J. 65, 409 (1993). 10.1016/S0006-3495(93)81052-X [DOI] [PMC free article] [PubMed] [Google Scholar]
- 4.Zimmermann U. and Neil G. A., Electromanipulation of Cells (CRC Press, 1995).
- 5.Susil R., Semrov D., and Miklavcic D., Electro- Magnetobiol. 17(3), 391–399 (1998). 10.3109/15368379809030739 [DOI] [Google Scholar]
- 6.Pavlin M., Pavselj N., and Miklavcic D., IEEE Trans. Biomed. Eng. 49(6), 605–612 (2002). 10.1109/TBME.2002.1001975 [DOI] [PubMed] [Google Scholar]
- 7.Gowrishankar T. and Weaver J., Proc. Natl. Acad. Sci. USA 100, 3203–3208 (2003). 10.1073/pnas.0636434100 [DOI] [PMC free article] [PubMed] [Google Scholar]
- 8.Canatella P., Karr J., Petros J., and Prausnitz M., Biophys. J. 80(2), 755–764 (2001). 10.1016/S0006-3495(01)76055-9 [DOI] [PMC free article] [PubMed] [Google Scholar]
- 9.Canatella P., Black M., Bonnichsen D., McKenna C., and Prausnitz M., Biophys. J. 86(5), 3260–3268 (2004). 10.1016/S0006-3495(04)74374-X [DOI] [PMC free article] [PubMed] [Google Scholar]
- 10.Pavlin M., Kanduser M., Rebersek M., Pucihar G., Hart F., Magjarevic R., and Miklavcic D., Biophys. J. 88(6), 4378–4390 (2005). 10.1529/biophysj.104.048975 [DOI] [PMC free article] [PubMed] [Google Scholar]
- 11.Pavlin M., Leben V., and Miklavcic D., Biochim. Biophys. Acta 1770(1), 12–23 (2007). 10.1016/j.bbagen.2006.06.014 [DOI] [PubMed] [Google Scholar]
- 12.Gaynor P. T. and Bodger P. S., Phys. Med. Biol. 51(12), 3175–3188 (2006). 10.1088/0031-9155/51/12/012 [DOI] [PubMed] [Google Scholar]
- 13.Pucihar G., Kotnik T., Teissié J., and Miklavcic D., Eur. Biophys. J. 36(3), 173–185 (2007). 10.1007/s00249-006-0115-1 [DOI] [PubMed] [Google Scholar]
- 14.Wasungu L., Escoffre J.-M., Valette A., Teissie J., and Rols M.-P., Int. J. Pharm. 379(2), 278–284 (2009). [DOI] [PubMed] [Google Scholar]
- 15.Henslee B. E., Morss A., Lafyatis G. P., and Lee L. J., Anal. Chem. 83, 3998–4003 (2011). 10.1021/ac1019649 [DOI] [PubMed] [Google Scholar]
- 16.Yang J., Huang Y., Wang X., Wang X., Becker F., and Gascoyne P., Biophys. J. 76(6), 3307–3314 (1999). 10.1016/S0006-3495(99)77483-7 [DOI] [PMC free article] [PubMed] [Google Scholar]
- 17.Kotnik T., Bobanovic F., and Miklavcic D., Bioelectrochem. Bioenerg. 43(2), 285–291 (1997). 10.1016/S0302-4598(97)00023-8 [DOI] [Google Scholar]
- 18.Frequently in electroporation, the enhancement of the field across the membrane at the poles of a cell (over the applied field in the absence of the cell), leading to electroporation at those locations is described as an effect of the bunching or “focusing” of field lines due to their exclusion from the (conductive cytoplasm surrounded by insulating membrane) cell itself. In the case of the perpendicular arrangement, because the two cells obstruct more field lines this effect is enhanced and in turn the transmembrane potential enhanced over that of a single cell in the same bias field. We see this enhancement (and increased focusing) in our calculations.
- 19.Gabriel B. and Teissié J., Biophys. J. 73(5), 2630–2637 (1997). 10.1016/S0006-3495(97)78292-4 [DOI] [PMC free article] [PubMed] [Google Scholar]
- 20.Hibino M., Shigemori M., Itoh H., and Nagayama K., Biophys. J. 59, 209–220 (1991). 10.1016/S0006-3495(91)82212-3 [DOI] [PMC free article] [PubMed] [Google Scholar]
- 21.Tekle E., Astumian R., and Chock P., Proc. Natl. Acad. Sci. USA 91(24), 11512–11516 (1994). 10.1073/pnas.91.24.11512 [DOI] [PMC free article] [PubMed] [Google Scholar]
- 22.Marszalek P., Liu D., and Tsong T., Biophys. J. 58(4), 1053–1058 (1990). 10.1016/S0006-3495(90)82447-4 [DOI] [PMC free article] [PubMed] [Google Scholar]