Abstract
Background:
Atrophic gastritis is a precancerous condition, which can be diagnosed by several methods. However, there is no consensus for the standard method. The aim of this study was to evaluate the correlations among endoscopic, histologic, and serologic findings for the diagnosis of atrophic gastritis.
Methods:
From March 2003 to August 2013, a total of 2,558 subjects were enrolled. Endoscopic atrophic gastritis was graded by Kimura-Takemoto classification and histological atrophic gastritis was assessed by updated Sydney system. Serological assessment of atrophic gastritis was based on serum pepsinogen test.
Results:
The serum pepsinogen I/II ratio showed a significant decreasing nature when the extent of atrophy increased (R2=0.837, P<0.001) and the cut-off value for distinguishing between presence and absence of endoscopic atrophic gastritis was 3.2. The serum pepsinogen I and pepsinogen I/II ratio were significantly lower when the histological atrophic gastritis progressed and the cut-off value was 3.0 for a diagnosis of histological atrophic gastritis. A significant correlation between endoscopic and histological atrophic gastritis was noted and the sensitivity and specificity of endoscopic diagnosis were 65.9% and 58.0% for antrum, 71.3% and 53.7% for corpus, respectively.
Conclusions:
The endoscopic, histological, and serological atrophic gastritis showed relatively good correlations. However, as these three methods have a limitation, a multifactorial assessment might be needed to ameliorate the diagnostic accuracy of atrophic gastritis.
Keywords: Atrophic gastritis, Histology, Endoscopy, Pepsinogen
INTRODUCTION
The Correa hypothesis suggested that the gastric mucosa undergoes a series of changes resulting in chronic gastritis, atrophy, intestinal metaplasia, and dysplasia, before developing into gastric cancer.1,2 Gastric atrophy which is included in this cascade has been regarded as a premalignant condition of gastric cancer and the risk for gastric cancer development was increased significantly with the severity of premalignant condition at initial diagnosis.3 Thus, early identification of such precancerous lesion can lead to the early diagnosis of gastric cancer and improve patients’ survival.4 The prevalence of gastric cancer is unacceptably high in Korea. The age-standardized incidence of gastric cancer during 2010 in South Korea, as determined by the Korea National Cancer Incidence Database was 62.3 per 100,000 person-years for men and 24.9 for women.5 Furthermore, most cases of gastric atrophy are associated with Helicobacter pylori (H. pylori) infection, with the seroprevalence of H. pylori being still high about 54.4% among asymptomatic Korean adults in 2011.6
A Korean health check-up program supported by Korean government is designed to detect gastric cancer by biannual endoscopic evaluation. In real clinical setting, the diagnosis of atrophic gastritis (AG) is performed by histology of biopsy specimens when atrophy is highly suspected endoscopically. However, multiple biopsies are invasive and time-consuming procedure and a few endoscopic biopsy samples could not reflect the entire extent of atrophy. Other non-invasive method to diagnosis of AG is serum pepsinogen which is referred to as “serologic biopsy”. Pepsinogen (PG) I is exclusively produced by chief and mucous neck cells in the fundic glands, while PG II is secreted by these cells and also by the cells in the pyloric glands and Brunner’s glands.7 Serum PG has been found to be a marker of gastric mucosal status, including mucosal atrophy. A low PG I level and a low PG I/II ratio have been associated with severe gastric atrophy, and are frequently found in gastric cancer.
Chronic AG can be assessed endoscopically, histologically, and serologically and it is important to understand the relationships among these 3 diagnostic methods. Eshmuratov et al.8 reported that the correlation between endoscopic and histologic diagnosis of gastric atrophy and Yang et al.9 reported the relationship between endoscopic and serological diagnosis in Korean. However, there was no comprehensive study about these 3 methods in Korean population.
From this background, the aim of this study was to compare the diagnostic capability of each diagnostic method and to evaluate the correlations among endoscopic, histological, and serological diagnoses for the assessment of AG.
MATERIALS AND METHODS
1. Patients
We consecutively enrolled 2,558 subjects who visited Seoul National University Bundang Hospital and agreed with endoscopic procedure with histology and serologic test from March 2003 to August 2013. The patients who requested endoscopy with H. pylori test for gastric cancer screening were categorized into a control group and four different disease groups. The control group consisted of subjects who had only mild gastritis or normal endoscopic findings without any evidence of significant gastroduodenal disease. The four disease groups were benign gastric ulcer, duodenal ulcer, dysplasia, and gastric cancer. Patients in these groups were categorized according to endoscope and histology-based diagnoses. Patients with a history of any stomach surgery, H. pylori eradication therapy, systemic diseases for which medication was taken for a long period of time, or use of a proton pump inhibitor within 2 weeks of enrollment were excluded from the study. All of the patients provide written informed consent prior to enrollment. This study was approved by the Institutional Review Board of the Seoul National University Bundang Hospital, Korea.
2. Endoscopic Examination
The patients were required to fast for at least 6 hours before the endoscopic procedure. The endoscopy was performed using GIF-Q260 (Olympus Co., Tokyo, Japan) after local pharyngeal anesthesia was provided using lidocaine spray (xylocaine). Some patients demanded sedation and received 3–4 mg of intravenous midazolam. All endoscopic investigations were performed by a single highly experienced endoscopist (N.K.) to minimize inter- observer variability. The presence of gastric atrophy was decided by the well visualization of the submucosal vessel due to thinning of mucosa in the antrum and in the body, respectively. Endoscopic gastric mucosal atrophy was classified according to the Kimura-Takemoto classification.10 In this classification, atrophic patterns are classified into 6 types according to the location of the atrophic border. The closed-type atrophic gastritis was graded as C-1, C-2, C-3 and the open-type atrophic gastritis as O-1, O-2, O-3 according the extent of gastric atrophy. In the C-1 type, atrophic changes are visible only in the antrum. In the C-2 and C-3 types, the atrophic borders lie on the lesser curvature of the lower and upper portion of the body, respectively. In the O-1 type, the atrophic border lies between the lesser curvature and the anterior wall of the body; in O-2, the atrophic change spreads amid the anterior wall; and in O-3, the border lies between the anterior wall and the greater curvature.
3. Histologic Examination and H. pylori test
To determine the presence of current H. pylori infection, 10 biopsy specimens were taken for three types of H. pylori testing (histology, rapid urease testing, and culture). Two biopsy specimens were taken from the greater curvature of both the antrum and body of the stomach, respectively, and three from both the lesser curvature of the antrum and body, respectively. Among the 10 specimens, two from the antrum and two from the body were fixed in formalin, and assessed for the presence of H. pylori by modified Giemsa staining. Moreover, the degree of inflammatory cell infiltration (activity and chronic inflammation), atrophy (loss of appropriate glands), and metaplasia were determined by hematoxylin & eosin (H&E) staining by averaging the score of the biopsy specimens from the greater and lesser curvature of the stomach. The histological features of the gastric mucosa were recorded using the updated Sydney scoring system (i.e., 0=none, 1=slight, 2=moderate, and 3=marked).11 When the specimens were not prepared well enough to correctly evaluate the full-thickness gastric mucosa due to problems such as improper fixation, inaccurate orientation, and inappropriate sections, or whenever inflammation prevented a clear distinction between non atrophic and atrophic phenotypes these samples were classified as indefinite for atrophy12 and excluded from the enrollment in the present study.
One specimen from each, the lesser curvature of the antrum and the body was used for rapid urease testing (CLOtest, Delta West, Bentley, Australia). The result of rapid urease testing was finally read after 24 hours. Two specimens from the antrum and body were used for culture. The antral and body biopsy specimens were evaluated separately; organisms were identified as H. pylori by Gram staining, colony morphology, and positive oxidase, catalase, and urease reactions.13 If any one of these three H. pylori tests was positive, the host was regarded as having an on-going H. pylori infection.
4. Serum pepsinogen (PG) levels
Fasting serum was collected from all subjects at the time of study entry. The samples were centrifuged immediately at 4°C and stored at −70°C until used. Serum concentrations of pepsinogen I and II were measured using a latexenhanced turbidimetric immunoassay (L-TIA; Shima Laboratories, Tokyo, Japan), and PG I to PG II ratios (PG I/II) were calculated.
5. Statistical Analysis
Parametric continuous variables are presented as mean± standard deviation (SD) or mean±standard error (SE). Categorical variables are presented as numbers and percentages. Comparison between two groups was performed using student t-test for parametric continuous variables and categorical variables were analyzed using the chi-square test. Receiver operator characteristic (ROC) curves were used to determine optimal cut-off values for PG I and II, and for PG I/II ratio for the diagnosis of AG. P values of less than 0.05 were considered statistically significant. All statistical analyses were performed using SPSS software (version 20.0; SPSS Inc., Chicago, IL, USA).
RESULTS
1. Baseline characteristics of study subjects
The total number of study subjects was 2,558 (mean age 57.6 years; 1,506 men and 1,052 women). The subjects were categorized into five groups (a normal control group and four different disease groups). Test results for H. pylori showed that 1,541 (60.2%) subjects were H. pylori-positive and 991 (38.7%) were H. pylori-negative. The mean serum PG I level was 63.5 ng/ml, mean serum PG II level was 22.5 ng/ml and mean PG I/II ratio was 3.6. Closed-type AG was reported in 743 and 473 subjects showed open-type AG by Kimura-Takemoto classification (Table 1).
Table 1.
Baseline characteristics of the 2,558 study subjects
| Total (n=2,558) | |
|---|---|
| Age (years, mean±SD) | 57.6±13.4 |
| Male/female | 1,506/1,052 |
| Clinical diagnosis, n (%) | |
| Normal control | 779 (30.5) |
| Benign gastric ulcer | 246 (9.6) |
| Duodenal ulcer | 200 (7.8) |
| Gastric dysplasia | 308 (12.0) |
| Gastric cancer | 1,025 (40.1) |
| H. pylori, n (%) | |
| Positive | 1,541 (60.2) |
| Negative | 991 (38.7) |
| Serum pepsinogens (mean±SD) | |
| Pepsinogen I (ng/ml) | 63.5±50.7 |
| Pepsinogen II (ng/ml) | 22.5±24.3 |
| Pepsinogen I/II ratio | 3.6±2.7 |
| Endoscopic finding | |
| Absence of atrophy | 1,204 |
| Closed-type atrophic gastritis | 743 |
| Open-type atrophic gastritis | 473 |
2. Correlation between serum PG levels and endoscopic gastric atrophy
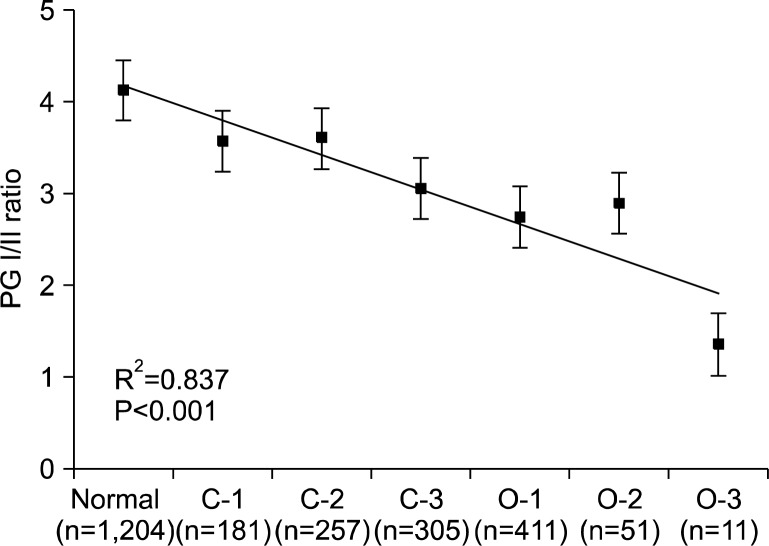
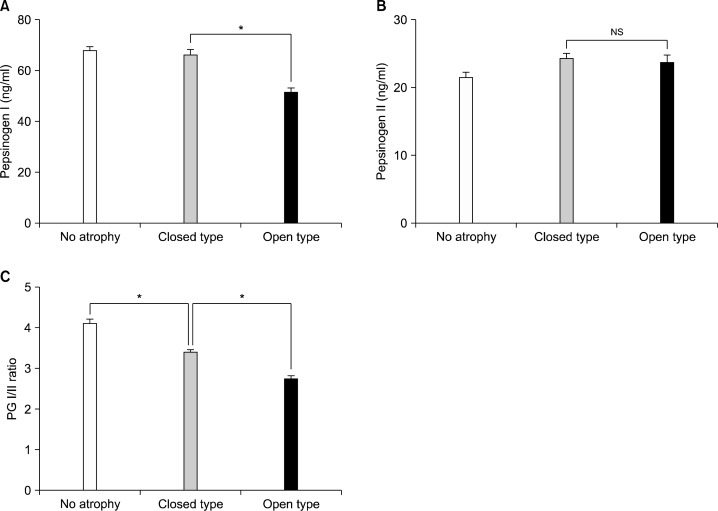
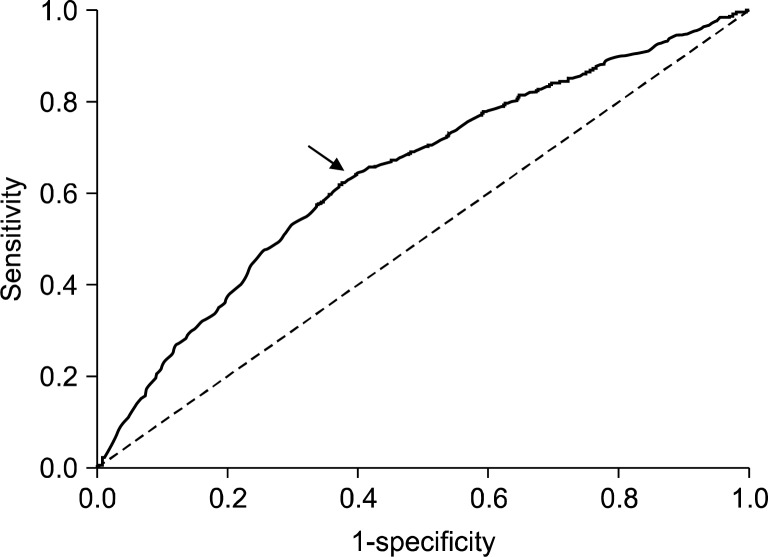
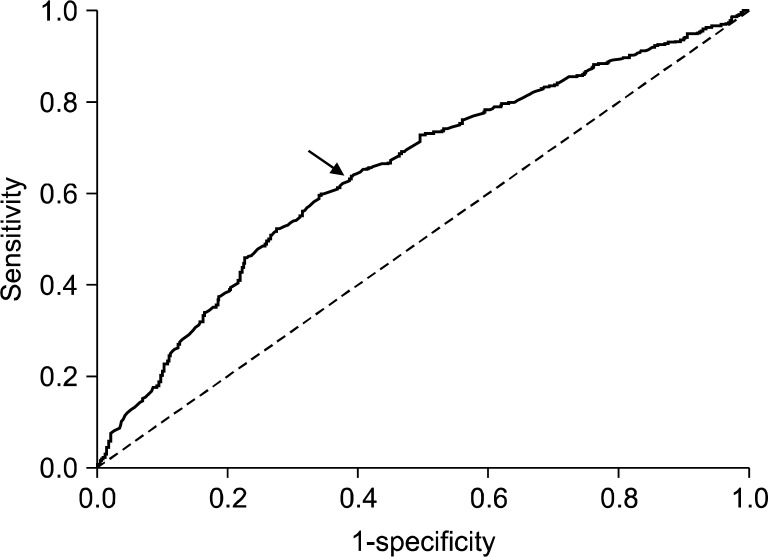
The serum PG I/II ratio showed a significant decreasing nature when the extent of atrophy by the Kimura- Takemoto classification was progressed from C-1 to O-3 (R2=0.837, P<0.001) (Fig. 1). Serum PG I levels were significantly lower in open-type AG compared to the closed-type AG (Fig. 2A), however, there was no significant differences in serum PG II levels among groups (Fig. 2B). PG I/II ratio decreased significantly as endoscopic gastric mucosal atrophy progressed (Fig. 2C). Receiver operator characteristic (ROC) curve revealed that the optimal PG I/II ratio cut-off value was 3.2 for distinguishing between presence and absence of endoscopic gastric mucosal atrophy, with 64.1% sensitivity and 60.2% specificity (Fig. 3).
Fig. 1.
Correlation between serum pepsinogen (PG) I/II ratio and endoscopic atrophic gastritis. The serum PG I/II ratio decreased significantly as gastric mucosal atrophy progressed. Data are presented as mean±S.E.
Fig. 2.
The serum pepsinogen (PG) levels depending on the distribution of atrophic gastritis by endoscopy. The level of serum PG I was significantly lower in open-type atrophic gastritis, closed-type atrophic gastritis (A). In contrast, serum PG II levels did not show any significant differences among groups (B). Serum PG I/II ratio decreased significantly as endoscopic gastric mucosal atrophy progressed (C). Data are presented as mean±S.E. *P<0.001; NS, not significant.
Fig. 3.
Receiver operator characteristic (ROC) curve in the diagnosis of endoscopic atrophic gastritis by serum pepsinogen (PG) I/II ratio. The optimal serum PG I/II ratio cut-off value was 3.2 (arrow) with 64.1% sensitivity and 60.2% specificity.
3. Correlation between serum PG levels and histologic gastric atrophy
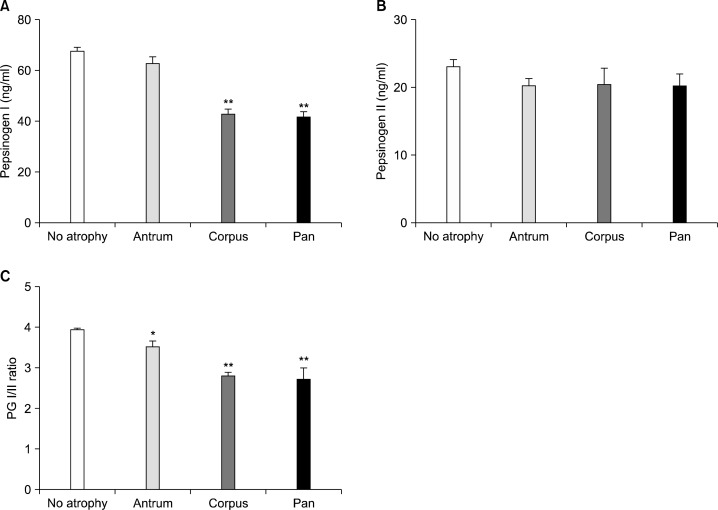
Serum PG I level was significantly lower in the corpus gastritis and pangastritis compared to the normal or antral gastritis (Fig. 4A). In contrast to PG I level, the PG II level showed no significant differences (Fig. 4B). Consequently, the PG I/II ratio was significantly lower in antral, corpus and pangastritis compared to the normal group (Fig. 4C). The ROC analysis of gastritis diagnosis by PG I/II ratio revealed an optimal PG I/II ratio cut-off of 3.0 for a diagnosis of histological gastritis with 63.7% sensitivity and 60.9% specificity (Fig. 5).
Fig. 4.
The serum pepsinogen (PG) I (A), PG II (B) levels, PG I/II ratio (C) depending on the extent of atrophy by histology. Antrum, antral predominant atrophic gastritis; Corpus, corpus predominant atrophic gastritis; Pan, panatrophic gastritis. *P<0.010 and **P<0.001 versus no atrophy group.
Fig. 5.
Receiver operator characteristic (ROC) curve in the diagnosis of histologic atrophic gastritis by pepsinogen (PG) I/II ratio. The optimal PG I/II ratio cut-off of 3.0 (arrow) with 63.7% sensitivity and 60.9% specificity.
4. Correlation between endoscopic and histological gastric atrophy
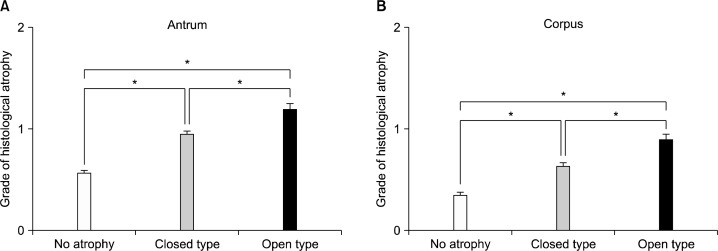
A significant correlation was shown between endoscopic AG and histological gastric atrophy grade in antrum (Fig. 6A) and corpus (Fig. 6B). The sensitivity and specificity of endoscopic diagnosis of antral AG depending on histology were 65.9% and 58.0%, respectively. The sensitivity and specificity of endoscopic diagnosis of corpus AG depending on histology were 71.3% and 53.7%, respectively (Table 2).
Fig. 6.
Correlation between histological atrophy grade and endoscopic atrophic gastritis. A significant correlation was shown between the grade of histological atrophy and endoscopic atrophic gastritis in the antrum (A) and in the corpus (B). *P<0.001.
Table 2.
The sensitivity, specificity of endoscopic AG based on histological AG
| Antrum | Corpus | |||
|---|---|---|---|---|
|
|
|
|||
| Histological AG absent | Histological AG present | Histological AG absent | Histological AG present | |
| Endoscopic AG absent | 470 | 353 | 698 | 201 |
| Endoscopic AG present | 341 | 682 | 602 | 500 |
| Sensitivity, % | 65.9 | 71.3 | ||
| Specificity, % | 58.0 | 53.7 | ||
AG, atrophic gastritis.
DISCUSSION
Our study showed strong correlations among the endoscopic, histological, and serological diagnoses of atrophic gastric, which has not been compared, so far. The diagnosis of histological AG is currently based on update Sydney System.11 Updated Sydney system recommends to take at least five biopsy specimens; two from the antrum, two from the corpus and one from the angle.11 However, multiple biopsies may not be easy to apply in usual clinical practices and accurately diagnosing the extent of AG based on a few biopsy samples is difficult because AG could present with patchy distribution. Furthermore, histological diagnosis of AG depends on subjective judgment without a gold standard.14,15 In addition, although endoscopist obtained an appropriate specimen, there existed a possibility of ‘not applicable’ in histological report. In this study, the proportion of ‘not applicable’ in histological diagnosis were 27.8% in antrum and 21.8% in corpus (data not shown).
Advantage of endoscopy over histologic diagnosis is its capability of evaluating distribution and quantification of atrophy. The endoscopic AG includes mucosal thinning, prominent submucosal vascularity, whitish color change, and absence of gastric rugae. The endoscopic gastric atrophy was classified into closed-type (C-1, C-2, C-3) and open-type (O-1, O-2, O-3), established by Kimura and Takemoto in 1969.10 The problem of diagnosis of AG by conventional endoscopy is high inter-observer variability16 and a poor correlation with histological findings. For example, the sensitivity of absence of rugae for moderate to severe AG in the gastric corpus was 67% and the sensitivity of the presence of visible vessels for moderate to severe atrophy in the corpus was 48%.17 In this study, the sensitivity and specificity of endoscopic atrophy based on the histological diagnosis were 66.1 and 59.5% in antrum and 72.3 and 55.0% in corpus, respectively.
Serum PG has been studied for a long time as non-invasive test for assessment of degree of gastric atrophy, especially in Japan. In early stage of gastritis, both PG I and PG II increase, however, when the inflammation progressed chief cells are replaced by pyloric glands, PG I level starts to decrease while the level of PG II remains elevated. As a result, PG I/II ratio starts to decrease. Low serum PG I level and PG I/II ratio have been used as a surrogate marker for AG and have been studied as a biomarker to select high risk group for gastric cancer.7,18 As AG is acknowledged to be a precancerous condition or frequently associated finding especially in case of intestinal type of gastric cancer, the decrease of PG I ≤70 ng/ml concentration and PG I/II ratio ≤3 has been widely accepted as a cut off value for gastric cancer in Japan.19–21
Several studies have yielded conflicting results regarding the values of PG as biomarkers of AG. Broutet et al.22 showed that only PG I/II ratio was a reliable marker of AG in the corpus with a sensitivity of 77% and a specificity of 87% at a cut-off value of 5.6. Similarly, previous Korean study showed that a PG I of ≤70 ng/ml was found to have a sensitivity of around 80% for detecting corpus AG, but was associated with very low specificity, of around 30%.23 In contrast, a PG I/II ratio of ≤3 showed moderate sensitivity (66.8% and 67.5%, respectively) and high specificity (74.7% and 70.1%, respectively) for detecting corpus AG.23 Furthermore, in 147 asymptomatic Italian subjects PG I, PG II, and PG I/II ratio were note reliable for predicting antral predominant AG,24 suggesting that the values of PG levels as a biomarker of AG could be variable in each country or each population. In present study, a PG I/II ratio ≤3.0 showed moderate sensitivity (63.7%) and specificity (60.9%) for a diagnosis of histological gastritis. In case of open-type AG, PG I/II ratio was mostly under 3, and as the extent of AG increased, the serum PG I/II ratio decreased and thus gastric cancer ratio increased.25 In this study, the serum pepsinogen I/II ratio showed a significant decreasing nature when the extent of atrophy progressed from C-1 to O-3.
Advantages of serum PG test include that this test can be performed simultaneously with other blood tests, can be gained as numeric values enabling a more objective evaluation, can reveal high risk group of gastric cancer to take more attention, there’s no need to fasting before the test and also can be tested on pregnant women.26,27 However, PG II level would be decreased after the eradication therapy of H. pylori is done. Considering PG value is known to be not fluctuating throughout several years, grouping higher risk of patients for gastric cancer using PG test could be used as efficient tool for recommending those patients to receive more frequent endoscopic evaluation. PG test is not adequate for patients who take gastric acid inhibitors or who have chronic kidney diseases showing higher PG level which is lowered after gastrectomy.
The strengths of this study are as follows: long study duration in a large cohort and a comprehensive review with a consistent cohort in a single center. Takao et al.28 also demonstrated significant correlations between serum pepsinogen levels, endoscopic gastritis, and histological gastritis in 319 Japanese subjects. However, the sample size is relatively small compare to our study. Another strong point is that all endoscopic investigations were performed by a single highly experienced endoscopist, by which inter-observer variability was minimized and diagnostic consistency was maintained.
In conclusion, the endoscopic, histologic, and serologic atrophic gastritis showed a relatively good correlation. However, the sensitivity and specificity of endoscopic findings and serologic results for the diagnosis of atrophic gastritis are not so high and histological diagnosis has its limitations. Thus, a multifactorial assessment might be needed to ameliorate the diagnostic accuracy of atrophic gastritis.
Acknowledgments
The authors thank the Medical Research Collaborating Center at Seoul National University Bundang Hospital for statistical analyses. This work was supported by a National Research Foundation (NRF) of Korea grant for the Global Core Research Center (GCRC) funded by the Korea government (MSIP) (No. 2011-0030001).
REFERENCES
- 1.Correa P. A human model of gastric carcinogenesis. Cancer Res. 1988;48:3554–60. [PubMed] [Google Scholar]
- 2.Correa P. Human gastric carcinogenesis: a multistep and multifactorial process--First American Cancer Society Award Lecture on Cancer Epidemiology and Prevention. Cancer Res. 1992;52:6735–40. [PubMed] [Google Scholar]
- 3.de Vries AC, van Grieken NC, Looman CW, Casparie MK, de Vries E, Meijer GA, et al. Gastric cancer risk in patients with premalignant gastric lesions: a nationwide cohort study in the Netherlands. Gastroenterology. 2008;134:945–52. doi: 10.1053/j.gastro.2008.01.071. [DOI] [PubMed] [Google Scholar]
- 4.Dinis-Ribeiro M, Areia M, de Vries AC, Marcos-Pinto R, Monteiro-Soares M, O’Connor A, et al. Management of pre-cancerous conditions and lesions in the stomach (MAPS): guideline from the European Society of Gastrointestinal Endoscopy (ESGE), European Helicobacter Study Group (EHSG), European Society of Pathology (ESP), and the Sociedade Portuguesa de Endoscopia Digestiva (SPED) Endoscopy. 2012;44:74–94. doi: 10.1055/s-0031-1291491. [DOI] [PMC free article] [PubMed] [Google Scholar]
- 5.Jung KW, Won YJ, Kong HJ, Oh CM, Seo HG, Lee JS. Cancer statistics in Korea: incidence, mortality, survival and prevalence in 2010. Cancer Res Treat. 2013;45:1–14. doi: 10.4143/crt.2013.45.1.1. [DOI] [PMC free article] [PubMed] [Google Scholar]
- 6.Lim SH, Kwon JW, Kim N, Kim GH, Kang JM, Park MJ, et al. Prevalence and risk factors of Helicobacter pylori infection in Korea: nationwide multicenter study over 13 years. BMC Gastroenterol. 2013;13:104. doi: 10.1186/1471-230X-13-104. [DOI] [PMC free article] [PubMed] [Google Scholar]
- 7.Kim N, Jung HC. The role of serum pepsinogen in the detection of gastric cancer. Gut Liver. 2010;4:307–19. doi: 10.5009/gnl.2010.4.3.307. [DOI] [PMC free article] [PubMed] [Google Scholar]
- 8.Eshmuratov A, Nah JC, Kim N, Lee HS, Lee HE, Lee BH, et al. The correlation of endoscopic and histological diagnosis of gastric atrophy. Dig Dis Sci. 2010;55:1364–75. doi: 10.1007/s10620-009-0891-4. [DOI] [PubMed] [Google Scholar]
- 9.Yang JH, Lee S-Y, Hong SN, Kim JH, Sung IK, Park HS, et al. Changing Trends of Serum Pepsinogen I/II Ratio in Asymptomatic Subjects. Korean J Helicobacter Up Gastrointest Res. 2012;12:96–102. [Google Scholar]
- 10.Kimura K, Takemoto T. An endoscopic recognition of the atrophic border and its significance in chronic gastritis. Endoscopy. 1969;1:87–97. [Google Scholar]
- 11.Dixon MF, Genta RM, Yardley JH, Correa P. Classification and grading of gastritis. The updated Sydney System. International Workshop on the Histopathology of Gastritis, Houston 1994. Am J Surg Pathol. 1996;20:1161–81. doi: 10.1097/00000478-199610000-00001. [DOI] [PubMed] [Google Scholar]
- 12.Rugge M, Correa P, Dixon MF, Fiocca R, Hattori T, Lechago J, et al. Gastric mucosal atrophy: interobserver consistency using new criteria for classification and grading. Aliment Pharmacol Ther. 2002;16:1249–59. doi: 10.1046/j.1365-2036.2002.01301.x. [DOI] [PubMed] [Google Scholar]
- 13.Kim N, Kim JM, Kim CH, Park YS, Lee DH, Kim JS, et al. Institutional difference of antibiotic resistance of Helicobacter pylori strains in Korea. J Clin Gastroenterol. 2006;40:683–7. doi: 10.1097/00004836-200609000-00004. [DOI] [PubMed] [Google Scholar]
- 14.Plummer M, Buiatti E, Lopez G, Peraza S, Vivas J, Oliver W, et al. Histological diagnosis of precancerous lesions of the stomach: a reliability study. Int J Epidemiol. 1997;26:716–20. doi: 10.1093/ije/26.4.716. [DOI] [PubMed] [Google Scholar]
- 15.Guarner J, Herrera-Goepfert R, Mohar A, Sanchez L, Halperin D, Ley C, et al. Interobserver variability in application of the revised Sydney classification for gastritis. Hum Pathol. 1999;30:1431–4. doi: 10.1016/s0046-8177(99)90164-8. [DOI] [PubMed] [Google Scholar]
- 16.Laine L, Cohen H, Sloane R, Marin-Sorensen M, Weinstein WM. Interobserver agreement and predictive value of endoscopic findings for H. pylori and gastritis in normal volunteers. Gastrointest Endosc. 1995;42:420–3. doi: 10.1016/s0016-5107(95)70043-9. [DOI] [PubMed] [Google Scholar]
- 17.Redeen S, Petersson F, Jonsson KA, Borch K. Relationship of gastroscopic features to histological findings in gastritis and Helicobacter pylori infection in a general population sample. Endoscopy. 2003;35:946–50. doi: 10.1055/s-2003-43479. [DOI] [PubMed] [Google Scholar]
- 18.Fock KM, Talley N, Moayyedi P, Hunt R, Azuma T, Sugano K, et al. Asia-Pacific consensus guidelines on gastric cancer prevention. J Gastroenterol Hepatol. 2008;23:351–65. doi: 10.1111/j.1440-1746.2008.05314.x. [DOI] [PubMed] [Google Scholar]
- 19.Watanabe Y, Kurata JH, Mizuno S, Mukai M, Inokuchi H, Miki K, et al. Helicobacter pylori infection and gastric cancer. A nested case-control study in a rural area of Japan. Dig Dis Sci. 1997;42:1383–7. doi: 10.1023/a:1018833819860. [DOI] [PubMed] [Google Scholar]
- 20.Ohata H, Kitauchi S, Yoshimura N, Mugitani K, Iwane M, Nakamura H, et al. Progression of chronic atrophic gastritis associated with Helicobacter pylori infection increases risk of gastric cancer. Int J Cancer. 2004;109:138–43. doi: 10.1002/ijc.11680. [DOI] [PubMed] [Google Scholar]
- 21.Kitahara F, Kobayashi K, Sato T, Kojima Y, Araki T, Fujino MA. Accuracy of screening for gastric cancer using serum pepsinogen concentrations. Gut. 1999;44:693–7. doi: 10.1136/gut.44.5.693. [DOI] [PMC free article] [PubMed] [Google Scholar]
- 22.Broutet N, Plebani M, Sakarovitch C, Sipponen P, Megraud F. Pepsinogen A, pepsinogen C, and gastrin as markers of atrophic chronic gastritis in European dyspeptics. Br J Cancer. 2003;88:1239–47. doi: 10.1038/sj.bjc.6600877. [DOI] [PMC free article] [PubMed] [Google Scholar]
- 23.Kang JM, Kim N, Yoo JY, Park YS, Lee DH, Kim HY, et al. The Role of Serum Pepsinogen and Gastrin Test for the Detection of Gastric Cancer in Korea. Helicobacter. 2008;13:146–56. doi: 10.1111/j.1523-5378.2008.00592.x. [DOI] [PubMed] [Google Scholar]
- 24.Ricci C, Vakil N, Rugge M, Gatta L, Perna F, Osborn JF, et al. Serological markers for gastric atrophy in asymptomatic patients infected with Helicobacter pylori. Am J Gastroenterol. 2004;99:1910–5. doi: 10.1111/j.1572-0241.2004.40614.x. [DOI] [PubMed] [Google Scholar]
- 25.Yanaoka K, Oka M, Ohata H, Yoshimura N, Deguchi H, Mukoubayashi C, et al. Eradication of Helicobacter pylori prevents cancer development in subjects with mild gastric atrophy identified by serum pepsinogen levels. Int J Cancer. 2009;125:2697–703. doi: 10.1002/ijc.24591. [DOI] [PubMed] [Google Scholar]
- 26.Miki K. Gastric cancer screening using the serum pepsinogen test method. Gastric Cancer. 2006;9:245–53. doi: 10.1007/s10120-006-0397-0. [DOI] [PubMed] [Google Scholar]
- 27.Miki K, Morita M, Sasajima M, Hoshina R, Kanda E, Urita Y. Usefulness of gastric cancer screening using the serum pepsinogen test method. Am J Gastroenterol. 2003;98:735–9. doi: 10.1111/j.1572-0241.2003.07410.x. [DOI] [PubMed] [Google Scholar]
- 28.Takao T, Ishikawa T, Ando T, Takao M, Matsumoto T, Isozaki Y, et al. Multifaceted Assessment of Chronic Gastritis: A Study of Correlations between Serological, Endoscopic, and Histological Diagnostics. Gastroenterol Res Pract. 2011;2001:631461. doi: 10.1155/2011/631461. [DOI] [PMC free article] [PubMed] [Google Scholar]


