Abstract
Heavy metal ions released into various water systems have a severe impact on the environment and human beings, and excess exposure to toxic metal ions through drinking water poses high risks to human health and causes life-threatening diseases. Thus, there is high demand for the development of a rapid, low-cost, and sensitive method for detection of metal ions in water. We present a portable analytical system for colorimetric detection of lead (Pb2+) and aluminum (Al3+) ions in water based on gold nanoparticle probes and lab-on-a-chip instrumentation. The colorimetric detection of metal ions is conducted via single-step assays with low limits of detection (LODs) and high selectivity. We design a custom-made microwell plate and a handheld colorimetric reader for implementing the assays and quantifying the signal readout. The calibration experiments demonstrate that this portable system provides LODs of 30 ppb for Pb2+ and 89 ppb for Al3+, both comparable to bench-top analytical spectrometers. It promises an effective platform for metal ion analysis in a more economical and convenient way, which is particularly useful for water quality monitoring in field and resource-poor settings.
I. INTRODUCTION
Various metal ions are released into our aqueous environments from natural and anthropogenic sources, and some of these ions are toxic at excessive or even trace levels and could, thus, induce major threats to human health.1 For instance, lead ions (Pb2+) cause hepatic toxicity associated with perturbations in multiple metabolic pathways (e.g., heme synthesis, cholesterol, and drug metabolisms), and long-term exposure to Pb2+ will cause chronic kidney and liver diseases.2 Aluminum ions (Al3+), existing at high concentrations in more acidic or organics-rich water, are a risk factor that may cause or accelerate the onset of Alzheimer disease in humans.3 The accurate detection and quantification of toxic metal ions in water are thus necessary and crucial in many applications such as environmental monitoring, water quality control, and waste water treatment.4–6 In some application scenarios (e.g., on-site assays with limited resources), high portability, fast assay speed, and ease of operations are desired features of the assays for detection of metal ions.
Conventional analytical techniques for detection of metal ions include inductively coupled plasma mass spectrometry,7,8 atomic absorption spectrophotometry,9 X-ray fluorescence spectrometry,10,11 and electrochemical analysis,12,13 all of which provide accurate and sensitive quantification of metal ions in aqueous solutions. However, these techniques usually rely on sophisticated and bulky instruments, and are highly skill dependent and time consuming; thus, they are difficult to implement outside laboratory environments, and cannot meet various needs of on-site metal ion assays. Different from these instrument-dependent analytical approaches, simple colorimetric assays represent another highly attractive route to detection of metal ions, which are easy to implement, moderately sensitive, highly specific, and less instrument-dependent. A common paradigm of colorimetric detection of metal ions employs the size-dependent optical properties of gold nanoparticles (AuNPs) for signal production and amplification. AuNPs, with properly tuned surface chemistry, could coordinate with metal ions and form aggregates, thus changing the surface plasmon resonance (SPR) absorbance of the assay solution. A variety of AuNP-based colorimetric assays have been developed for detection of metal ions,14–19 and these advances make it possible to develop portable platforms for on-site environmental monitoring.
The objective of this research is to create a portable analytical system for detection of metal ions in water by combining the powerful AuNP-based colorimetric methods with lab-on-a-chip instrumentation. We utilize two AuNP-based, single-step assays for colorimetric detection of Pb2+ and Al3+ in water with high selectivity and low limits of detection (LOD). We develop a custom-made microwell plate for implementing the assays and a handheld colorimetric reader for signal quantification. We demonstrate that this portable system provides LODs of 30 ppb for Pb2+ (slightly higher than the requirement of ≤10 ppb from World Health Organization20 or WHO) and 89 ppb for Al3+ (which meets the WHO requirement of ≤200 ppb). These results promise the practical application of our system after further protocol optimization of the Pb2+ assay. The portable system permits detection of metal ions in a more economical and convenient way, and is particularly useful for water quality monitoring in the field and resource-poor settings.
II. EXPERIMENTAL METHODS
A. Colorimetric detection of Pb2+ and Al3+
Colloidal gold nanoparticles (AuNPs) have been one of the most popular nanomaterials for analytical applications.21–23 AuNP is particularly suitable for use in optical sensing because its optical and chemical properties are readily tunable through adjusting its size, shape, concentration in solution, surface chemistry, and aggregation state.24 A common paradigm of using AuNPs for detection of metal ions is based on the metal-ion-induced aggregation of AuNPs in solution and the resultant change in the solution's absorbance spectrum.15–17 In this research, we employed two highly sensitive and specific assays for colorimetric detection of Pb2+ and Al3+. Both assays involve single-step mixing of the reagent and the water sample, and are particularly suitable for implementation on our portable system.
For Pb2+, we have developed a label-free colorimetric detection method based on peptide-facilitated gold nanoparticle aggregation.25 This assay relies on in-situ conjugation of label-free AuNPs, a common peptide glutathione (GSH—C10H17N3O6S), and the Pb2+, and does not require tedious pre-labelling of the AuNPs. As the major reagent, label-free AuNPs are more stable in solutions than the labelled ones (we achieved three-month storage at room conditions without aggregation). Using a bench-top ultraviolet-visible (UV-Vis) spectrometer, we have experimentally demonstrated a limit of detection of 6.0 ppb and high selectivity of Pb2+ detection over other 14 metal ions (including Al3+).25 In this work, we adapt this approach on our handheld analytical device for portable Pb2+ detection.
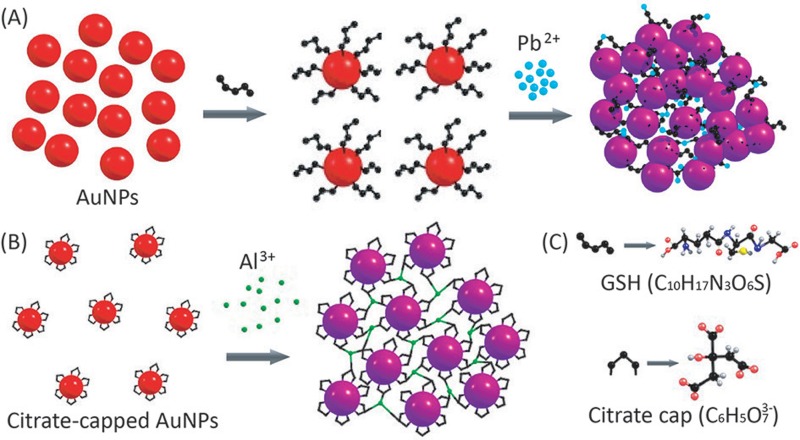
As shown in Fig. 1(A), the assay for Pb2+ detection involves the GSH to simultaneously functionalize AuNPs in situ (during the assay) and coordinate Pb2+, which induces AuNP aggregation. A GSH molecule contains one thiol group and two carboxyl groups (Fig. 1(C)); the thiol group specifically recognizes AuNP with high affinity, and the carboxylic group binds with Pb2+ strongly due to chelating ligands. GSH itself can bind with AuNPs and cause weak aggregation; with the presence of Pb2+, the aggregation will be significantly magnified.
FIG. 1.
Schematic mechanisms of Pb2+ and Al3+ detection using AuNPs: (A) A GSH molecule binds with a label-free AuNP at its thiol group and simultaneously coordinates with Pb2+ at its carboxylic groups, leading to aggregation of AuNPs and shift of absorbance spectrum of the AuNP solution. (B) Citrate-capped AuNPs aggregate in the presence of Al3+, inducing shift of absorbance spectrum of the AuNP solution. (C) Molecular structures of the GSH and citrate cap.
For detecting Al3+, we adopted a previously reported approach that involves citrate-capped AuNPs21 for Al3+ induced aggregation. Compared with other ions, Al3+ has a much higher stable constant for citrate binding.26 The reaction mechanism of Al3+ detection is illustrated in Fig. 1(B). With the addition of Al3+ into a citrated-capped AuNP solution, the aggregation state of the AuNPs changes from mono-dispersion to emulsion, and its absorbance above 610 nm shifts according to the concentration of Al3+. Consequently, the solution changes its color from rich red to bluish purple.
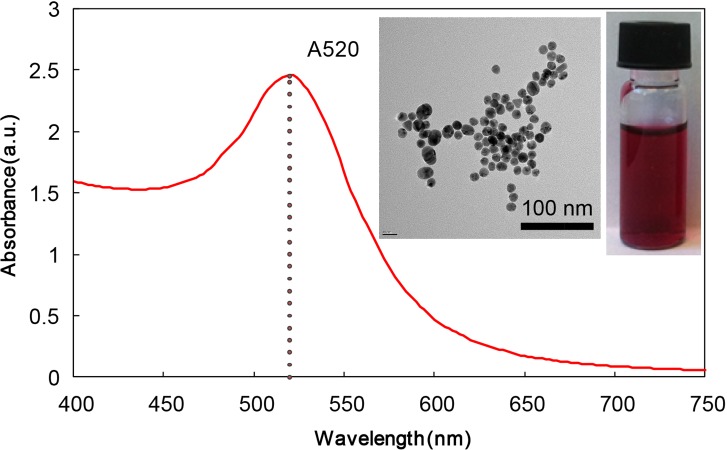
The AuNPs used in this work have a narrow size distribution of 15.2 ± 3.6 nm, which corresponds to a characteristic absorbance peak of 520 nm (Fig. 2). In both assays, the absorbance of AuNP solutions decreases at 520 nm and significantly increases at 610 nm. Although it is a common practice to measure the absorbance ratio at 610 nm and 520 nm, we opted to only quantify the absorbance at 610 nm as the readout because the absorbance shifts at 520 nm were too subtle to be accurately measured by our portable spectrometer. Our calibration experiments, presented in Sec. III, demonstrate that the absorbance measurement at 610 nm was sensitive enough to yield satisfactory analytical performance.
FIG. 2.
The absorbance curve of AuNP solution with a peak at 520 nm. The insets include a transmission electron microscopy (TEM) image of the gold nanoparticles and a photograph of the AuNP aqueous solution.
B. Synthesis of colloidal AuNPs
We synthesized citrate-capped AuNPs by using the traditional Turkevich-Frens method with minor modifications.25,27,28 We first heated 100 ml of 1 mM HAuCl4 to boiling in a flask with a condenser, then added 10 ml of 38.8 mM sodium citrate to the flask. After the solution turned from pale yellow into ruby red, we kept the mixture boiling for an additional 30 min to complete the reaction. We finally cooled down the AuNP solution with stirring and stored at room temperature prior to the assay. The concentration of the AuNPs was 13 nM. The citrate-capped AuNPs solution we synthesized had a shelf life of three months.
C. Design and fabrication of the portable system
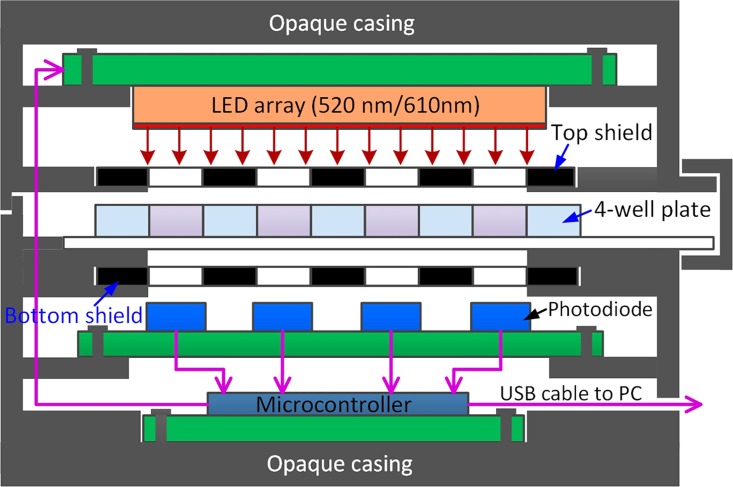
To implement the Pb2+ and Al3+ detections in a portable format, we developed a lab-on-a-chip platform for performing the metal ion assays and absorbance measurements on site. The platform, as schematically illustrated in Fig. 3, includes a custom-made microwell plate for holding the assay solutions, and a handheld colorimetric reader for accommodating the microwell plate and measuring the absorbance shift in the solutions after reaction. The microwell plate includes four microwells (depth: 3.5 mm; diameter: 6.0 mm; pitch: 10.0 mm) constructed in a piece of polydimethylsiloxane (PDMS) elastomer. We determined the microwell diameter to be 6 mm based on the size of the photodiodes (3.6 mm × 4 mm) in the colorimetric reader so that each photodiode could be well aligned underneath a microwell (Fig. 3).
FIG. 3.
Schematic cross-section diagram of the portable analytical system which consists of a four-microwell plate and a handheld colorimetric reader. The four-microwell plate is inserted in the colorimetric reader for absorbance measurement.
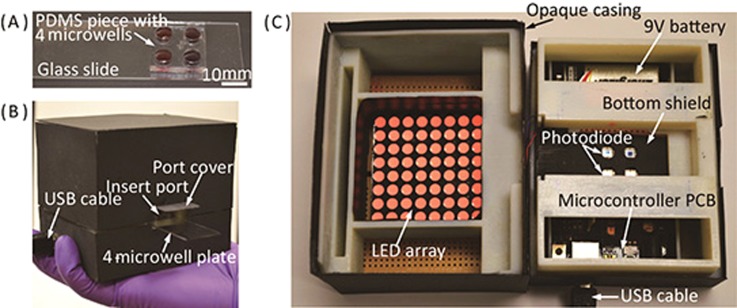
For fabrication of the microwell plate, we created through holes on the PDMS piece using a 6-mm biopsy punch, and then permanently bonded the PDMS piece onto a glass slide (25 mm × 75 mm × 1 mm) via oxygen plasma treatment. Fig. 4(A) shows the photograph of a microwell plate filled with solutions after Al3+ detection. The microplate is disposable, and can also be reused after thorough cleaning. Although we just integrated four microwells at the prototyping stage, the system architecture allows easy scale-up of the reaction microwells. A larger plate with more microwells simply requires the colorimetric reader to be enlarged and the number of photodiodes to be increased accordingly. We used PDMS and glass for construction of the microwell plate due to their high transparency and flexibility for prototyping. For mass production, injection molding of transparent plastics can be employed to provide a much lower cost structure of the microwell plate.
FIG. 4.
Photographs of the portable system. (A) A microwell plate filled with solutions of AuNP and Al3+. (B) The colorimetric reader held by a hand, with a microwell plate inserted. (C) Inside of the colorimetric reader with the LED array lighting up.
The colorimetric reader includes four main components (Fig. 3): (i) a narrow-band light-emitting diode (LED) array (model # YSM-2088CR3G2C, Young Sun LED) with emission wavelengths of 512–518 nm (green) and 610–625 nm (red); (ii) four photodiodes (model # 595-OPT101PG4, Texas Instruments) mounted on a printed circuit board (PCB); (iii) a microcontroller (Arduino UNO board) with universal serial bus (USB) communication for controlling the LED array, quantifying the voltage outputs of the photodiodes, and transmitting measurement data to a computer; and (iv) an opaque plastic casing for accommodating and optically shielding all the electronic components and the microwell plate. The microwell plate can be inserted into the reader, and guiding slots on the plastic casing guarantees fixed gaps between the microwell plate and the LED/photodiodes. Two black shield layers with four openings were placed on the top and bottom of the microwell plate to decrease optical crosstalks between adjacent microwells and therefore suppress background noises in measurement. The total material cost of the colorimetric reader was calculated to be 87 CAD based on commercial prices of the electronic components.
Fig. 4(B) shows the colorimetric reader held by a hand with a microwell plate inserted, and Fig. 4(C) shows the inside of the colorimetric reader. The LED array consists of 8 × 8 dual-color LED ‘pixels,’ providing uniform illustration for absorbance measurement. The LED ‘pixels’ can emit light at wavelengths of 512–518 nm (green) and 610–625 nm (red), and the microprocessor controls the emission wavelength by altering the supply voltage to the LED array (4.4 V for green and 5.0 V for red). The emission range of 610–625 nm of the LED array was experimentally proved effective for the absorbance measurement at 610 nm. The photodiode chip integrates a signal conditioning circuit, and can be powered by a 9 V battery (Fig. 4(C)). In our current prototype, voltage signals from the photodiodes are transmitted to a computer via the USB cable for data analysis. It is also feasible to integrate a liquid crystal display (LCD) for direct readout of assay results and a Bluetooth module for wireless data transmission from the reader to other devices such as smartphones, tablets, and computers for further analysis.
D. Assay protocols
For Pb2+ detection, we used the original AuNP solution, and prepared a GSH mixture by the following steps. We first made a solution of NaCl (1 M) as background electrolyte, a phosphate buffer solution (50 mM, pH 7), and a GSH solution (100 mM). Then, we prepared the GSH mixture by mixing 110 μl of the NaCl solution, 620 μl of the phosphate butter, and 480 μl of the GSH solution, and 790 μl of distilled water. Before each experiment, we prepared fresh deionized (DI) water samples spiked with Pb2+ at incremental concentrations of 0 ppb, 50 ppb, 100 ppb, 200 ppb, and 500 ppb.
To perform an assay, we first filled 41.5 μl of Pb2+ spiked water in a microwell, then added 12 μl of GSH mixture and 34.6 μl of AuNP solution, and mixed them by pipetting. After 10 min of incubation (determined experimentally; refer to Sec. III A), we slowly slid the microwell plate into the colorimetric for absorbance measurement.
For Al3+ detection, we directly used citrate-capped AuNPs that can be coordinated by Al3+ and form aggregates. We experimentally determined the optimal pH value of the AuNP solution to be 2.24, which yielded the best sensitivity at low concentrations of Al3+. Before experiments, we prepared fresh DI water samples spiked with Al3+ at incremental concentrations of 0 ppb, 100 ppb, 200 ppb, 300 ppb, and 400 ppb. For detections performed on the four-microwell plate, we first filled 45 μl of the Al3+ spiked water in each microwell and then added 45 μl of AuNP to the microwell to initiate the reaction. After complete mixing via pipetting, we incubated the mixtures for 8 min (determined experimentally; refer to Sec. III A) and measured colorimetric signals from all the microwells using the colorimetric reader.
For performance comparison, we also implemented the same assays of Pb2+ and Al3+ in 96-well plates using UV-Vis spectrometry. For Pb2+ detection, we mixed 100 μl of water sample, 50 μl of GSH mixture, and 150 μl of AuNP solution in each well, incubated the mixture for 10 min, and measured the absorbance at A610. For Al3+ detection, we mixed 150 μl of water sample and 150 μl of AuNP solution, incubated the mixture for 8 min, and measured the absorbance at A610. Note that we adopted a higher volume of the sample/reagent mixture for assays on UV-Vis spectrometry (300 μl vs. ∼90 μl for assays on the portable system) to achieve an adequate length of light path through the solution for UV-Vis measurement.
III. RESULTS AND DISCUSSION
A. Analysis of AuNP aggregation kinetics via the handheld reader
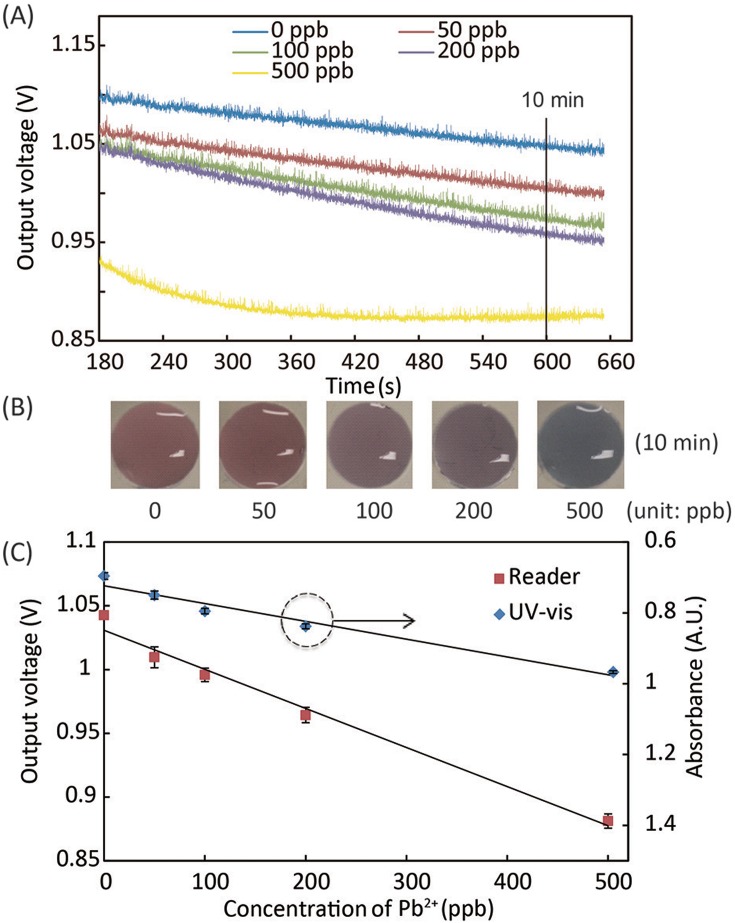
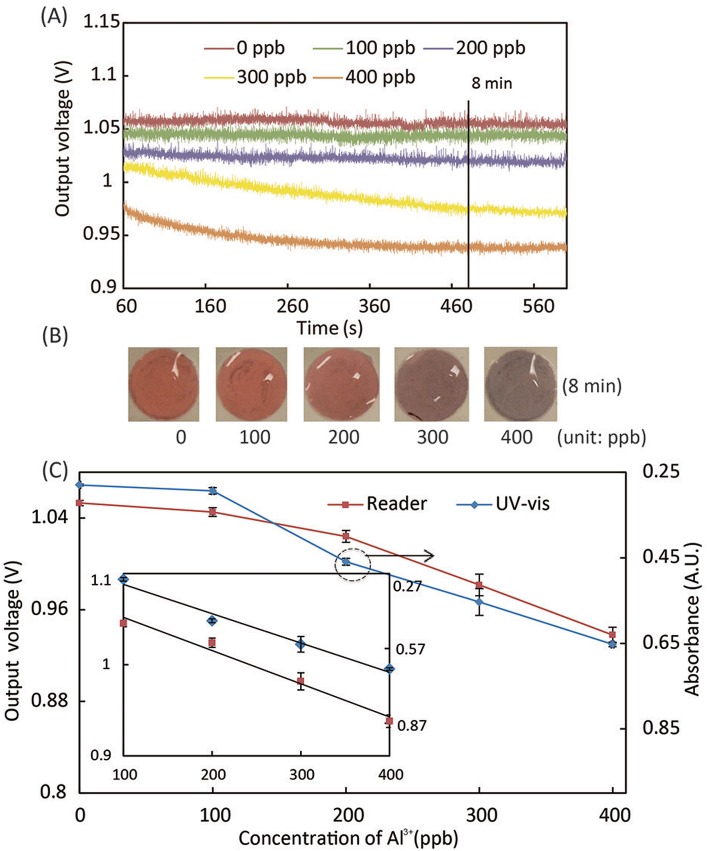
To understand the kinetics of AuNP aggregation during Pb2+ and Al3+ assays, we quantified the changes in absorbance of the mixture of water sample and detection reagent at 610 nm using the portable system. The absorbance of the sample/reagent mixture was monitored within the first 11 min of the reaction. Figs. 5(A) and 6(A) show the reaction kinetics of Pb2+ and Al3+ assays in terms of light absorbance change. The output signal from the photodiode is in the form of voltage, while a higher voltage value linearly corresponds to a lower absorbance level at 610 nm. In the Pb2+ assays (Fig. 5(A)), the absorbance of light at 610 nm through the reaction solution became lower with time; at the same time point of reaction, higher concentrations of Pb2+ yielded higher absorbance levels (lower output voltages of the photodiode) in the measurement range of 0–500 ppb. The Al3+ assay followed the same trend of light absorbance in the measurement range of 0–400 ppb. Beyond these measurement ranges, the aggregated AuNPs were too large to remain colloidal in the solution, resulting in saturated or even lower light absorbance. Based on the data of reaction kinetics, we chose the time points for signal measurement in Pb2+ and Al3+ assays to be 10 min and 8 min after reaction starts. Note that, at 0 ppb of Pb2+, the absorbance level slightly increased (which corresponds to the 0 ppb data curve in Fig. 5(A)) because of the GSH-induced weak aggregation of AuNPs in the absence of Pb2+.
FIG. 5.
Experimental results of the Pb2+ assay. (A) The kinetic curve of AuNP aggregation in Pb2+ solutions in terms of light absorbance at 610 nm. (B) Photographs of assay solutions at different Pb2+ concentrations, which generated different levels of color change after 10-min reaction. (C) Calibration curves of the Pb2+ assay, obtained using the portable reader and UV-vis spectrometer,25 with linear regression equations of y = −0.00031x + 1.0 and y = 0.00050x + 0.72, for data from the portable reader and UV-Vis spectrometer, respectively.
FIG. 6.
Experimental results of the Al3+ assay. (A) The kinetic curve of AuNP aggregation in Al3+ solutions in terms of light absorbance at 610 nm. (B) Photographs of assay solutions at different Al3+ concentrations, which generated different levels of color change after 8-min reaction. (C) Calibration curves of the Al3+ assay, obtained using the portable reader and UV-Vis spectrometer. The inset includes linear regression curves of the calibration data in the range of 100–400 ppb, with equations of y = −0.00036x + 1.1 (for data from the portable reader) and y = 0.0012x + 0.20 (for data from the UV-Vis spectrometer).
B. Calibration results of Pb2+ and Al3+ assays
We performed calibration experiments of the Pb2+ and Al3+ assays using our portable system, and compared the results with the ones obtained using the conventional 96-well plate on a UV-Vis spectrometer. Figs. 5(B) and 6(B) show the color changes of assay solutions vs. Pb2+ and Al3+ concentrations, respectively. Figs. 5(C) and 6(C) illustrate calibration curves of the Pb2+ and Al3+ assays, collected using both the portable system and the UV-Vis spectrometer. The calibration curves from the portable system reveal very similar trends as the ones from the UV-Vis spectrometry, which validates the effectiveness of the colorimetric reader.
We calculated the LOD of Pb2+ assay using the linear regression of the data in the whole measurement range of 0–500 ppb. Considering the nonlinear calibration data of Al3+ assay at low concentrations, we calculated the LOD of Al3+ assay using the linear regression of the data in the range of 0–100 ppb. LODs of 30 ppb for Pb2+ and 89 ppb for Al3+ were achieved by the portable system, which are comparable with the UV-Vis spectrometry (56 ppb for Pb2+ and 46 ppb for Al3+). Our measurement ranges for Pb2+ (0–500 ppb) and Al3+ (0–400 ppb) cover the requirement for practical applications. The LOD of our Al3+ assay (89 ppb) meets the WHO standard (≤200 ppb), but our LOD for Pb2+ (30 ppb) is slightly higher than the WHO cutoff (≤10 ppb). The protocol optimization of the Pb2+ assay is underway to further decrease the LOD and make our system competent for practical Pb2+ detections. The experimental parameters being tuned include: (i) the mixing ratio of the sample and reagent solutions, (ii) the total volume of the sample/reagent mixture, and (iii) the incubation time. We will also replace the photodiodes on the reader with more sensitive ones, which could possibly enable the quantification of absorbance ratio at 610 nm and 520 nm and lead to a lower LOD.
C. Assay selectivity
We25 and others21 have experimentally demonstrated that the selectivity of the Pb2+ and Al3+ assays is sufficient to eliminate the interference of other metal ions possibly existing in water. In a previous study,25 we evaluated the selectivity of the Pb2+ assay against 14 metal ions (Ca2+, As3+, Mg2+, Hg2+, Cu2+, Ni2+, Fe3+, Ba2+, Co2+, Ag+, Mn2+, Cd2+, Zn2+, Cr3+, Al3+) using UV-Vis spectrometry. Masking agents that have high formation constants with the interfering ions were added to the reagent solution for minimizing the ions' interference with the Pb2+ assay. The experimental results show that most of the metal ions had negligible impact on the Pb2+ assay.25 Chen et al.21 investigated the interference of 10 metal ions (Hg2+, Fe3+, Cd2+, Ag+, Pb2+, Cu2+, Ni2+, Zn2+, Mn2+, Co2+) with the Al3+ assay we used in this work, and demonstrated the high selectivity of the assay over these metal ions. These results show that the Pb2+ and Al3+ assays have great potential to selectively detect the target metal ions in real water samples. We are currently performing more experiments on detecting Pb2+ and Al3+ in tap water samples, and investigating chemical routes to minimize the effect of other potential interfering ions and compounds in the samples.
IV. CONCLUSIONS
We have developed a portable and cost-effective lab-on-a-chip system and used it for colorimetric detection of Pb2+ and Al3+ in water. The Pb2+ and Al3+ assays were based on metal-ion-coordinated aggregation of AuNPs in solution, which produced changes in the light absorbance and therefore the color of the assay solution. We performed the reactions on a PDMS microwell plate, and employed a custom-made colorimetric reader for signal readout. The assay operations only included single-time mixing of the AuNP reagent solution and the water sample, timed incubation, and colorimetric signal measurement. We demonstrated that our portable system provided LODs of 30 ppb for Pb2+ and 89 ppb for Al3+, which are comparable with the values obtained via bench-top spectrometry. This portable system represents a promising solution to on-site analysis of metal ions in real water samples.
ACKNOWLEDGMENTS
This research was supported by Natural Sciences and Engineering Research Council of Canada (NSERC), Canada Foundation for Innovation, and McGill University. The authors also acknowledge financial support from the Canada Research Chairs Program and the McGill Chwang-Seto Faculty Scholarship Program (to Xinyu Liu), the McGill Summer Undergraduate Research in Engineering (SURE) Program (to Da-Eun Kim), and the NSERC-CREATE Training Program in Integrated Sensor Systems (to Chen Zhao).
References
- 1.Järup L., Br. Med. Bull. 68(1), 167–182 (2003). 10.1093/bmb/ldg032 [DOI] [PubMed] [Google Scholar]
- 2.Mudipalli A., Indian J. Med. Res. 126(6), 518 (2007); available at http://medind.nic.in/iby/t07/i12/ibyt07i12p518.pdf [PubMed] [Google Scholar]
- 3.Tomljenovic L., J. Alzheimer's Dis. 23(4), 567–598 (2011). 10.3233/JAD-2010-101494 [DOI] [PubMed] [Google Scholar]
- 4.Fu F. and Wang Q., J. Environ. Manage. 92(3), 407–418 (2011). 10.1016/j.jenvman.2010.11.011 [DOI] [PubMed] [Google Scholar]
- 5.Aragay G., Pons J., and Merkoçi A., Chem. Rev. 111(5), 3433–3458 (2011). 10.1021/cr100383r [DOI] [PubMed] [Google Scholar]
- 6.Li H., Li W., Zhang Y., Wang T., Wang B., Xu W., Jiang L., Song W., Shu C., and Wang C., J. Mater. Chem. 21(22), 7878–7881 (2011) 10.1039/c1jm10979k [DOI] [Google Scholar]
- 7.Liang P., Liu Y., Guo L., Zeng J., and Lu H., J. Anal. At. Spectrom. 19(11), 1489–1492 (2004). 10.1039/b409619c [DOI] [Google Scholar]
- 8.Liu Y., Liang P., and Guo L., Talanta 68(1), 25–30 (2005). 10.1016/j.talanta.2005.04.035 [DOI] [PubMed] [Google Scholar]
- 9.Frankowski M., Zioła-Frankowska A., Kurzyca I., Novotný K., Vaculovič T., Kanický V., Siepak M., and Siepak J., Environ. Monit. Assess. 182(1–4), 71–84 (2011). 10.1007/s10661-010-1859-8 [DOI] [PubMed] [Google Scholar]
- 10.Hołyńska B., Ostachowicz B., and Wȩgrzynek D., Spectrochim. Acta, Part B 51(7), 769–773 (1996). 10.1016/0584-8547(96)01470-X [DOI] [Google Scholar]
- 11.Watanabe H., Berman S., and Russell D., Talanta 19(11), 1363–1375 (1972). 10.1016/0039-9140(72)80133-4 [DOI] [PubMed] [Google Scholar]
- 12.Nie Z., Nijhuis C. A., Gong J., Chen X., Kumachev A., Martinez A. W., Narovlyansky M., and Whitesides G. M., Lab Chip 10(4), 477–483 (2010). 10.1039/b917150a [DOI] [PMC free article] [PubMed] [Google Scholar]
- 13.Shi J., Tang F., Xing H., Zheng H., Lianhua B., and Wei W., J. Braz. Chem. Soc. 23(6), 1124–1130 (2012). 10.1590/S0103-50532012000600018 [DOI] [Google Scholar]
- 14.Guo Y., Wang Z., Qu W., Shao H., and Jiang X., Biosens. Bioelectron. 26(10), 4064–4069 (2011). 10.1016/j.bios.2011.03.033 [DOI] [PubMed] [Google Scholar]
- 15.Date Y., Terakado S., Sasaki K., Aota A., Matsumoto N., Shiku H., Ino K., Watanabe Y., Matsue T., and Ohmura N., Biosens. Bioelectron. 33(1), 106–112 (2012). 10.1016/j.bios.2011.12.030 [DOI] [PubMed] [Google Scholar]
- 16.Date Y., Aota A., Terakado S., Sasaki K., Matsumoto N., Watanabe Y., Matsue T., and Ohmura N., Anal. Chem. 85(1), 434–440 (2013) 10.1021/ac3032146 [DOI] [PubMed] [Google Scholar]
- 17.Gao A., Liu X., Li T., Zhou P., Wang Y., Yang Q., Wang L., and Fan C., IEEE Sens. J. 11(11), 2820–2824 (2011). 10.1109/JSEN.2011.2170969 [DOI] [Google Scholar]
- 18.Fan C., He S., Liu G., Wang L., and Song S., Sensors 12(7), 9467–9475 (2012). 10.3390/s120709467 [DOI] [PMC free article] [PubMed] [Google Scholar]
- 19.Sun J., Xianyu Y., and Jiang X., Chem. Soc. Rev. 43, 6239–6253 (2014). 10.1039/C4CS00125G [DOI] [PubMed] [Google Scholar]
- 20.Organization W. H., Guidelines for Drinking-water Quality: First Addendum to Third Edition, Volume 1, Recommendations ( World Health Organization, 2006). [Google Scholar]
- 21.Chen S., Fang Y.-M., Xiao Q., Li J., Li S.-B., Chen H.-J., Sun J.-J., and Yang H.-H., Analyst 137(9), 2021–2023 (2012). 10.1039/c2an35129c [DOI] [PubMed] [Google Scholar]
- 22.Khan M. S., Vishakante G. D., and Siddaramaiah H., Adv. Colloid Interface Sci. 199–200, 44–58 (2013) 10.1016/j.cis.2013.06.003 [DOI] [PubMed] [Google Scholar]
- 23.Cao X., Ye Y., and Liu S., Anal. Biochem. 417(1), 1–16 (2011). 10.1016/j.ab.2011.05.027 [DOI] [PubMed] [Google Scholar]
- 24.Haiss W., Thanh N. T., Aveyard J., and Fernig D. G., Anal. Chem. 79(11), 4215–4221 (2007). 10.1021/ac0702084 [DOI] [PubMed] [Google Scholar]
- 25.Zhong G., MS thesis, ID # 121545, McGill University, 2014 [Google Scholar]
- 26.Martin R. B., J. Inorg. Biochem. 28(2–3), 181 (1986). 10.1016/0162-0134(86)80081-2 [DOI] [PubMed] [Google Scholar]
- 27.Turkevich J., Stevenson P. C., and Hillier J., Discuss. Faraday Soc. 11, 55–75 (1951). 10.1039/df9511100055 [DOI] [Google Scholar]
- 28.Liu J. and Lu Y., Nat. Protoc. 1(1), 246–252 (2006). 10.1038/nprot.2006.38 [DOI] [PubMed] [Google Scholar]


