Abstract
This paper reports the use of a recent composite material, noted hereafter i-PDMS, made of carbonyl iron microparticles mixed in a PolyDiMethylSiloxane (PDMS) matrix, for magnetophoretic functions such as capture and separation of magnetic species. We demonstrated that this composite which combine the advantages of both components, can locally generate high gradients of magnetic field when placed between two permanent magnets. After evaluating the magnetic susceptibility of the material as a function of the doping ratio, we investigated the molding resolution offered by i-PDMS to obtain microstructures of various sizes and shapes. Then, we implemented 500 μm i-PDMS microstructures in a microfluidic channel and studied the influence of flow rate on the deviation and trapping of superparamagnetic beads flowing at the neighborhood of the composite material. We characterized the attraction of the magnetic composite by measuring the distance from the i-PDMS microstructure, at which the beads are either deviated or captured. Finally, we demonstrated the interest of i-PDMS to perform magnetophoretic functions in microsystems for biological applications by performing capture of magnetically labeled cells.
I. INTRODUCTION
It is now well established that for numerous analysis and diagnosis performed on biological material — typically blood — trapping and separation functions are very important in microsystems.1,2 Among other techniques involving various external stresses such as dielectrophoretic,3,4 acoustic,5,6 optical,7,8 and hydrodynamic forces,9,10 the use of magnetophoresis in microsystems11–13 has been successfully demonstrated to isolate natively magnetic biological species —for example, deoxygenated red blood cells14–17 — or magnetically labeled cells,18–24 or DNA,25 from non magnetic ones. Indeed, using a hard magnetism approximation, when placed in a magnetic field gradient (∇⋅B) a magnetic microparticle which magnetic moment is considered uniform, experiences a magnetic force expressed as follows:
| (1) |
where Δχ = χp − χf represents the difference in magnetic susceptibilities, between the particle (χp) and the surrounding fluid (χf), r is the radius of the particle, and μ0 = 4π × 10−7 H m−1 the vacuum permeability. According to Equation (1), paramagnetic (Δχ > 0) and diamagnetic (Δχ < 0) species are therefore, respectively, attracted and repelled by high gradients of magnetic field.
In microsystem, the dominant competing force acting on particles is the hydrodynamic drag force defined by Stokes' law (Equation (2)),
| (2) |
where η is the viscosity, is the velocity of the particle, and is the velocity of the suspending medium.
In order to isolate the magnetic species from the remaining solution, the magnetic force acting on these particles must be greater than the drag force. Controlling the magnetic field distribution on the micrometer scale is a challenge. Actually, magnetophoretic separators implementing permanent magnets or electromagnets26 — characterized by centimeter to millimeter scale dimensions — at the vicinity of the microfluidic chamber, generate high magnetic field gradients mainly located at the neighbourhood of the magnet edges, and therefore, the magnetic force associated within the channel is small, on the typical scale of biological cells (tens of μm). More recently, it has been shown that magnetophoretic separators using High Gradient Magnetic Separation (HGMS) method can be used to separate biocomponents either based on their intrinsic magnetic properties or using magnetically labeled cells.15,18,19,27 Moreover, researchers have focused on the generation of high local and controlled magnetic field gradients to overcome the low magnetic forces exerted on biological materials because of their natively small magnetic susceptibilities.
Therefore, several techniques have been reported in the literature to achieve the generation of such controlled and very well located gradients. The injection of some ferromagnetic suspension into a side channel apart from the separation channel have been reported to generate magnetic field gradients sufficient to achieve separation of magnetic beads or cells.28 However, the flow rate enabling cell capture is relatively low: 6 μl/h. The use of micromagnets located within the channel has been reported to allow the capture of magnetic particles29 and magnetically labeled bacterial cells30 thus at a high technological cost. The introduction of ferromagnetic thin wires14,31,32 or microstructures15,33,34 mainly made of Nickel, inside the system is the most common method to create controlled local gradient for blood cells sorting and capture. Although these soft ferromagnetic structures allow the control of the magnetic field distribution on the micrometer scale, they are obtained by time-consuming electroplating techniques. Moreover, the heterogeneous integration of metallic materials in PDMS systems can generate leakage issues during operation. However, as previously demonstrated with carbon doped PDMS,35 PDMS composite materials present many advantages over metallic microstructures for the fabrication of active microfluidic devices. Indeed, we have shown that this material, combining properties of both compounds, allows the easy and fast integration of metallic microstructures using soft-lithography approach while preserving O2 plasma bonding properties of PDMS substrate and avoiding cumbersome alignment procedure. One recent publication reports the isolation of tumors cells from leukocytes, using a microsystem based on self assembled NdFeB-PDMS composite.36 The authors report a very high capture efficiency of magnetically labeled leucocytes, leading to an enrichment of the population of tumor cells by a factor of >103. However, despite these very good results, the use of permanent magnets does not allow the easy and rapid release of the targeted cells, which can be a difficulty for subsequent analysis.
The objective of this paper is therefore to evaluate another PDMS composite — Carbonyl Iron-PDMS, noted hereafter i-PDMS — to generate local gradients of magnetic field and then to carry out magnetophoresis based manipulations (capture or separation) in a microfluidic format. This material is composed of a PDMS matrix doped with carbonyl iron microparticles that give to this composite soft ferromagnetic property as already shown in previous papers.37–40 In past studies, authors demonstrated that this material can form magnetically actuated membranes38 to achieve micropumps39 and mixing functions37 in MEMS. However, to the best of our knowledge, no study was reported on the use of this material in magnetophoresis based microfluidic functions such as trapping and separation of magnetic species. We aim at demonstrating that i-PDMS composite is suitable to generate high gradients of magnetic field and can be used for magnetophoretic applications such as HGMS. We first report the preparation and characterization of i-PDMS with various doping ratios. Shape of the microstructures as well as the position of the permanent magnets relative to the structures was optimised numerically. Then, 500 μm i-PDMS diamond microstructures integrated along a PDMS microfluidic channel were evaluated for magnetophoresis functions. Trapping capacities of this material are demonstrated with quantitative measurements of the behavior of superparamagnetic microbeads flowing in the microsystem as a function of flow rate. The separation of para- and diamagnetic species is illustrated. Finally, we have highlighted that i-PDMS is suitable to perform magnetophoretic functions for biological applications by showing the capture of magnetically labeled cells.
II. EXPERIMENTAL
A. Preparation of i-PDMS
Carbonyl iron microparticles (dry powder, 7 μm diameter, 97% Fe basis) (Sigma-Aldrich) and PDMS mixture (10/1 w/w of monomer and curing agent, respectively) (Sylgard from Samaro) were thoroughly mixed in a mortar (around 4 min) until obtaining an homogeneous material prior to polymer reticulation. Different carbonyl iron concentrations ranging from 50% to 83% w/w were tested. The homogeneity of the different composites prepared has been verified by SEM (Tescan SEMFEG Mira3) observations of slices of material.
B. Fabrication and preparation of the microsystem
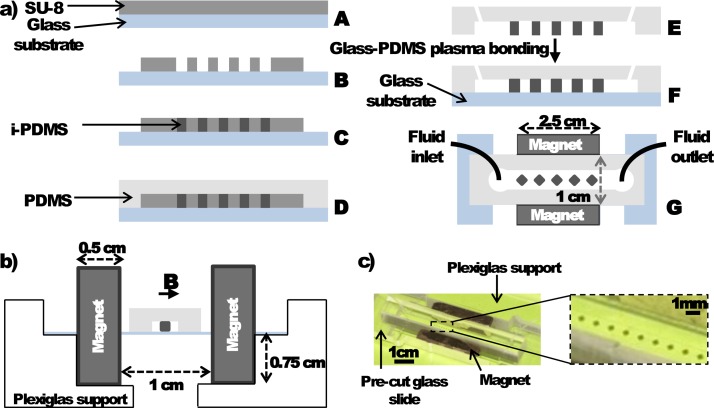
The different microfluidic structures were prepared using soft lithography approaches based on the replication of masters as reported elsewhere.41 For the integration of i-PDMS microstructures into PDMS channels, this replication was operated in two steps using first the composite and then conventional PDMS, as reported previously.35 The master was fabricated through standard photolithography method (Figure 1(a)). Briefly, SU8-2035 (Chimie Tech Service) was spin-coated on glass substrate in order to obtain 45 and 36 μm thick masters. Then, i-PDMS was first molded in the dedicated area of the system and after cleaning the eventual i-PDMS smears, the composite was baked in the same conditions as pure PDMS (75 °C for 60 min). Then, conventional PDMS was poured over the whole master and baked (75 °C for 60 min). Due to the good binding of i-PDMS and PDMS, when the PDMS slab was peeled off the master, i-PDMS microstructures remained bound to PDMS. After microscopic observations of the mold, we are confident that no i-PDMS microstructures were left on it. The inlets and outlets were then punched prior to sealing of the PDMS slab to a pre-cut glass substrate by O2-plasma activation (40 s, ).
FIG. 1.
(a) Fabrication process of microsystems integrating i-PDMS microstructures: (A) SU-8 spin-coating on a glass substrate, (B) SU-8 photolithography and development, (C) i-PDMS deposition and curing, (D) pouring of PDMS and curing, (E) Demolding of the system and punching of the inlets and outlets, (F) side view, and (G) top view of the final microsystem. (b) Schematic side view of the experimental setup presenting the optimized configuration of the permanent magnets regarding to the microsystem. (c) Picture of the microchannel mounted with the magnets. The close-up allows distinguishing the i-PDMS diamond-like microstructures.
C. Preparation of the magnetic microparticle suspension
Different magnetic species were tested in the microsystem. 12 μm in diameter superparamagnetic microparticles — consisting of magnetite in a polystyrene copolymerisate as organic matrix (density 1.2 g/cm3, χm = 8.44 × 10⁻³ corresponding to a magnetization of 0.56 emu/g for a magnetic field of 1000 Oe) — and 10 μm in diameter diamagnetic fluorescent microparticles, respectively, purchased from Kisker and Sigma-Aldrich. These particles were suspended at a concentration around 160 beads/μl in filtered Phosphate Buffered Saline (PBS) (Invitrogen) with 3.6% w/w dextran (Mw = 2 × 10⁶ Leuconostoc spp., from Sigma Life Science). Dextran was used to reduce the sedimentation of the particles during the time of the experiment.
D. Cell magnetic labeling
Human breast cancer cells (GFP MDA-MB-231) were labeled with a stable suspension of maghemite nanoparticles coated with negatively charged citrate molecules (magnetic diameter of 8.3 nm and hydrodynamic diameter of 35 nm) provided by C. Ménager (Laboratoire PESCA, UMR7195, Université Paris 6, France). Confluent cells were incubated for 2 h with a suspension of the negatively charged maghemite nanoparticles ([Fe] = 10 mM) in RPMI culture medium containing 5 mM of sodium citrate (free citrates are used as counterions to stabilize the nanoparticle suspension), followed by a chase period of 1 h in supplemented culture medium. Cells were then detached using trypsin, resuspended in supplemented culture medium to the desired concentration (∼6 × 10⁶ cells/ml), and injected in the microsystem.
E. Experimental setup
The microsystem was then placed on a custom-made Plexiglas support developed in order to secure the position of the two permanent magnets (Nd/Fe/Br 25 × 10 × 5 mm3 1,2 T at the pole, polarization in the longest dimension) used to generate the external magnetic field, regarding the microfluidic channel in the optimized configuration. The experimental setup is presented on Figures 1(b) and 1(c). The relative positions of magnets and microchannel were optimized by numerical simulations. Before introducing the magnetic species, the microsystem was passivated with filtered 2% Bovine Serum Albumin (BSA) (Sigma-Aldrich) in PBS to avoid any non-specific adsorption of the particles onto the microchannel walls. The microsystem was then rinsed with filtered PBS. A syringe pump (Harvard Apparatus) was used to inject the beads suspension in the microsystem. Videomicroscopy techniques involving an inverted epifluorescent microscope (Leica DMI4000B) and a camera (Leica DFC340 FX) allowed us to observe the behavior of superpara- and diamagnetic beads in the microsystem. Image J® was used to perform image analysis and to retrieve beads trajectories.
III. RESULTS AND DISCUSSION
A. i-PDMS characterization
We first evaluated the influence of doping ratio (50%, 75%, and 83% w/w) on the structurability and magnetic properties of i-PDMS. We found (INL and Institut Néel, unpublished results) that the magnetization M of i-PDMS composites, as a function of the magnetic field applied H, increases with the doping ratio as previously reported by Li et al.37 These curves were exploited in order to calculate the magnetic relative permittivity μr as a function of the doping ratio. Indeed, this parameter directly traduces the capacity of the material to generate magnetic field gradient. μr, was calculated using Equations (3) and (4),
| (3) |
| (4) |
where M is the resulting magnetization of the composite — converted into A/m, taking into account the density of the material (measured as described in the Appendix) — under the applied magnetic field H (also expressed in A/m) and χm is the magnetic susceptibility of the material.
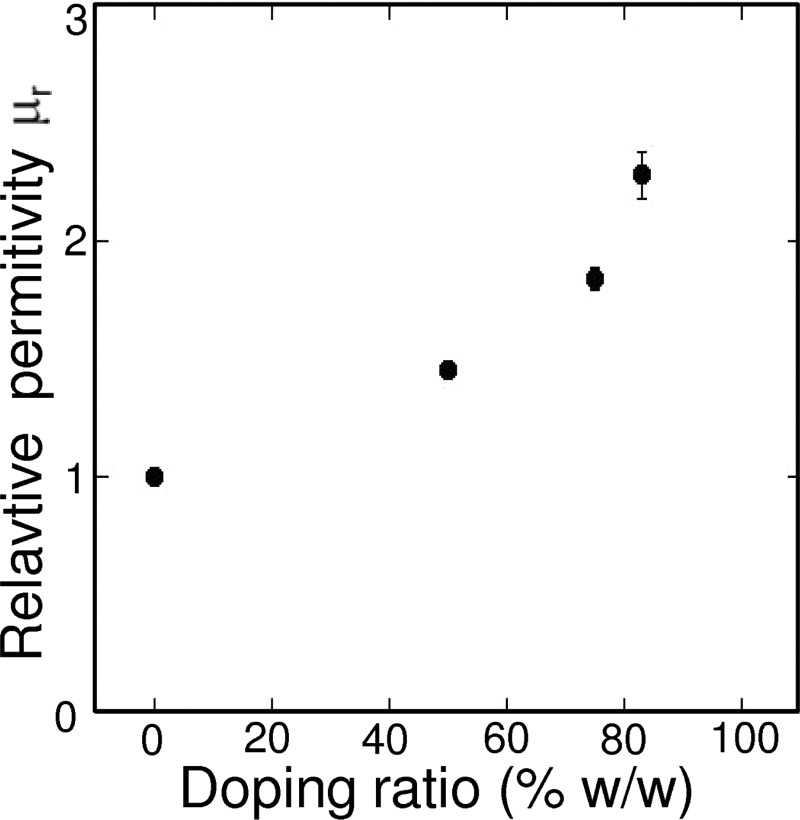
We report the evolution of the relative magnetic permittivity of the composite versus the doping concentration in Figure 2. The results show that μr increases with the carbonyl iron concentration. Indeed, μr increases from 1.45 to 2.28 when the doping ratio is increased from 50% to 83% w/w. This value is typically of the same order of magnitude than relative permitivity of other magnetic composites.28 The values of μr for i-PDMS are to be compared with a value of μr of 6.02, expected for 100% carbonyl iron powder (from the magnetization curve obtained on pure carbonyl iron particles and the associated density value given by the manufacturer). From our previous experience with other PDMS composites,35 we expect that further increasing the doping ratio would drastically increase the viscosity of i-PDMS and therefore reduce the ability of the material to be processed by replication techniques. Despite its low μr value, the i-PDMS is efficient for magnetic separation as demonstrated below. In the future, we plan to increase the μr by choosing other doping materials or by adding nanoparticles instead of microparticles.
FIG. 2.
Relative magnetic permittivity of the composite materials μr versus the doping ratio.
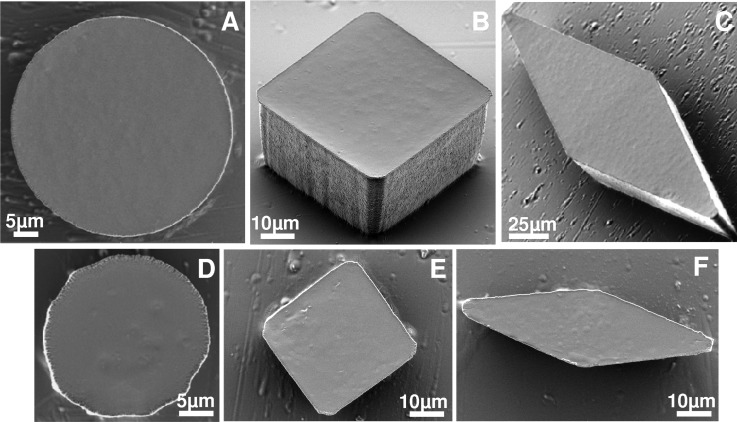
We studied the effect of doping ratio on structurability of the composite by replication approaches. Several geometric shapes (squares-, disks-, and diamonds-like shapes with various angles) were replicated using soft lithography techniques41 and resultant i-PDMS structures were characterized by SEM observations (see Figure 3). Satisfactory replication was observed for all doping ratio. In order to maximize the magnetic susceptibility while keeping replication capacity, we selected a doping ratio of 83% w/w, corresponding to a magnetic relative permittivity of 2.28. For this doping, we evaluated the minimal resolution that our replication approach could attain. We managed to obtain microstructures down to 50 μm (typical dimension of the geometric shape: side for squares, diameter for disks and smallest diagonal for diamonds) that exhibit fine shapes and good angle resolutions as illustrated in Figures 3(a)–3(c). Below this limit, the shapes were recognizable but the definition of the angles were not judged satisfactory and the edges were less smooth (Figures 3(d)–3(f)).
FIG. 3.
SEM images of various 83% w/w i-PDMS microstructures. From (a)–(c) characteristic dimension was 50 μm, whereas from (e)–(f) characteristic dimension was 25 μm.
B. Application to the generation of magnetic field gradient for HGMS
We aim at highlighting the ability of this composite material to be used to perform separation of magnetic species via trapping. Indeed, in order to trap a superparamagnetic particle flowing in the microfluidic system, the magnetic force has to overcome the drag force exerted by the surrounding fluid on the object, i.e., . As the magnetic susceptibility and the radius of the particle are intrinsic parameters of the species to isolate, the only way to maximize the magnetic force is either to reduce the magnetic susceptibility of the surrounding medium17 or to maximize . We chose here to implement microstructures of i-PDMS inside a fluidic microsystem to demonstrate the ability of this composite material to induce sufficiently high magnetic field gradients to perform separation of magnetic species via trapping. For that purpose, we considered a microfluidic channel with a respective width and height of 1 mm and 50 μm, containing 83% w/w i-PDMS microstructures. The magnetic field was produced by applying two permanent magnets facing each other, hence generating a magnetic field as uniform as possible, so that gradients can only be attributed to the presence of i-PDMS microstructures.
1. Configuration of the microsystem
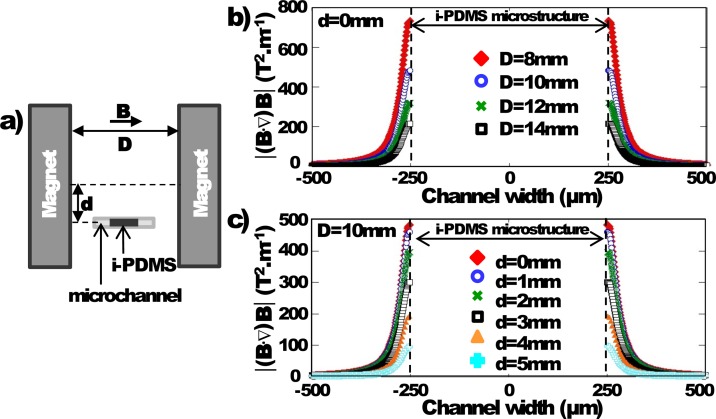
2D computer simulations were performed with ComSol Multiphysics 4.2a® in order to determine the optimum configuration of the microfluidic system to maximize generated by i-PDMS microstructures, under uniform magnetic field ( computed to be roughly 206.7 mT). We have evaluated the influence of (i) the position of the permanent magnets regarding the microfluidic channel — as defined in Figure 4(a), D, the distance between the two magnets and d, the vertical position of the channel regarding the middle of the magnets are investigated — and (ii) the shape of the i-PDMS microstructures to maximize the gradient generated.
FIG. 4.
(a) Schematic representation and definition of the different parameters: D is the distance between the two permanent magnets — the microchannel being in the middle — and d is the vertical shift of the channel position regarding half the magnets height. (b) Evolution of the term across the channel width as D is varied, for d = 0 mm. (c) Evolution of the term across the channel width as d is varied, for D = 10 mm.
First, the microchannel with a single 500 μm i-PDMS microstructure was centered between the two permanent magnets, as illustrated in Figure 4(a), for d = 0 mm and the effect of the distance D between the two magnets was investigated. The optimum position of the magnets is expected to generate a high term in order to maximize the associated magnetic force. We have first simulated a microchannel without i-PDMS structures and checked that the magnetic field generated by the two permanent magnets is nearly uniform and therefore considered constant (data not shown here) for d = 0. Then an i-PDMS microstructure is added to the system. As expected, increases as D is decreased (Figure 4(b)). However, for practical reasons, we choose to fix the inter-magnet distance at 10 mm. Indeed, the attraction force between the magnets is so important when they are too close that it becomes difficult to handle and position them on each side of the microfluidic device. Then, we studied the influence of the vertical alignment of the microchannel regarding the magnet height for D = 10 mm. is maximized in the channel for d = 0 as presented in Figure 4(c). Therefore, the optimum configuration of the setup is chosen to be the microchannel centered horizontally and vertically compared to the two magnets which are spaced 10 mm from each other.
We also studied the effect of the i-PDMS microstructure shape on the gradient of magnetic field generated. Various shapes such as 500 μm disks, squares, and diamonds (typical size is, respectively, diameter, side, and diagonal) were simulated at the center of the microchannel with the optimum configuration determined previously (D = 10 mm and d = 0 mm). The term generated by the microstructures was calculated for each shape using the relative permittivity μr of the 83% w/w i-PDMS determined previously from the magnetization curves and the measurement of the material density (see the Appendix).
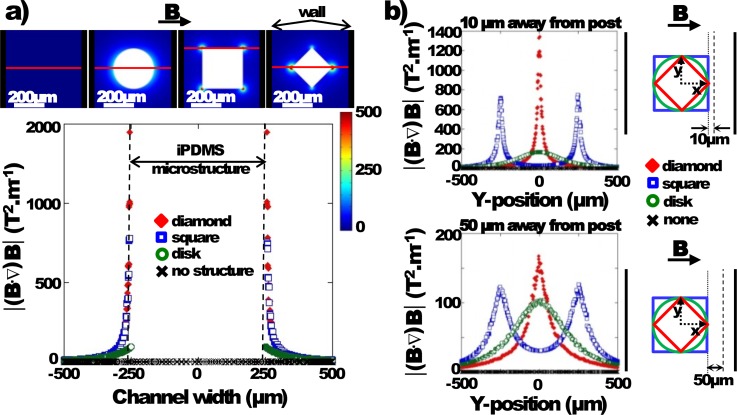
As presented in Figure 5(a), the results show that the diamond-like i-PDMS structure exhibits the highest magnetic field gradients at the tip. When looking at the vicinity of the microstructure, 10 μm away from the composite (see Figure 5(b)), it appears that the diamond-like shape generates values twice as high as the square-like one. is still higher for the diamond-like at 50 μm away from the structure. Therefore, for the rest of the study, the diamond-like microstructure has been selected to demonstrate the capability of i-PDMS to concentrate the magnetic streamlines in a microsystem.
FIG. 5.
(a) Evolution of along the red line on the surface representation (top images) as a function of the i-PDMS microstructure shape. (b) along the y-direction (top) 10 μm and (bottom) 50 μm away from the i-PDMS microstructure — as defined on the sketches on the right — according to the shape.
2. Characterization of magnetic trapping
The 1 mm wide microfluidic channel integrating a line of 20 diamond-like microstructures made of 83% w/w i-PDMS was prepared according to the protocol described in Sec. II. A syringe pump is used to apply the flow and inject the magnetic species to separate. The whole setup was placed under an inverted microscope in order to perform videomicroscopic recordings of the particles behavior as they flowed through the system.
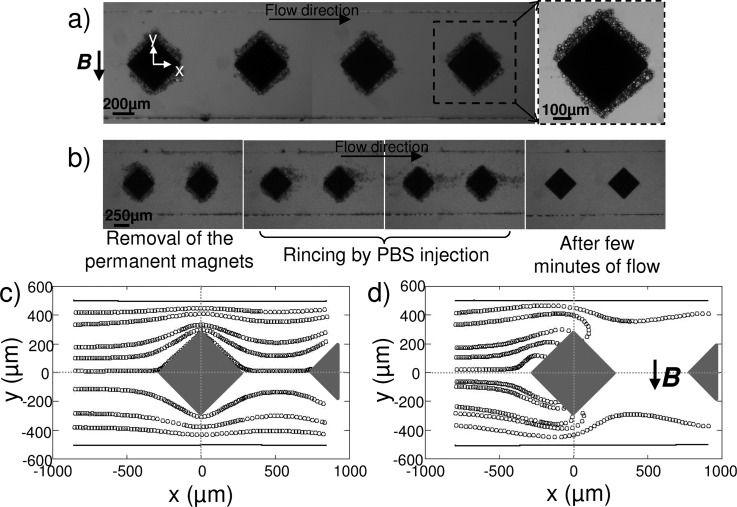
We first highlighted the actual distribution of magnetic field lines by injecting a suspension of 12 μm superparamagnetic microparticles (χm = 8.44 × 10⁻³) in PBS solution at 160 beads/μl and at a flow rate of 50 μl/h. As illustrated in Figure 6, the superparamagnetic microbeads were trapped around the composite microstructures highlighting the generation of gradients of magnetic field. Those results demonstrate the concentration of magnetic field lines around the i-PDMS hence generating gradients inducing a magnetic force on the superparamagnetic beads.
FIG. 6.
(a) Capture of superparamagnetic beads suspended in PBS, on several i-PDMS microstructures. The close-up allows distinguishing the amount of beads trapped on a single structure. (b) Emphasize of the reversibility of the capture: the beads can be detached and collected by rinsing after removal of the magnets. Trajectories — extracted from videomicroscopic observations — of superparamagnetic microparticles, suspended in 3.6% w/w dextran in PBS, flowing at 50 μl/h (c) in absence and (d) in presence of the permanent magnets. The flow is from left to right.
It can be noticed that the apparent geometry of the microstructure is modified during the experiment by the aggregation of superparamagnetic particles (Figure 6(a)). This can lead to a decrease of the capture efficiency of the system — due to (i) an increase in the distance between flowing beads and the region of high magnetic gradients and (ii) a slight decrease of the channel section inducing a rise of the drag force — up to the saturation where beads tend to roll on the trapped particles and get released in the circulation. In the rest of the manuscript, the measurements were performed with little coverage of the posts, to ensure to be independent of this change in geometry. One advantage of our composite material is the possibility to reverse the trapping and to release the particles from the structures. As a matter of fact, by removing the permanent magnets and applying a flow, the superparamagnetic particles were allowed to freely flow off the structure, as illustrated in Figure 6(b). This indicates no residual magnetization of our material after removal of the external magnetic field.
In order to study into details the performances of the trapping of magnetic species by i-PDMS structures, we focused on the behavior of superparamagnetic particles as they flowed at the vicinity of the first diamond structure. However, it was difficult to carry out characterization experiments as microparticles sedimentation occurred within 10 min in the syringe. To attenuate that effect, we suspended superparamagnetic particles in a solution of polymer (dextran at 3.6% w/w in PBS, i.e., η ∼ 10 mPa s) to increase the viscosity of the surrounding fluid, despite the fact that it increases the drag force by a factor 10 (see Equation (2)), and hence impacts the conditions where . This induces a reduction of the capture efficiency. However, we verified experimentally that in a suspension containing 3.6% w/w dextran in PBS, superparamagnetic particles flown through the microsystem at 50 μl/h were still captured on the i-PDMS microstructures in presence of the magnet (Figure 6(c)) whereas the trajectories were symmetrical in absence of the permanent magnets (Figure 6(d)). It was verified that in absence of the two permanent magnets, or when injecting diamagnetic microparticles, no trapping on the i-PDMS occurred. We also checked that in presence of the magnets but with pure PDMS microstructures within the channel, the particles were following the stream lines and showed no attraction towards neither the PDMS microstructures nor towards the channel walls, hence showing that any eventual gradient of magnetic field induced by the two permanent magnets is not strong enough to perturb beads trajectories and can therefore be neglected (see Figure 11 in the Appendix). In the rest of this paper, we will thus consider a situation unfavorable regarding the trapping. One should keep in mind that if working with magnetic species suspended in non-viscous media, the actual capture and deviation efficiencies would be higher than those reported here.
FIG. 11.

(a) Trajectories of superparamagnetic microparticles, suspended in 3.6% w/w dextran in PBS, flowing at 50 μl/h, at the vicinity of pure PDMS microstructures, in presence of the permanent magnets. The flow is from left to right. (b) Evolution of the deviation ΔY of the beads versus their position upstream of the microstructure Y0, for a pure PDMS microstructure with external magnetic field (solid squares) and for a i-PDMS microstructure without the permanent magnets (open circles). The beads are flowing at 50 μl/h. The curve is a guide for the eyes.
3. Effect of the flow rate on the magnetic trapping
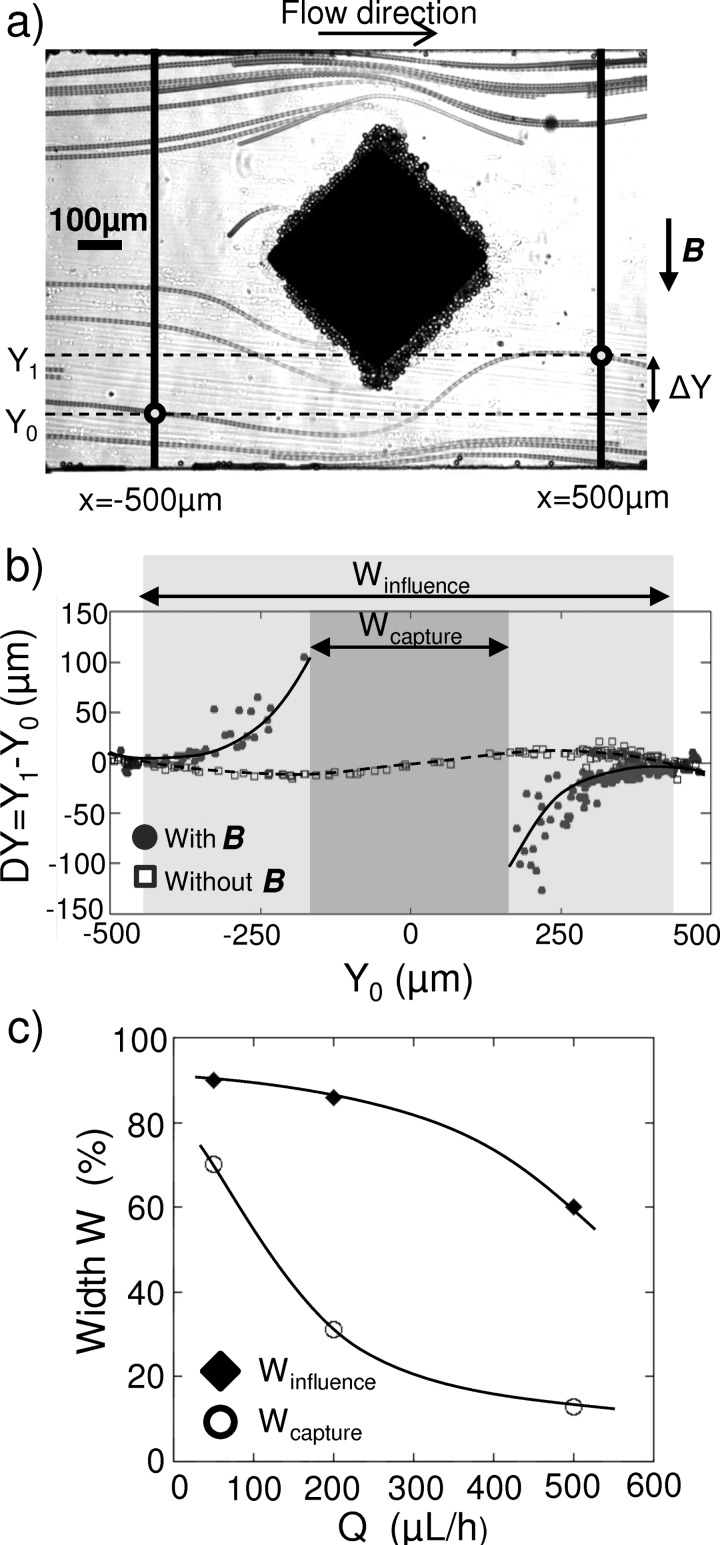
We then investigated the influence of the flow rate on the ability of the i-PDMS microstructures to trap superparamagnetic microbeads. Three different flow rates are studied: 50, 200, and 500 μl/h, which considering a 45 μm high and 1 mm wide microchannel, correspond to typical flow speed of 0.3, 1.2, and 3.1 mm/s, respectively, far from the structure. One may note that for a given flow rate, as particles flow past the i-PDMS microstructure and thus undergo a stronger magnetic force, they accelerate due to the reduction (from 1 mm to 500 μm) of the apparent width of the channel, therefore leading to the doubling of the drag force experienced by the cells. Videomicroscopic recordings of the particles behavior were performed at the vicinity of the first diamond-like shaped microstructure, hence allowing the extraction of several parameters such as bead positions and their velocities. Figure 7(a) reports a time lapse of videomicroscopic images: actual capture and deviation events can be observed on the i-PDMS post already covered with captured superparamagnetic beads. The deviation of the microbeads as they flow close to the i-PDMS structure is measured versus the applied flow, according to the methodology described in Figure 7(a). The positions Y1 and Y0 of the beads in the channel are measured, respectively, at x = −500 μm and x = +500 μm — position corresponding to the equidistance between the first and the second microstructure — from the center of the diamond-like shaped structure. Therefore, we performed the study of the deviation of the microbeads ΔY = Y1 − Y0 as a function of their position Y0 prior to the composite post.
FIG. 7.
(a) Z-stack projection of videomicroscopic images representing superparamagnetic particles flowing at the vicinity of an i-PDMS microstructure in presence of an external magnetic field. Y-positions of the beads are measured at two different locations 500 μm, respectively, upstream and downstream of the center of the structure, allowing calculating the deviation of the bead ΔY = Y1 − Y0. (b) Evolution of the deviation ΔY of the beads versus their position upstream of the microstructure, with and without external magnetic field. The beads are flowing at 200 μl/h. The curves are guide for the eyes. We defined Winfluence (light grey) and Wcapture (dark grey) as the portion of the channel width where the beads are deviated and captured, respectively. (c) Evolution of Winfluence and Wcapture as a function of the flow rate Q. The curves are guides for the eyes.
The results are presented in Figure 7(b), in presence and in absence of the two permanent magnets, for a typical flow rate of 200 μl/h. In absence of external magnetic field, the superparamagnetic microbeads follow the stream lines as verified with 1 μm fluorescent non-magnetic carboxylate microbeads. When a magnetic field is applied, the magnetic particles are affected by the gradient generated by the i-PDMS structures; hence allowing the observation of capture or strong deviation of the beads according to their initial position Y0 in the channel. However, superparamagnetic particles flowing close to channel walls tend to exhibit the same behavior in absence or in presence of magnetic field, hence traducing the fact that magnetic particles are not affected by the magnetic force when flowing far from the i-PDMS microstructure. This suggests that there is a critical distance above which the objects are not sensitive to the ability of the composite posts to concentrate magnetic streamlines. Below this critical distance, the behavior of particles starts to differ when in presence or in absence of the permanent magnets. These results are consistent with the results obtained via numerical simulations (see Figure 5(b)) showing that for a diamond-like i-PDMS microstructure, decreases roughly from a factor 7 (1300 to 175 T2 m−1), respectively, 10 and 50 μm away from the post. Indeed, for Y0 ranging from −325 to 325 μm, the superparamagnetic beads tend to get deviated towards the microstructure in presence of an external magnetic field. This zone where beads are affected by the gradients of magnetic field generated by the i-PDMS post is defined as the influence window (with a width Winfluence expressed as a percentage of the total channel width w). When looking at the behavior of particles flowing at the direct proximity of the structure (−150 μm < Y0 < 150 μm), we observed that they get trapped on the i-PDMS posts. This second area is defined as the capture window (with a width Wcapture expressed as a percentage of the total channel width w) associated with the structure.
In order to evaluate the capture efficiency of the system, one approach would be to count the number of particules captured by the i-PDMS post regarding the total number of particules flown in the device. However, despite the increase of the viscosity of the suspending fluid, the beads tend to sediment in the syringe during the experiment, leading to a non uniform distribution of the particles in the channel width. As the magnetic force undergone by the particles depends on their position regarding the i-PDMS structure, this phenomenon could impact any estimation of the capture efficiency; for example, if the beads tend to enter the channel close to the walls, the capture efficiency would be artificially low. The capture window Wcapture highlights the proportion of the channel width in which particles are captured on the i-PDMS microstructured. Therefore, assuming a uniform distribution of particles in the channel, the capture efficiency of our microsystem is directly traduced by the value of Wcapture.
By repeating these measurements for different flow rates, we studied the influence of the flow rate on the size of the influence and capture windows; the results are summarized on Figure 7(c). Capture and deviation are favored at low flow rate conditions since the capture and deviation windows represents, respectively, 70% and 90% of the channel width at 50 μl/h. When the flow rate is increased, we observed a reduction of both the capture and influence windows. Indeed, the drag force described by Equation (2) varies linearly with the speed contribution (). As () rises, the drag force increases hence diminishing the contribution of the magnetic force to the resultant total force exerted on the bead. As a consequence, at high flow rate less beads get trapped on the i-PDMS microstructure; however, they tend to be deviated towards the microstructure and thus towards the center of the channel. Typically, at 500 μl/h, the deviation window tends to completely prevail over the capture one. This focusing phenomenon can be exploited in a multi-structure configuration, as demonstrated in Sec. III B 4.
We would like to remind the reader that the results presented here are obtained in unfavorable conditions as the viscosity of the suspending medium has been increased (roughly 10 times higher than water viscosity) in order to attenuate the beads sedimentation in the syringe during the time of the experiment. Therefore, it is difficult to compare our results in terms of capture efficiency to those reported in the literature, as most of the published experiments have been performed in aqueous medium, with a viscosity comparable to that of water. However, we try to estimate the equivalent performances of our system in water-like medium. Considering the same magnetic conditions (meaning constant), we can reduce the viscosity of the surrounding medium by a factor of 10 — to reach that of water — while increasing the flow speed of the same amount without changing the drag force and thus the capture efficiency. As we report here 70% capture efficiency at 50 μl/h and for η = 10 × ηwater, we can assume that 70% capture efficiency would be achieved with our setup at 500 μl/h for η = 1 mPa s; such flow rate are comparable to those reported in the literature.34,42 In order to increase further the performances of our system, work should be done on the optimization of the size of the i-PDMS microstructures, as well as the arrangement of multiple structures.
4. Influence of multiple structures
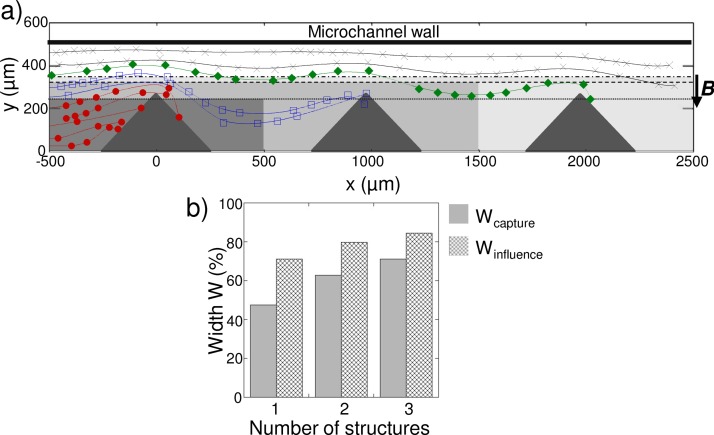
Indeed, the addition of several diamond-like i-PDMS microstructures along the channel (h = 36 μm) can be used to cumulate the effects of capture and deviation of superparamagnetic species (see Figure 8). A bead, flowing at 50 μl/h along the channel, initially outside of the capture window of the first i-PDMS microstructure (for example, the green solid diamond of Figure 8(a)) is deviated until it is captured on the third structure.
FIG. 8.
(a) Trajectories of superparamagnetic microbeads flowing at 50 μl/h along a line of i-PDMS structures implemented in a 36 μm high microfluidic system. (b) Evolution of Wcapture and Winfluence as a function of the number of i-PDMS structures considered. Q = 50 μL/h and h = 36 μm.
At each composite microstructure, the magnetic force deviates the bead until the cumulated effect results in the bead capture. When measured after one, two, and three i-PDMS microstructures, the capture and influence windows are increased. For example, the capture window increases from 47% for the first structure, to 71% after the third structure at 50 μl/h (as reported in Figure 8(b)). The trapping efficiency is thus enhanced with multiple structures at relatively low flow rate. In addition, considering the tendency of the particles to get deviated by one i-PDMS microstructure without being trapped on the post at higher flow rate (i.e., the influence window prevails), using multiple structures at high flow rate would lead to the focalization of beads towards the microsctructures, and therefore towards the center of the channel. Such approach would be suitable for continuous separation of magnetic species in flow.
5. Separation between two populations of beads of different magnetic properties
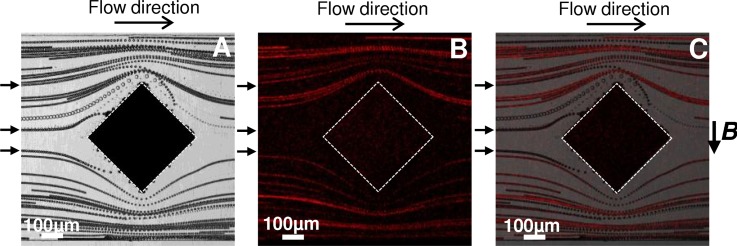
We also demonstrated the use of this material to perform HGMS of two populations of microparticles differing by their magnetic properties. A mixture of superpara- and fluorescently labeled diamagnetic particles, prepared with respective proportions of (1/4 superpara/dia), is injected in the microsystem at 50 μl/h. As illustrated on Figure 9, we were able to extract the superparamagnetic species using i-PDMS microstructures. As highlighted by the absence of fluorescent signal from the captured objects, the fluorescent diamagnetic particles flow freely past the i-PDMS structure, whereas the superparamagnetic beads are trapped on the composite, hence resulting in their isolation.
FIG. 9.
(a) Bright field and (b) fluorescence z-stack projection of videomicroscopic images representing a mixture of superparamagnetic and fluorescently labeled diamagnetic particles flowing at 50 μl/h in the channel. (c) Overlay of the two previous pictures. Only superparamagnetic beads (black arrows) are captured, as highlighted by the absence of fluorescent signal on the i-PDMS microstructure.
C. Application with biological species
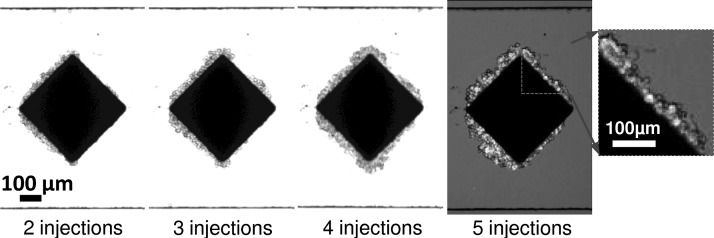
Finally, we demonstrate the potential of i-PDMS to perform magnetophoretic functions in microsystems for biological applications. GFP transfected MDA-MB-231 cells (human breast cancer cells) are magnetically labeled by incubation with maghemite nanoparticles (from PECSA Lab, largely used as magnetic labeling agent43) according to the protocol described in Sec. II. Then, the cells suspended in culture medium are injected in the microsystem thanks to a micropipette, in presence of the two permanent magnets, at a concentration of 6.5 × 10⁶ cells/ml. Several injections are performed and pictures of the i-PDMS microstructures are recorded after each injection. As illustrated on Figure 10, cells are captured on the composite material and accumulated according to the different injections.
FIG. 10.
Bright field images of magnetically labeled cells captured on a i-PDMS microstructure. The last image is an overlay of a bright field and a fluorescent images of the microstructure. The cells accumulate on the composite material, upon cell injections, in presence of the two permanent magnets. Injections induce flow from left to right.
The typical magnetic susceptibility acquired by the cells upon magnetic labelization has been estimated to χcells = 3.6 ± 1.6 × 10⁻³, which is equivalent to an average uptake of 2.3 ± 1, 1 pg of iron per cell (protocol detailed in the Appendix). One should notice that the typical magnetic susceptibility of the cells is of the same order of magnitude than the one of the superparamagnetic particles used previously in this study (factor 2.3).
IV. CONCLUSION
In this paper, we have demonstrated that i-PDMS, a carbonyl iron doped PDMS material is suitable for magnetophoretic functions in microsystem such as capture and separation of magnetic species. The composite material combines properties of both compounds and allows easy and fast integration of 3D metalic microstructures using soft lithography approach while preserving O2 plasma bounding properties of PDMS substrate and avoiding cumbersome alignment procedure. We have reported that an optimum doping ratio of 83% w/w of carbonyl iron in PDMS yields to a composite material with satisfactory relative magnetic susceptibility while keeping its ability to be structured by soft lithography techniques. We have then implemented 500 μm diamond-like shaped i-PDMS microstructures in a 1 mm wide microfluidic channel according to a configuration which have been optimized by numerical simulations. We have demonstrated the generation of magnetic field gradients, when i-PDMS structures are placed between two permanent magnets. The dynamical study of superparamagnetic particles flowing at the vicinity of such microstructures points out two types of behavior according to their initial position: either beads are captured or they are deviated towards the composite, i.e., the center of the channel. We have shown that by removing the permanent magnets, the magnetic particles can be released in the surrounding medium, hence taking advantage in doping PDMS with soft magnetic microparticles to capture in a reversible way the magnetic species. This can be a critical issue as capture, rinsing, and release steps of species of interest are often required for further analysis or detection. We have also confirmed that flow rate affects the capture efficiency as particles tend to be deviated instead of captured upon increase of the flow rate. Even if at high flow rate or high viscosity, the magnetic trapping is not favored on a single microstructure (the magnetic force cannot overcome the drag force), it is still possible to increase the trapping efficiency by using multiple structures, taking advantage of the magnetic deviation of the particles in the vicinity of each magnetic structures. Moreover, combining multiple structures and high flow rate injection should allow to focus the magnetic species at the center of the microchannel, favouring a continuous separation of the species of interest. Finally, through the separation of particles with different magnetic properties, we have demonstrated that i-PDMS hold promise for new potential applications in HGMS and magnetophoretic functions in microfluidic systems, in particular for biological and medical applications as illustrated here by the capture of magnetically labeled cancer cells. In order to increase further the performances of our system, work should be done on the optimization of the size of the i-PDMS microstructures, as well as the arrangement of multiple structures.
ACKNOWLEDGMENTS
All the experiments presented here have been performed on NanoLyon facilities. This work was supported by CNRS, ANR Oncoscreen, LabEx IMUST, and Région Rhône-Alpes. FST (Faculté des Sciences et des Technologies) and Collegium C2I@Lyon are acknowledged for their contribution to build bio/nano experimental facilities. The authors thank Institut Néel for i-PDMS magnetic characterization and fruitful discussions. They also thank Hichem Mertani (CRCL, UMR INSERM U1052 CNRS UMR5286, France) for providing the GFP breast cancer cells and C. Ménager (Laboratoire PESCA, UMR7195, Université Paris 6, France) for providing the maghemite nanoparticles. R.G. is thankful to DGA and CNRS for a Ph.D. fellowship.
APPENDIX: COMPLEMENTARY INFORMATION
1. Measurement of composite density
The density σs of the composite for various doping ratio was measured with a pycnometer, at room temperature and atmospheric pressure, using deionised water (σ = 1 g/cm3) as the reference material. For each carbonyl iron concentration, 80 μm thick i-PDMS pieces (3 mm by 3 mm) were prepared and their mass ms was measured. The composite was then introduced in the pycnometer pre-filled with deionised water, as well as a magnetic stirrer bar which is used to get rid of all the bubbles eventually trapped when introducing the sample in the water. The volume of water is adjusted in order to reach the close-fitting ground glass stopper. The pycnometer is first put on a magnetic stirrer to remove the biggest air bubbles (roughly 1 h), and then put in a sonic bath to remove the finest ones (2 h minimum is required). Finally, the mass m1 of the gauged pycnometer containing the deionised water, the stirrer bar and the i-PDMS sample, is measured. The same measurement is conducted without the sample and allows estimating m2, the mass of the pycnometer containing the deionised water and the stirrer bar. The density of the composite is determined by using the following equation:
| (A1) |
One may note that during the preparation of i-PDMS samples, microscopic bubbles may have been trapped in the composite which may lead to a slight underestimation of the materials density. The obtained density values of i-PDMS according to the doping ratio are presented in Table I.
TABLE I.
Table of i-PDMS density according to the carbonyl iron concentration.
Value for pure PDMS from the literature (Ref. 44).
Value for pure carbonyl iron microparticles given by manufacturer (see www.sigmaaldrich.com).
The density measurements are then used to convert the magnetization value M measured on the composites into the appropriate unit (A/m). Then, knowing the applied magnetic field H (in A/m), the magnetic susceptibility χm of the material is calculated from Equation (3). Finally, the magnetic relative permittivity μr is obtained from Equation (4).
2. Effect of the magnetic field gradient generated by the external magnets
We have verified that the presence of the two permanent magnets, located on each side of the microfluidic chamber implementing pure PDMS microstructures, does not induce any perturbations to the superparamagnetic particles behavior. We have recorded the trajectories of the beads flowing at 50 μl/h in a device where all the microstructures are made of pure PDMS, in presence of the permanent magnets. The trajectories are presented in Figure 11(a). These results analysed in regard with Figure 6(c) show no particular behavior of the superparamagnetic particles, i.e. they undergo no attraction towards neither the PDMS microstructures nor towards the channel walls. To confirm these results, we have measured the deviation of the microbeads as they flow close to the PDMS structure, according to the methodology described in Figure 7(a). Briefly, the positions Y1 and Y0 of the beads in the channel are measured, respectively, at x = −500 μm and x = +500 μm — position corresponding to the equidistance between the first and the second microstructure — from the center of the diamond-like shaped structure. The deviation of the microbeads ΔY = Y1 − Y0 is measured as a function of their position Y0 prior to the post. The deviation of the beads flowing at 50 μl/h in the neighborhood of a pure PMDS microstructure, in presence of the two permanent magnets are reported in Figure 11(b), as well as deviation of superparamagnetic particles flowing around i-PDMS posts, without the permanent magnets. In both cases, the beads follow the same streamlines, as highlighted by the two sets of data which collapse on the same curve. This highlights that any eventual gradient of magnetic field induced by the two permanent magnets is not strong enough to perturb beads trajectories and can therefore be neglected.
3. Quantification of iron uptake within cells for magnetic labeling
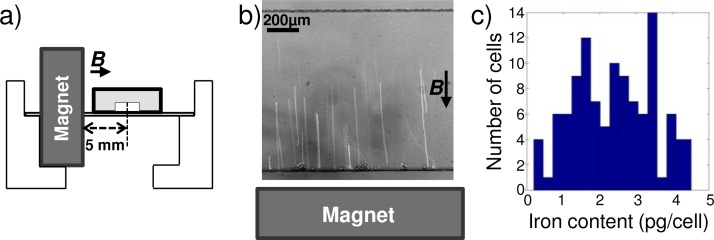
Immediately after labeling, a part of the magnetically labeled cells were used to quantify their iron content, using a magnetophoresis method.43 Briefly, we measure the velocity of labeled cells attracted towards one single Ne/Fe/Br permanent magnet placed 5 mm from a microchannel (width = 1000 μm and height = 100 μm, Figure 12(a)), knowing the magnetic field gradient (considered uniform over the field of view) generated by the magnet. The iron content of each visualized cell is calculated from the balance of magnetic and viscous forces, respectively, defined in Equations (1) and (2).
FIG. 12.
(a) Schematic representation of the setup. (b) Z-stack projection of videomicroscopic images representing superparamagnetic particles attracted towards the permanant magnet which is located 4.5 mm away from the lower wall. (c) Histogram of the measured iron content per cell.
The magnetic gradient along the y-direction was calibrated with the 12 μm superparamagnetic beads used previously. Beads were dispersed in a mixture of glycerol and water 71/29 w/w (viscosity η = 22.5 × 10⁻³ Pa s) and introduced in the microchannel. In absence of flow, their y-velocity was measured as they moved towards the magnet with constant velocity (see Figure 12(b)). The magnetic force was thus precisely counterbalanced by the viscous force: , showing that the magnetic force experienced by each bead was 6.1 ± 2.5 pN. According to Equation (1), this magnetic force was created by the magnetic gradient acting on the superparamagnetic beads. Measuring the drag force and knowing the size and magnetic susceptibility of the superparamagnetic beads, we could thus directly derive the magnetic field gradient along the y-axis in the field of view: , which is of the same order of magnitude as the value computed by numerical simulation in the same configuration ().
Knowing in the setup, the mean magnetic susceptibility (or equivalent iron content) for each labeled cell can be computed from y-velocity measurements, again from the balanced of magnetic and viscous forces. This measurement was repeated for 107 cells and they were found to be loaded with an iron content of 2.3 ± 1.1 pg/cells (see Figure 12(c)), corresponding to a magnetic susceptibility χm = 3.6 ± 1.6 × 10⁻³.
References
- 1.Kersaudy-Kerhoas M., Dhariwal R., Desmulliez M. P. Y., and Jouvet L., Microfluid. Nanofluid. 8, 105 (2010). 10.1007/s10404-009-0450-5 [DOI] [Google Scholar]
- 2.Toner M. and Irimia D., Annu. Rev. Biomed. Eng. 7, 77 (2005). 10.1146/annurev.bioeng.7.011205.135108 [DOI] [PMC free article] [PubMed] [Google Scholar]
- 3.Han K.-H. and Frazier A. B., Lab Chip 8, 1079 (2008). 10.1039/b802321b [DOI] [PubMed] [Google Scholar]
- 4.Gascoyne P., Mahidol C., Ruchirawat M., Satayavivad J., Watcharasit P., and Becker F. F., Lab Chip 2, 70 (2002). 10.1039/b110990c [DOI] [PMC free article] [PubMed] [Google Scholar]
- 5.Nilsson A., Petersson F., Jönsson H., and Laurell T., Lab Chip 4, 131 (2004). 10.1039/b313493h [DOI] [PubMed] [Google Scholar]
- 6.Petersson F., Nilsson A., Jönsson H., and Laurell T., Anal. Chem. 77, 1216 (2005). 10.1021/ac048394q [DOI] [PubMed] [Google Scholar]
- 7.Murata M., Okamoto Y., Park Y.-S., Kaji N., Tokeshi M., and Baba Y., Anal. Bioanal. Chem. 394, 277 (2009) 10.1007/s00216-009-2648-5 [DOI] [PubMed] [Google Scholar]
- 8.MacDonald M., Spalding G., and Dholakia K., Nature 426, 421 (2003). 10.1038/nature02144 [DOI] [PubMed] [Google Scholar]
- 9.Tan S. J., Yobas L., Lee Y. G., Ong C. N., and Lim T. C., Biomed. Microdevices 11, 883 (2009). 10.1007/s10544-009-9305-9 [DOI] [PubMed] [Google Scholar]
- 10.Vandelinder V. and Groisman A., Anal. Chem. 79, 2023 (2007). 10.1021/ac061659b [DOI] [PubMed] [Google Scholar]
- 11.Pamme N., Lab Chip 6, 24 (2006). 10.1039/b513005k [DOI] [PubMed] [Google Scholar]
- 12.Pamme N., Eijkel J. C., and Manz A., J. Magn. Magn. Mater. 307, 237 (2006). 10.1016/j.jmmm.2006.04.008 [DOI] [Google Scholar]
- 13.Pamme N., Curr. Opin. Chem. Biol. 16, 436 (2012). 10.1016/j.cbpa.2012.05.181 [DOI] [PubMed] [Google Scholar]
- 14.Han K.-H. and Frazier A. Bruno, J. Appl. Phys. 96, 5797 (2004). 10.1063/1.1803628 [DOI] [Google Scholar]
- 15.Han K.-H. and Frazier A. B., Lab Chip 6, 265 (2006). 10.1039/b514539b [DOI] [PubMed] [Google Scholar]
- 16.Jung Y., Choi Y., Han K.-H., and Frazier A. B., Biomed. Microdevices 12, 637 (2010). 10.1007/s10544-010-9416-3 [DOI] [PubMed] [Google Scholar]
- 17.Shen F., Hwang H., Hahn Y. K., and Park J.-K., Anal. Chem. 84, 3075 (2012). 10.1021/ac201505j [DOI] [PubMed] [Google Scholar]
- 18.Oberteuffer J. A., IEEE Trans. Magn. 9, 303 (1973). 10.1109/TMAG.1973.1067673 [DOI] [Google Scholar]
- 19.Melville D., Paul F., and Roath S., IEEE Trans. Magn. 11, 1701 (1975). 10.1109/TMAG.1975.1058970 [DOI] [Google Scholar]
- 20.Wu C.-H., Huang Y.-Y., Chen P., Hoshino K., Liu H., Frenkel E. P., Zhang J. X. J., and Sokolov K. V., ACS Nano 7, 8816 (2013). 10.1021/nn403281e [DOI] [PMC free article] [PubMed] [Google Scholar]
- 21.Darabi J. and Guo C., Biomicrofluidics 7, 054106 (2013). 10.1063/1.4821628 [DOI] [PMC free article] [PubMed] [Google Scholar]
- 22.Chung J., Issadore D., Ullal A., Lee K., Weissleder R., and Lee H., Biomicrofluidics 7, 054107 (2013). 10.1063/1.4821923 [DOI] [PMC free article] [PubMed] [Google Scholar]
- 23.Glynn M. T., Kinahan D. J., and Ducree J., Lab Chip 14, 2844 (2014). 10.1039/c4lc00264d [DOI] [PubMed] [Google Scholar]
- 24.Liu X., Wang X., Wu X., Zhang Z., and Zhang Y., Microsyst. Technol. 20, 1337 (2014). 10.1007/s00542-013-1897-6 [DOI] [Google Scholar]
- 25.Wang J., Morabito K., Tang J. X., and Tripathi A., Biomicrofluidics 7, 044107 (2013). 10.1063/1.4816943 [DOI] [PMC free article] [PubMed] [Google Scholar]
- 26.Plouffe B. D., Lewis L. H., and Murthy S. K., Biomicrofluidics 5, 013413 (2011). 10.1063/1.3553239 [DOI] [PMC free article] [PubMed] [Google Scholar]
- 27.Owen C. S., Biophys. J. 22, 171 (1978). 10.1016/S0006-3495(78)85482-4 [DOI] [PMC free article] [PubMed] [Google Scholar]
- 28.Abonnenc M., Gassner A.-L., Morandini J., Josserand J., and Girault H. H., Anal. Bioanal. Chem. 395, 747 (2009). 10.1007/s00216-009-3006-3 [DOI] [PubMed] [Google Scholar]
- 29.Zanini L. F., Dempsey N. M., Givord D., Reyne G., and Dumas-Bouchiat F., Appl. Phys. Lett. 99, 232504 (2011). 10.1063/1.3664092 [DOI] [Google Scholar]
- 30.Pivetal J., Toru S., Frenea-Robin M., Haddour N., Cecillon S., Dempsey N. M., Dumas-Bouchiat F., and Simonet P., Sens. Actuators, B 195, 581 (2014). 10.1016/j.snb.2014.01.004 [DOI] [Google Scholar]
- 31.Paul F., Melville D., and Roath S., IEEE Trans. Magn. 18, 792 (1982). 10.1109/TMAG.1982.1061823 [DOI] [Google Scholar]
- 32.Jung J. and Han K.-H., Appl. Phys. Lett. 93, 223902 (2008). 10.1063/1.3036898 [DOI] [Google Scholar]
- 33.Xia N., Hunt T. P., Mayers B. T., Alsberg E., Whitesides G. M., Westervelt R. M., and Ingber D. E., Biomed. Microdevices 8, 299 (2006). 10.1007/s10544-006-0033-0 [DOI] [PubMed] [Google Scholar]
- 34.Yu X., Feng X., Hu J., Zhang Z.-L., and Pang D.-W., Langmuir 27, 5147 (2011). 10.1021/la104400m [DOI] [PubMed] [Google Scholar]
- 35.Deman A.-L., Brun M., Quatresous M., Chateaux J.-F., Frenea-Robin M., Haddour N., Semet V., and Ferrigno R., J. Micromech. Microeng. 21, 095013 (2011). 10.1088/0960-1317/21/9/095013 [DOI] [Google Scholar]
- 36.Issadore D., Shao H., Chung J., Newton A., Pittet M., Weissleder R., and Lee H., Lab Chip 11, 147 (2011). 10.1039/c0lc00149j [DOI] [PMC free article] [PubMed] [Google Scholar]
- 37.Li J., Zhang M., Wang L., Li W., Sheng P., and Wen W., Microfluid. Nanofluid. 10, 919 (2011). 10.1007/s10404-010-0712-2 [DOI] [Google Scholar]
- 38.Pirmoradi F. N., Jackson J. K., Burt H. M., and Chiao M., Lab Chip 11, 3072 (2011). 10.1039/c1lc20438f [DOI] [PubMed] [Google Scholar]
- 39.Nagel J. J., Mikhail G., Noh H., and Koo J., Proc. SPIE 6172, 1–9 (2006). [Google Scholar]
- 40.Jaffer S., Gray B. L., Sahota D. G., and Sjoerdsma M. H., Proc. SPIE 6886, 68860Q (2008). 10.1117/12.764068 [DOI] [Google Scholar]
- 41.Duffy D. C., McDonald J. C., Schueller O. J., and Whitesides G. M., Anal. Chem. 70, 4974 (1998). 10.1021/ac980656z [DOI] [PubMed] [Google Scholar]
- 42.Furdui V. I. and Harrison D. J., Lab Chip 4, 614 (2004). 10.1039/b409366f [DOI] [PubMed] [Google Scholar]
- 43.Wilhelm C., Gazeau F., and Bacri J.-C., Eur. Biophys. J. 31, 118 (2002). 10.1007/s00249-001-0200-4 [DOI] [PubMed] [Google Scholar]
- 44.Mark J. E., Polymer Data Handbook ( Oxford University Press, New York, USA, 1999), p. 1274 [Google Scholar]


