

Abstract
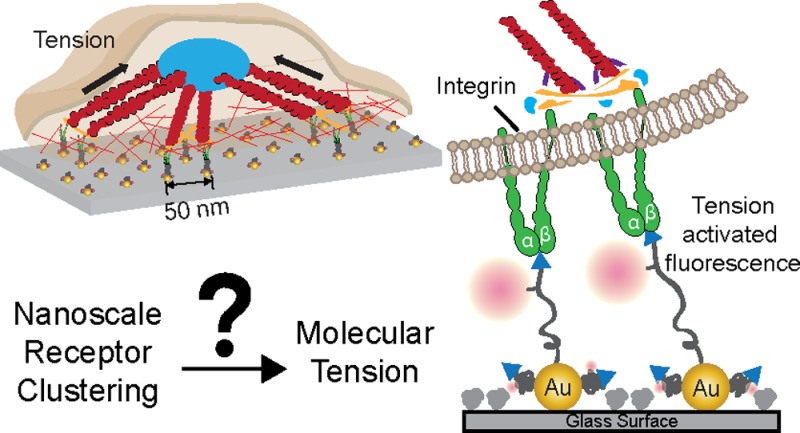
Herein we aimed to understand how nanoscale clustering of RGD ligands alters the mechano-regulation of their integrin receptors. We combined molecular tension fluorescence microscopy with block copolymer micelle nanolithography to fabricate substrates with arrays of precisely spaced probes that can generate a 10-fold fluorescence response to pN-forces. We found that the mechanism of sensing ligand spacing is force-mediated. This strategy is broadly applicable to investigating receptor clustering and its role in mechanotransduction pathways.
Keywords: Nanopatterning, receptor clustering, molecular tension fluorescence microscopy, focal adhesion, mechanotransduction, integrin
Because cell membrane receptors reside at the interface between a cell and its external surroundings, these molecules have evolved to sense and transduce both chemical and physical cues with high fidelity. One common mechanism to trigger or modulate surface receptor activation involves ligand-induced clustering, which in turn contributes to a robust biochemical response. For example, T-cell receptors,1,2 Fc-ε receptors,3 EphA2 receptor tyrosine kinases,4 Notch receptors,5 and epidermal growth factor receptors (EGFR)6 oligomerize at the plasma membrane upon activation. Intriguingly, the majority of oligomerized ligand–receptor complexes subsequently couple with the cytoskeleton and are actively transported by retrograde flow.4,7,8 Many of these assemblies experience resistance during active transport through the plasma membrane, resulting in mechanical tension that is likely to modulate signaling outcome. Accordingly, the coupling between receptor clustering, mechanical tension, and signal transduction at the plasma membrane is receiving increased interest.9−13 However, one of the greatest challenges in this area pertains to the lack of methods that can control clustering while also reporting on molecular tension during the signaling activity of live cells. In this paper, we report the development and application of an approach to address this need, thus showing the ability to simultaneously control receptor clustering with nanometer precision while also recording receptor mechanical forces with pN force resolution.
Integrins are α-, β- heterodimeric cell surface receptors that span the plasma membrane and recognize specific ligand molecules within the extracellular matrix (ECM).14 At the sites of activated integrin receptors, hundreds of different structural and adapter proteins will assemble into a three-dimensional cross-linked structure that spans many microns in length and is described as the focal adhesion (FA).15 Importantly, FAs regulate many cellular processes such as migration, differentiation, and proliferation.16 By providing a physical linkage bridging the FA and the ECM, integrins experience mechanical forces that are exerted by the cell and countered by the ECM.17 These forces play critical roles in integrin function and activation, allowing cells to recognize and respond to specific physical features of their microenvironment.18,19 Another essential parameter that modulates integrin activation is ligand spacing, where it has been shown that the interligand spacing needs to be at least 60–70 nm in order for FA maturation to proceed.20−22 Therefore, it seems intuitive to conclude that there is an intimate connection between integrin receptor clustering and force transmission23 but the details remain obscure.
To visualize the forces exerted by cell surface receptors, we recently developed molecular tension fluorescence microscopy (MTFM), which generates pN-range force maps with high spatial and temporal resolution.24 The probe in MTFM is comprised of a flexible linker molecule flanked by a donor fluorophore and ligand at one terminus and a quencher or a second fluorophore at the other terminus. The MTFM probe is typically immobilized onto a surface, such that the flexible linker is in a collapsed resting state, where the donor fluorophore is highly quenched. Upon the application of mechanical tension, the linker is extended, thus separating the fluorophore from the quencher and increasing the fluorescence intensity by 10–20-fold. Recently, we developed integrin-specific MTFM probes by conjugating a fluorescent cyclized Arg-Gly-Asp-dPhe-Lys (c(RGDfK)) peptide at one terminus of a polyethylene glycol (PEG)-linker and using a thiol at the other terminus to immobilize this probe onto a 15 nm gold nanoparticle (AuNP).25 The AuNP provides a physical scaffold to anchor the probe and also efficiently quenches fluorescence when the PEG is in a relaxed conformation. To our surprise, we also found that integrin-specific MTFM probes immobilized through biotin–streptavidin are ruptured due to integrin-mediated forces that dissociate the biotin–streptavidin complex.26 Therefore, the use of thiol-gold binding minimizes the possibility of force-induced dissociation of these probes. To the best of our knowledge, MTFM24 and its recent variants25−100 provide the only known method to visualize the pN forces exerted by cell surface receptors.
To test the relationship between integrin tension and ligand spacing, it is necessary to nanopattern MTFM probes. In principle, this could be achieved using a number of methods ranging from microcontact printing28 to dip-pen nanolithography29 and e-beam lithography.30 However, few approaches are amenable to rapid prototyping, soft matter patterning, high-end fluorescence microscopy compatibility, as well as sub-10 nm resolution registry over cm2 areas.31,101 Fulfilling these requirements is needed to control integrin spacing at the relevant nanometer length scales, while also providing the throughput necessary to study the inherent heterogeneity of cells and to permit simultaneous biochemical analysis.
Addressing this need, Spatz and colleagues have developed elegant methods to nanopattern RGD ligands.32 This approach, named block copolymer micellar nanolithography (BCMN), generates arrays of immobilized AuNPs with tunable spacings that range from ∼30 nm up to ∼300 nm across the entire substrate (cm-scales). RGD-decorated AuNPs confine the integrin receptors to minimum distances defined by the interparticle spacing. Herein, we combine MTFM with BCMN (Scheme 1) to provide evidence showing that the mechanism of ligand density sensing is force-mediated; only sufficiently spaced ligands (<60–70 nm) allow for the transmission of myosin-generated tension to individual integrin receptors.
Scheme 1. Combining Block Copolymer Micellar Nanolithography (BCMN) with AuNP-Based Molecular Fluorescence Tension Microscopy (AuNP-Based MTFM) for Investigating the Role of Ligand Density in Modulating Integrin Tension.

(a) Illustration showing the procedure used to generate BCMN patterned MTFM tension probes. (b,c) Schematic showing the expected mechanism of how cell-generated forces activate the tension probe. (d) Chemical structure of the MTFM tension probe ligand that was synthesized (see, Supporting Information) and used in this work.
Given that the 50 and 100 nm interparticle spacings are known to promote and destabilize FA formation, respectively, we tuned the dip-coating speed in BCMN to generate substrates with these AuNP spacings.20 The hexagonal arrangement of the AuNP pattern as well as the interparticle distances and heights were evaluated by atomic force microscopy (AFM) (Figure 1a, b) and scanning electron microscopy (SEM) (Figure S1, Supporting Information). On the basis of this analysis, the AuNPs height was 8.4 ± 1.0 nm (Figure S2, Supporting Information), and the spacing on the two types of substrates was determined to be 99 ± 12 nm and 49 ± 9 nm.
Figure 1.
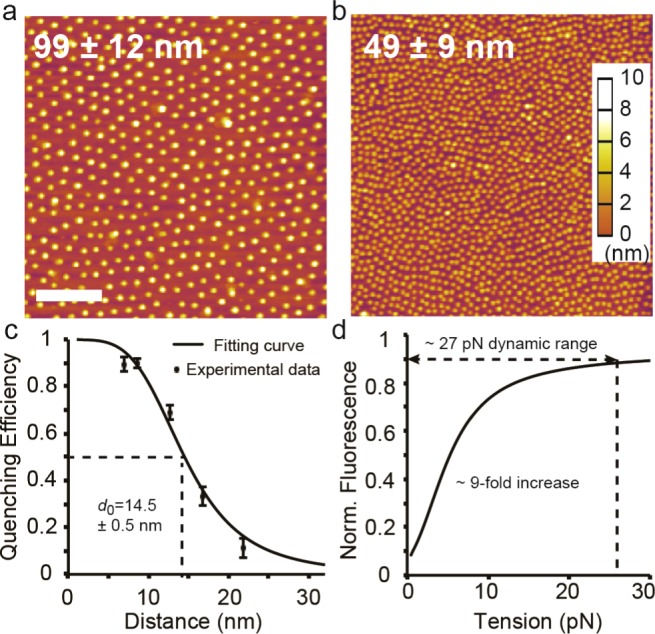
(a,b) Representative AFM topography images of BCMN-patterned 9 nm AuNP arrays with a mean spacing of 99 nm ± 12 nm and 49 nm ± 9 nm. Scale bar, 500 nm. (c) NSET calibration plot showing quenching efficiency of Cy3B fluorophore as a function of distance from AuNP surface as set by a range of DNA duplexes (Table S1, Supporting Information). The data was fit to the R4 NSET model and d0 (50% quenching distance) was determined to be 14.5 ± 0.5 nm. (d) Theoretical plot showing the change in fluorescence as a function of applied tension based on combining the WLC and NSET models. The dynamic range of the probe corresponds to quenching efficiency values ranging from 90 to 10%.
Although it is known that AuNPs with greater diameters are more efficient at quenching fluorescence,33 we avoided larger AuNPs because of the potential for multiple integrin binding to each particle. On the basis of structural data and previous literature reports, we selected 9 nm AuNPs because this is the most efficient quenching AuNP that would still ensure a maximum of one integrin engaged to each particle.32 Accordingly, we measured the nanometal surface energy transfer (NSET) radius between a 9 nm AuNP and Cy3B dye and found this to be 14.5 ± 0.5 nm by using highly packed duplex DNA as a molecular ruler (Figure 1c, Table S1 and Figure S3, Supporting Information). This NSET radius is in agreement with a value of 14.7 nm that was reported for 8 nm AuNPs and Cy3B dye.33 Note that the Cy3B dye was used in this work to leave the enhanced green fluorescent protein (eGFP) fluorescence channel available for genetically encoding markers of FAs. On the basis of this NSET radius and the predicted wormlike chain (WLC) model of PEG80,34 we would expect a force dynamic range that saturates at 27 pN, assuming the ability to detect quenching efficiency values from 90 to 10% (Figure 1d).
To prevent nonspecific protein adsorption and cell binding, the plasma-treated AuNP array substrate was passivated using a 0.1 mg/mL solution of poly(l-lysine)-graft-poly(ethylene glycol) (PLL-g-PEG)(PLL(20 kDa)-g[3.5]-PEG(2 kDa)) in 0.1 M HEPES buffer for 1 h. Subsequently, unbound PLL-g-PEG was removed by rigorously rinsing with DI water. We found that this protocol minimized the nonspecific interaction of NIH/3T3 fibroblasts to substrate (Figure S4, Supporting Information).
The final step of substrate fabrication involves modifying AuNPs with the molecular tension ligand. To maintain the collapsed mushroom conformation of the tension ligand, it was necessary to functionalize the AuNP with low densities of the fluorescent probe. It was also important to block the remaining AuNP surface, thus minimizing potential nonspecific protein interactions. Accordingly, the AuNP was modified with a binary mixture of the tension ligand and the short thiolated PEG, SH(CH2)2(OCH2CH2)8COOH. The synthesis of the SH-PEG80-c(RGDfK)-Cy3B molecular tension ligand was adapted from our previous work (Figures S5 and S6, Supporting Information). Briefly, a terminal cysteine residue that presents an amine and thiol was incorporated in the c(RGDfK) peptide. The amine group was initially modified with an NHS-azide with high yield (>90%). In the following two steps, the maleimide-Cy3B dye and alkyne-terminated polyethylene glycol (Alkyne-PEG80-SH, MW 3400) were further coupled to the thiol and azide groups, respectively. After HPLC purification, thiolated MTFM ligands were allowed to self-assemble onto the surface of the AuNP. By varying the concentration of tension ligands from 400 to 20 nM, while maintaining a constant thiol concentration of 40 μM using SH(CH2)2(OCH2CH2)8COOH, we tuned the density of tension probe ligands per AuNP. By empirically testing the cell adhesion onto these different substrates, we found that the 200 nM ligand concentration was the minimum concentration sufficient for allowing significant cell adhesion and spreading (Figure S4, Supporting Information). Given that lower ligand densities are desirable for minimizing background signal, we selected this concentration for subsequent cell studies.
To quantify the number of molecular tension ligands per AuNP we performed a quantitative fluorescence calibration and found that particles incubated with a 200 nM concentration of tension probe (39.8 μM SH(CH2)2(OCH2CH2)8COOH) had an average of 5.1 ± 0.5 probes per AuNP (Figure S7, Supporting Information). Because of the significant excess of the thiol ligand compared to the concentration of AuNPs, this average number is valid for both 50 and 100 nm spaced substrates. When these particles are immobilized onto the glass coverslip, only part of the Au surface is available for sensor modification due primarily to the steric blocking of the surface bound PLL-g-PEG brush. The estimated thickness of the PLL-g-PEG layer in the hydrated state is approximately 4–6 nm,35 which is comparable to the size of AuNP radius. Therefore, we assumed that at most only half of the AuNP surface area was available for binding tension sensors, thus allowing a maximum average number of 2.5 probes per particle. This number strongly suggests that each AuNPs was loaded with a low density of the tension probe, thus ensuring that the PEG was in the collapsed mushroom conformation at resting.36
Toward investigating the relationship between force transmission and FA formation, we next demonstrated the compatibility of MTFM with genetically encoded tagging of FA markers. NIH/3T3 fibroblast cells were transiently transfected with β3-integrin, paxillin, zyxin, and LifeAct and then cultured onto substrates modified with randomly arranged 9 nm diameter AuNP tension sensors for ∼1–2 h and subsequently imaged using total-internal reflection fluorescence microscopy (TIRFM) (Figure 2a). The density of disordered AuNP sensors on these substrates is ∼100 nm, which is sufficiently broad to allow FA maturation and force transmission.22 In all cases, we found strong integrin tension colocalization with the early markers of FAs such as β3-integrin, and paxillin. In contrast, the zyxin and LifeAct signals were distributed across the entire cell but preferentially localized to the actin bundles, which is in agreement with previous reports.37 The integrin tension signal was mainly detected at the cell perimeter, coinciding with the greatest zyxin and LifeAct intensities at the tips of the actin bundles. In some cases, the signal observed at the center of the cell was due to autofluorescence from the nucleus. However, in other cases the signal was due to focal adhesion generated forces. The distinction between the two types of signal is clearer upon examination of the β3-integrin-GFP channel.
Figure 2.

Analysis of FA proteins and integrin tension colocalization. (a) Representative TIRFM-488 (GFP channel, green) and Cy3B epifluorescence (integrin-tension channel, red) images of NIH/3T3 fibroblast cells cultured on randomly arranged AuNP sensor substrates for 1–2 h. The cells were transiently transfected to express GFP β3-integrin, paxillin, zyxin, and LifeAct, and this signal was found to colocalize with the integrin tension signal. (b–e) Representative zoom-in images showing the distribution of GFP-tagged β3-integrin, paxillin, zyxin, and LifeAct with the integrin–tension signal. The integrin–tension signal was quantified and found to highly colocalize with FA markers (see line scan analysis). Tension values were dynamic (see below) and varied across subcellular regions reaching maxima that ranged from ∼10–20 pN. Note that the reported tension values represent the average tension per ligand, thus likely underestimating the forces applied by integrins.
Upon analysis of subcellular regions (Figure 2b–e), we found that the maximum integrin tension within each FA typically appeared near the center of the rod-shaped elongated structure. Note that in these zoom-in images we observed that the peak position of tension can be offset from the peak position of the focal adhesion, either proximal or distal, by submicron distances, or in some cases it may perfectly overlap with the peak position of the focal adhesion marker, thus demonstrating the dynamic tension fluctuations during FA formation.38 By quantifying the quenching efficiency of the tension ligands at resting and employing the ligand density of 2.5 per AuNP, we were also able to estimate the average force per ligand, which ranged from 1 to 20 pN (Figure S8, Supporting Information), which is consist with the observation of integrin force mediated biotin–streptavidin dissociation.26 Note that this value is significantly greater than that reported by Dunn and colleagues (1–5 pN) and may be due to the limited dynamic range of their spider-silk based probes or the nature of the linear RGD peptide used in their studies.27
We next investigated the relationship between integrin clustering and tension by culturing GFP-paxillin transfected cells onto MTFM-patterned substrates with 50 and 100 nm spacing. The cells were continuously monitored using TIRFM (GFP-paxillin) and epi-fluorescence microscopy (integrin tension) for over 5 h. Representative cell images are shown in Figure 3a, and the data indicated that the footprint of the cells cultured on the 100 nm spacing remained small (300–1000 μm2) in contrast to cells grown on the substrate with 50 nm spacing (2000–5000 μm2). The difference in cell spreading was observed at the earliest time points (∼30 min) and became more pronounced at all later time points (Figure 3a). Although cells start spreading almost immediately upon plating on the 50 nm spaced AuNP arrays, only a few cells spread onto the 100 nm spaced substrate before the 30 min time point, which is in agreement with literature.20 Surprisingly, both the average FA size (as measured by GFP-paxillin, Figure 3b) and the average tension per ligand (Figure 3c) were similar for the cells cultured on both substrate spacings at the early time point of 30 min (each data point represents n = 10 cells). At later time points, FA area and the average tension per ligand diverged; cells on the 50 nm spacing formed significantly larger FAs with greater values of tension (Figure 3b,c, Figure S9, Supporting Information). It is notable that for the substrate of 50 nm spacing, the average size of FAs continues to grow over the time course of the experiment (from nascent focal adhesion to mature and elongated focal adhesion). However, the average tension per integrin ligand only rises to a threshold level that is maintained across the 5 h experiment. To verify this observation, we added 30 μM oleoyl-l-α-lysophosphatidic acid (LPA), a stimulant of myosin-contractility, to cells that have been cultured for 5.5 h in serum supplemented media (Figure S10, Supporting Information). Statistical analysis showed no significant increase in mean tension per integrin or total traction per cells. In contrast, addition of LPA to serum-starved fibroblasts led to a significant increase in tension and FA area, recovering to levels similar to that of cells cultured in serum-supplemented conditions. This data clearly indicates that although the total tension generated by the cell is growing, the tension per integrin ligand is maintained at a constant value; thus, individual integrin tension does not increase continuously during FA maturation and cell spreading. Our finding has two implications. First, it suggests that the mechanism of how cells continuously increase the exerted traction force is through increasing the number of surface-engaged integrins (and cell area) rather than mounting greater force per ligand.39 Second, this observed level of force maybe related to the universal peak tension that was recently reported by Wang and Ha.40
Figure 3.

(a) Representative images of GFP-paxillin expressing NIH/3T3 cells seeded onto the 50 and 100 nm spaced AuNP substrates. Images are shown for the 0.5 and 3 h time-points, highlighting the differences in integrin tension, cell shape, and FA size at these two time points. (b) Plot of GFP-paxillin cluster size (which is indicative of FA size) as a function of time for n = 10 cells. The plot shows a steady increase in FA size over 5 h after cell seeding on the 50 nm-spaced substrate, which is in contrast to the 100 nm spaced substrate, which shows limited FA maturation. (c) Plot showing the average tension per integrin ligand across the entire cell for n = 10 cells. Integrin tension increased rapidly within the first hour and was then maintained for cells cultured on AuNP arrays spaced at 50 nm. This is in contrast to cells cultured on the AuNP arrays spaced at 100 nm where tension decreased by the later time points. (d) Representative images showing the change in integrin tension before and after treating the same cell with Y-27632 (40 μM) and cytochalasin D (10 μM). Corresponding timelapse movies are included in Movies S2 and S3 (see Supporting Information). (e) Stepwise blebbistatin and cytochalasin D treatment of cells (n = 4) led to significant reduction of mean ligand tension. (f) Blebbistatin treatment of cells (n = 4 cells) led to over 80% reduction in the total cell traction force and FA area.
The results also suggest that at early time points (∼30 min), the mechanism of integrin force generation is independent of integrin clustering, and increasing the average tension beyond 2−3 pN per ligand requires a greater ligand density (< ∼ 60 nm spacing). On the basis of previous literature, the early time point forces are likely generated by actin polymerization, rather than myosin contraction.41 To distinguish the contributions of actin polymerization and myosin contractility to integrin tension, we imaged NIH 3T3 fibroblasts before and after treatment with the Rho kinase inhibitor Y-27632, and cytochalasin D (Figure 3d, Figure S11, Movies S2 and S3, Supporting Information). Analysis from n = 5 cells treated with Y-27632 for 30 min shows that integrin tension signal generated by mature FAs decreased significantly to values of ∼2–3 pN per ligand and were exclusively localized to a submicron structure at the cell edge. In contrast, addition of 10 μM cytochalasin D rapidly (∼5 min) abolished all integrin tension signal to background levels, likely due to the disruption of actin polymerization. To further confirm that actin polymerization and myosin contractility are the two main contributors to integrin tension, we performed a stepwise inhibition of both processes in the same cells. We first performed timelapse imaging on fibroblasts (n = 4 cells) that were treated with a myosin II inhibitor (25 μM blebbistatin). In this experiment, the average ligand tension was reduced from ∼6 to ∼3 pN and reached a steady state value within 5 min of adding the drug, which is similar to the effect of Y-27632 and suggests the loss of myosin-driven tension at this time point. Interestingly, this level of tension coincides with the magnitude of ligand tension during initial cell spreading (Figure 3c, t = 30 min). When these cells were further treated with 10 μM cytochalasin D, the mean integrin ligand tension was immediately reduced (within 1 min) to approximately 2 pN and was gradually reduced to ∼1 pN within 15 min (Figure 3e). This ∼2 pN decrease in tension is likely due to the loss of actin-driven forces and associated membrane tension. Exclusively treating cells with blebbistatin led to an 80% decrease in FA size as well as >80% decrease in the total tension per cell (Figure 3f), which is in agreement with literature precedent.42 When comparing the total decrease in cell tension with the loss of tension per ligand, it is clear that myosin-inhibition leads to a decrease in the number of engaged integrins and not only a decrease in integrin tension. Taken together, this data suggests that during initial FA formation, actin polymerization drives integrin tension to an average of 1−3 pN per ligand. This is closely followed by actomyosin-contractility that increases the average tension to ∼6–8 pN and is associated with FA maturation. Note that this value of mean ligand tension was also observed in two additional cell lines, rat embryonic fibroblasts (REFs) and human bone osteosarcoma epithelial cells (U2OS) (Figure S12, Supporting Information).
To better understand the relationship between FA maturation and force transmission for the high ligand density substrate, we captured timelapse movies of integrin tension with F-actin dynamics (Figure 4a-b). At initial time points, we observed diffuse integrin tension over the lamellipodium, which was similar to the intensity of tension in cells grown on the 100 nm spaced substrate. At subsequent time points, we observed high integrin tension puncta that localized to the tips of f-actin bundles (Figure 4b (white arrow), and Movie S1, Supporting Information), which is the location of the linkage between the FA and cytoskeleton.43 We tracked a single integrin tension puncta (white arrow, Figure 4b) and observed that within the time frame (from t = 25 to 41 min) the maximum integrin ligand tension within the single FA increased 1 order of magnitude from ∼3 pN to ∼12 pN. For this single FA, we found that integrin tension increased concomitantly with FA growth (Figure S13, Supporting Information). Interestingly, micron-scale actin fiber assembly coincides with the increase of integrin tension (Figure S14, Supporting Information), in agreement with literature suggesting the importance of stress fibers as a template for tension mounting and FA maturation.44
Figure 4.

Integrin tension and actin dynamics during early FA maturation. (a) Representative brightfield, reflection-interference contrast microscopy (RICM), LifeAct GFP (TIRFM 488, red), integrin tension (epifluorescence Cy3B, green), and overlay of GFP and tension signals for a single NIH/3T3 fibroblast cells adhered on sensor substrate immediately following cell seeding. The full timelapse movie from t = 5 min to t = 43 min after cell seeding is available as Movie S1 in Supporting Information. (b) Zoom-in timelapse overlay images of integrin tension for t = 19 to 41 min.
Conclusion
We have combined BCMN with MTFM to simultaneously control ligand spacing with sub-5 nm resolution while also recording integrin tension with pN force sensitively and high temporal resolution in living cells. We found that integrin receptors placed 100 nm apart displayed significantly reduced tension as well as diminished capacity for FA formation compared to receptors with 50 nm spacing. On the basis of our data, we propose that integrin ligand sensing occurs by the following steps: (1) F-actin polymerization drives an increase in the mean integrin ligand tension to 1–3 pN during nascent adhesion formation; 2) critical ligand spacing (<60–70 nm) allows bound integrins to harness actomyosin-driven tension to increase their average tension to ∼6–8 pN, thus stabilizing FA and facilitating its maturation process. With larger ligand spacings (>100 nm), integrin clusters may be destabilized by the increase of tension, as indicated by the small FA size and high turnover rate of FA proteins.20 This physical model of FA maturation complements structural models of integrin clustering that relate the dimensions of α-actinin and talin1 to the minimal ligand spacing required for nascent adhesion maturation.45−47 This model may also shed light on how cells exert specific mechanical forces upon recognizing the nanoscale organization of cell binding sites of the ECM in tissues, such as the ∼66 nm band periodicity of collagen fibers48 and the nanometer-spaced epitope in fibronectin fibers.49 We also show that the mechanism of increasing cell traction force occurs through the recruitment of a greater number of integrins under tension rather than maintaining a constant number of integrin receptors and ramping the tension per receptor.
Note that the reported values of tension represent an average for each ligand, and this does not preclude that some ligand-receptor complexes will experience greater or lower values of force. For example, each pixel of an image collected from cells on the 50 nm spacing reports on the average force for 9 MTFM probes, and it is unlikely that all of these probes are engaged by integrin receptors. Therefore, the values of tension reporter here represent the lower bound estimate of force, and this is not inconsistent with our recent finding of integrin force-driven biotin–streptavidin dissociation26 and the recent report of 40 pN universal peak tension for integrin activation.40 It would be of interest to compare forces exerted onto more physiological integrin ligands such as fibronectin and collagen that can engage different classes of adhesion receptors and thus may display important differences in force magnitude and dynamics.
Combining MTFM with BCMN-based patterning is highly modular and adaptable, and thus this technique can be applied to study the complex relationships between receptor clustering and mechanical tension in many other receptor signaling pathways, such as T cell receptor activation and the EGFR pathway. Our approach is certainly more facile than the most commonly used approaches to measure receptor tension, such as traction force microscopy (TFM)50 and PDMS micropost arrays,39 both of which employ elastomeric substrates that deform under mechanical stress. Therefore, we expect that this strategy will likely become a workhorse tool in studying the molecular biophysics of cell receptor signaling.
Acknowledgments
K.S. is grateful for support from the NIH through R01-GM097399, the Alfred P. Sloan Research Fellowship, the Camille-Dreyfus Teacher-Scholar Award, and the NSF for the IDBR (1353939) and CAREER Award (1350829). E.A.C thanks the support from Max Planck Society for this work. We thank Professor Benjamin Geiger (Weizmann Institute of Science, Rehovot, Israel) for plasmid encoding GFP-tagged β3-integrin, paxillin, and zyxin. For excellent technical support with the AuNP patterns and SEM characterization, we would like to thank Radka Koelz and Ioanis Grigoridis. We also thank Professor Jenifer Curtis (Georgia Tech, Atlanta, U.S.A.) for developing the analysis tool to determine the spacing and hexagonality of the gold nanopatterned surfaces.
Supporting Information Available
Materials and methods, SEM and AFM characterization of BCMN patterned arrays, quantification of the value of d0 in NSET model, determination of minimal tension ligand concentration for adhesion, synthesis of tension sensor ligand, quantification of the number of tension sensor ligands per AuNP and the quenching efficiency of Cy3B, image analysis, additional analysis for FA size, integrin tension and traction force, stimulating myosin contractility with LPA treatment, stepwise inhibition of integrin tension, quantification of integrin tension for U2OS and REF, analysis of FA maturation and integrin tension dynamics within a single FA, concurrent growth of F-Actin and integrin tension, additional figures and references, and movies are included. This material is available free of charge via the Internet at http://pubs.acs.org.
The authors declare no competing financial interest.
Funding Statement
National Institutes of Health, United States
Supplementary Material
References
- O’Donoghue G. P.; Pielak R. M.; Smoligovets A. A.; Lin J. J.; Groves J. T. eLife 2013, 2, e00778. [DOI] [PMC free article] [PubMed] [Google Scholar]
- Deeg J.; Axmann M.; Matic J.; Liapis A.; Depoil D.; Afrose J.; Curado S.; Dustin M. L.; Spatz J. P. Nano Lett. 2013, 13115619–5626. [DOI] [PMC free article] [PubMed] [Google Scholar]
- Wu M.; Holowka D.; Craighead H. G.; Baird B. Proc. Natl. Acad. Sci. U.S.A. 2004, 1013813798–13803. [DOI] [PMC free article] [PubMed] [Google Scholar]
- Salaita K.; Nair P. M.; Petit R. S.; Neve R. M.; Das D.; Gray J. W.; Groves J. T. Science 2010, 32759711380–1385. [DOI] [PMC free article] [PubMed] [Google Scholar]
- Narui Y.; Salaita K. Biophys. J. 2013, 105122655–2665. [DOI] [PMC free article] [PubMed] [Google Scholar]
- Stabley D.; Retterer S.; Marshall S.; Salaita K. Integr. Biol. 2013, 54659–668. [DOI] [PMC free article] [PubMed] [Google Scholar]
- Lidke D. S.; Nagy P.; Heintzmann R.; Arndt-Jovin D. J.; Post J. N.; Grecco H. E.; Jares-Erijman E. A.; Jovin T. M. Nat. Biotechnol. 2004, 222198–203. [DOI] [PubMed] [Google Scholar]
- Yu Y.; Smoligovets A. A.; Groves J. T. J. Cell Sci. 2013, 12651049–1058. [DOI] [PubMed] [Google Scholar]
- Groves J. T.; Kuriyan J. Nat. Struct. Mol. Biol. 2010, 176659–665. [DOI] [PMC free article] [PubMed] [Google Scholar]
- Smoligovets A. A.; Smith A. W.; Groves J. T. Biophys. J. 2013, 1053L11–L13. [DOI] [PMC free article] [PubMed] [Google Scholar]
- Bakker G. J.; Eich C.; Torreno-Pina J. A.; Diez-Ahedo R.; Perez-Samper G.; van Zanten T. S.; Figdor C. G.; Cambi A.; Garcia-Parajo M. F. Proc. Natl. Acad. Sci. U.S.A. 2012, 109134869–4874. [DOI] [PMC free article] [PubMed] [Google Scholar]
- Lohmuller T.; Xu Q.; Groves J. T. Nano Lett. 2013, 1373059–64. [DOI] [PMC free article] [PubMed] [Google Scholar]
- Yu C.; Law J. B. K.; Suryana M.; Low H. Y.; Sheetz M. P. Proc. Natl. Acad. Sci. U.S.A. 2011, 1085120585–20590. [DOI] [PMC free article] [PubMed] [Google Scholar]
- Shattil S. J.; Kim C.; Ginsberg M. H. Nat. Rev. Mol. Cell Biol. 2010, 114288–300. [DOI] [PMC free article] [PubMed] [Google Scholar]
- Kanchanawong P.; Shtengel G.; Pasapera A. M.; Ramko E. B.; Davidson M. W.; Hess H. F.; Waterman C. M. Nature 2010, 4687323580–584. [DOI] [PMC free article] [PubMed] [Google Scholar]
- Burridge K.; ChrzanowskaWodnicka M. Annu. Rev. Cell Dev. Biol. 1996, 12, 463–518. [DOI] [PubMed] [Google Scholar]
- Friedland J. C.; Lee M. H.; Boettiger D. Science 2009, 3235914642–4. [DOI] [PubMed] [Google Scholar]
- Geiger B.; Spatz J. P.; Bershadsky A. D. Nat. Rev. Mol. Cell Biol. 2009, 10121–33. [DOI] [PubMed] [Google Scholar]
- Balaban N. Q.; Schwarz U. S.; Riveline D.; Goichberg P.; Tzur G.; Sabanay I.; Mahalu D.; Safran S.; Bershadsky A.; Addadi L.; Geiger B. Nat. Cell Biol. 2001, 35466–472. [DOI] [PubMed] [Google Scholar]
- Cavalcanti-Adam E. A.; Volberg T.; Micoulet A.; Kessler H.; Geiger B.; Spatz J. P. Biophys. J. 2007, 9282964–2974. [DOI] [PMC free article] [PubMed] [Google Scholar]
- Schvartzman M.; Palma M.; Sable J.; Abramson J.; Hu X. A.; Sheetz M. P.; Wind S. J. Nano Lett. 2011, 1131306–1312. [DOI] [PMC free article] [PubMed] [Google Scholar]
- Huang J.; Gräter S. V.; Corbellini F.; Rinck S.; Bock E.; Kemkemer R.; Kessler H.; Ding J.; Spatz J. P. Nano Lett. 2009, 931111–1116. [DOI] [PMC free article] [PubMed] [Google Scholar]
- de Beer A. G. F.; Cavalcanti-Adam E. A.; Majer G.; Lopez-Garcia M.; Kessler H.; Spatz J. P. Phys. Rev. E 2010, 815051914–21. [DOI] [PubMed] [Google Scholar]
- Stabley D. R.; Jurchenko C.; Marshall S. S.; Salaita K. S. Nat. Methods 2012, 9164–67. [DOI] [PubMed] [Google Scholar]
- Liu Y.; Yehl K.; Narui Y.; Salaita K. J. Am. Chem. Soc. 2013, 135145320–5323. [DOI] [PMC free article] [PubMed] [Google Scholar]
- Jurchenko C.; Chang Y.; Narui Y.; Zhang Y.; Salaita K. S. Biophys. J. 2014, 10671436–46. [DOI] [PMC free article] [PubMed] [Google Scholar]
- Morimatsu M.; Mekhdjian A. H.; Adhikari A. S.; Dunn A. R. Nano Lett. 2013, 1393985–3989. [DOI] [PMC free article] [PubMed] [Google Scholar]
- Zhang Y.; Ge C.; Zhu C.; Salaita K. Nat. Comm. 2014, 10.1038/ncomms6167. [DOI] [PMC free article] [PubMed] [Google Scholar]
- Thery M.; Piel M. Cold Spring Harbor Protoc. 2009, 10.1101/pdb.prot5255. [DOI] [PubMed] [Google Scholar]
- Giam L. R.; Massich M. D.; Hao L. L.; Wong L. S.; Mader C. C.; Mirkin C. A. Proc. Natl. Acad. Sci. U.S.A. 2012, 109124377–4382. [DOI] [PMC free article] [PubMed] [Google Scholar]
- Kolodziej C. M.; Maynard H. D. Chem. Mater. 2012, 245774–780. [Google Scholar]
- Glass R.; Arnold M.; Blummel J.; Kuller A.; Moller M.; Spatz J. P. Adv. Funct Mater. 2003, 137569–575. [Google Scholar]
- Narui Y.; Salaita K. Chem. Sci. 2012, 3, 794–799. [Google Scholar]
- Arnold M.; Cavalcanti-Adam E. A.; Glass R.; Blummel J.; Eck W.; Kantlehner M.; Kessler H.; Spatz J. P. ChemPhysChem 2004, 53383–388. [DOI] [PubMed] [Google Scholar]
- Breshike C. J.; Riskowski R. A.; Strouse G. F. J. Phys. Chem. C 2013, 1174523942–23949. [Google Scholar]
- Bouchiat C.; Wang M.; Allemand J. F.; Strick T.; Block S.; Croquette V. Biophys. J. 1999, 761409–413. [DOI] [PMC free article] [PubMed] [Google Scholar]
- Feuz L.; Strunz P.; Geue T.; Textor M.; Borisov O. Eur. Phys. J. E 2007, 233237–245. [DOI] [PubMed] [Google Scholar]
- De Gennes P. Macromolecules 1980, 1351069–1075. [Google Scholar]
- Yoshigi M.; Hoffman L. M.; Jensen C. C.; Yost H. J.; Beckerle M. C. J. Cell Biol. 2005, 1712209–215. [DOI] [PMC free article] [PubMed] [Google Scholar]
- Plotnikov S. V.; Pasapera A. M.; Sabass B.; Waterman C. M. Cell 2012, 15171513–1527. [DOI] [PMC free article] [PubMed] [Google Scholar]
- Fu J. P.; Wang Y. K.; Yang M. T.; Desai R. A.; Yu X. A.; Liu Z. J.; Chen C. S. Nat. Methods 2010, 79733–736. [DOI] [PMC free article] [PubMed] [Google Scholar]
- Wang X. F.; Ha T. Science 2013, 3406135991–994. [DOI] [PMC free article] [PubMed] [Google Scholar]
- Borisy G. G.; Svitkina T. M. Curr. Opin. Cell Biol. 2000, 121104–112. [DOI] [PubMed] [Google Scholar]
- Wolfenson H.; Bershadsky A.; Henis Y. I.; Geiger B. J. Cell Sci. 2011, 12491425–1432. [DOI] [PMC free article] [PubMed] [Google Scholar]
- Pellegrin S.; Mellor H. J. Cell Sci. 2007, 120203491–3499. [DOI] [PubMed] [Google Scholar]
- Oakes P. W.; Beckham Y.; Stricker J.; Gardel M. L. J. Cell Biol. 2012, 1963363–374. [DOI] [PMC free article] [PubMed] [Google Scholar]
- Coussen F.; Choquet D.; Sheetz M. P.; Erickson H. P. J. Cell Sci. 2002, 115122581–2590. [DOI] [PubMed] [Google Scholar]
- Meyer R. K.; Aebi U. J. Cell Biol. 1990, 11062013–2024. [DOI] [PMC free article] [PubMed] [Google Scholar]
- Roca-Cusachs P.; del Rio A.; Puklin-Faucher E.; Gauthier N. C.; Biais N.; Sheetz M. P. Proc. Natl. Acad. Sci. U.S.A. 2013, 11015E1361–E1370. [DOI] [PMC free article] [PubMed] [Google Scholar]
- Jiang F. Z.; Horber H.; Howard J.; Muller D. J. J. Struct. Biol. 2004, 1483268–278. [DOI] [PubMed] [Google Scholar]
- Smith M. L.; Gourdon D.; Little W. C.; Kubow K. E.; Eguiluz R. A.; Luna-Morris S.; Vogel V. PLOS Biol. 2007, 5102243–2254. [DOI] [PMC free article] [PubMed] [Google Scholar]
- Legant W. R.; Choi C. K.; Miller J. S.; Shao L.; Gao L.; Betzig E.; Chen C. S. Proc. Natl. Acad. Sci. U.S.A. 2013, 1103881–886. [DOI] [PMC free article] [PubMed] [Google Scholar]
Associated Data
This section collects any data citations, data availability statements, or supplementary materials included in this article.