

Abstract
We report a dual illumination, single-molecule imaging strategy to dissect directly and in real-time the correlation between nanometer-scale domain motion of a DNA repair protein and its interaction with individual DNA substrates. The strategy was applied to XPD, an FeS cluster-containing DNA repair helicase. Conformational dynamics was assessed via FeS-mediated quenching of a fluorophore site-specifically incorporated into XPD. Simultaneously, binding of DNA molecules labeled with a spectrally distinct fluorophore was detected by colocalization of the DNA- and protein-derived signals. We show that XPD undergoes thermally driven conformational transitions that manifest in spatial separation of its two auxiliary domains. DNA binding does not strictly enforce a specific conformation. Interaction with a cognate DNA damage, however, stabilizes the compact conformation of XPD by increasing the weighted average lifetime of this state by 140% relative to an undamaged DNA. Our imaging strategy will be a valuable tool to study other FeS-containing nucleic acid processing enzymes.
Keywords: multicolor single-molecule detection, total-internal reflection fluorescence microscopy, protein domain motion, DNA damage recognition, DNA repair, XPD helicase
Spontaneous and reversible open–close transitions of domains and subdomains in the absence of DNA have been observed in a number of DNA repair proteins.1−3 Transition to a more compact protein conformation accompanied by the domain motion in the presence of DNA damage is widely observed phenomenon in DNA repair.2−5 To the best of our knowledge, there is no previous study which provided direct real-time observation of a protein domain motion simultaneously with binding of a DNA in any of the proteins related to DNA repair. Conformational transitions in a protein and its interaction with the cognate substrate exemplify two important biomolecular processes that may be correlated, uncorrelated, or partially correlated.6 Although the degree to which these processes are correlated may bear heavily on the mechanism and regulation the said protein, an experimental design which follows only one reaction coordinate,7 such as monitoring and comparing the kinetics of only one process in the absence and the presence of another process, is often hindered by the lack of simple scheme to interpret the experimental results.8 An experimental strategy which incorporates multicolor illumination combined with a multicolor detection could provide an opportunity to directly acquire both types of information.
XPD (Xeroderma pigmentosum complementation group D) protein is a DNA helicase whose dsDNA strand separation9 and DNA damage verification10,11 activities are critical for the nucleotide excision repair (NER). All published crystal structures of XPDs showed that it has four domains; two motor core domains, HD1 and HD2, and two accessory domains, iron–sulfur (FeS) and ARCH domains.12−15 Structural organization of XPD, combined with biochemical11,16−18 and single-molecule data,19,20 are consistent with the proposition that the translocating DNA strand passes through the central pore formed by the ARCH, FeS, and HD1 domains into the secondary DNA binding site at the interface of the FeS domain and the HD1 (reviewed in ref (21)) (Figure 1a).
Figure 1.
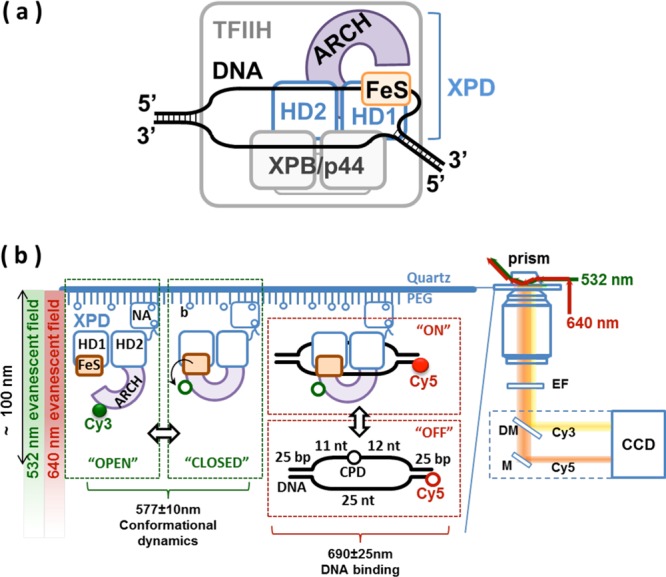
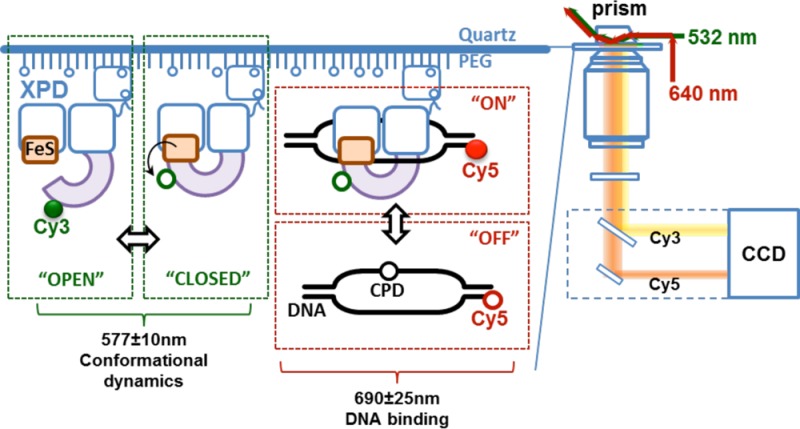
Dual illumination TIRF microscopy setup for simultaneous visualization of domain motion of XPD protein and its interaction with DNA. (a) In vivo, XPD is expected to bind a bubble DNA structure. XPD is an important player in the nucleotide excision repair (NER) pathway where it functions as a component of the TFIIH (transcription factor II–H) complex (schematically depicted as a gray rectangle) together with the second NER helicase XPB. Its native substrate is a DNA bubble. In the XPD–DNA complex, the translocating DNA strand passes through the central pore formed by the ARCH, FeS, and HD1 domains into the secondary DNA binding site at the interface of the FeS domain and HD1. (b) Illustration of the dual illumination single-molecule imaging scheme. Cy3 and Cy5 dyes were simultaneously excited by green (532 nm) and red (640 nm) lasers, respectively, in total internal reflection (TIR) mode. Cy3-AA1-XPD molecules were immobilized on surface of the TIRFM imaging chamber through biotin (b)–Neutravidin (NA) linkage. Transition between “OPEN” (highly fluorescent) and “CLOSED” (quenched) conformations of the ARCH domain of XPD was monitored in the Cy3 emission channel (577 ± 10 nm). The Cy3 fluorescence is quenched and recovers as ARCH domain moves toward and away from the iron–sulfur (FeS) cluster, respectively. Simultaneously, the DNA binding to (“ON”) and dissociation from (“OFF”) the surface-tethered XPD can be monitored in the Cy5 emission channel (690 ± 25 nm). DNA bubble construct used in this study is schematically depicted with the position of the dye (Cy5) and the damage site (CPD) indicated. Freely diffusing Cy5-labeled DNA cannot be excited outside of the evanescent field (“OFF” state) and only becomes visible when it persists near the surface due to its binding to the surface-tethered XPD (“ON” state). EF, Cy3/Cy5 dual-bandpass emission filter; DM, dichroic mirror; M, mirror.
We report in this study the development of a new single-molecule imaging assay that uses dual illumination fluorescence microscopy to establish directly and in real-time the correlation between the protein domain motion and DNA binding and dissociation. Single, fluorescently labeled XPD molecules were tethered to the surface of the imaging cell and monitored using total internal reflection fluorescence (TIRF) microscopy. Few nanometer-scale motion of the ARCH domain was detected by following FeS cluster-mediated quenching of a fluorophore that was site-specifically positioned in the ARCH domain. Dual illumination with green and red lasers was used to simultaneously detect the ARCH domain motions and binding of a DNA substrate labeled with a spectrally distinct fluorescent dye and to correlate the two events (Figure 1b). We observed the ARCH domain to undergo thermally driven open–close transitions in the absence of DNA. We showed that binding of the damaged DNA modifies the dynamics of the reversible open–close domain motion, but without strictly forcing the FeS domain into a specific conformation. The presence of CPD, a prototypical UV lesion recognized by XPD, stabilizes the closed state of the ARCH. Direct access to the microscopic dynamics of XPD revealed how DNA binding and ARCH domain conformational transitions kinetically enhance damage detection and downstream signaling.
Furthermore, FeS clusters are found in an ever-growing number of nucleic acids processing proteins, including DNA glycosylases, primases, FeS-containing helicases, and nucleases.22,23 The dual illumination single-molecule imaging assay we report here can be applied to this group of proteins to study directly the correlation between protein domain motions and binding of their cognate substrates.
One-Color Single-Molecule Fluorescence Microscopy Shows ARCH Domain to Undergo Thermally Driven Open–Close Transitions in Absence of DNA
The FeS cluster of XPD quenches fluorescence of a wide range of fluorophores in a distance-dependent manner.24 Therefore, the change in the position of the ARCH domain of XPD relative to the FeS cluster-containing domain can be monitored via FeS-mediated fluorescence quenching if the ARCH domain is labeled with a fluorescent dye. We used the aldehyde tag method developed by Bertozzi and co-workers25 and modified by Ha and co-workers26 to site-specifically label the ARCH domain with Cy3 fluorophore (Figure 2a; See Methods section for details). Previously, we expressed and purified archaeal Ferroplasma acidarmanus (Fac) XPD helicase containing 6xHis and biotin tags at the N-terminus.17 Here, we further modified the construct by introducing the aldehyde tag motif into the ARCH domain after N258. Hereafter, the Cy3-labeled construct of FacXPD will be referred to as Cy3-AA1-XPD, and the unlabeled aldehyde-tagged XPD construct will be referred to as AA1-XPD.
Figure 2.
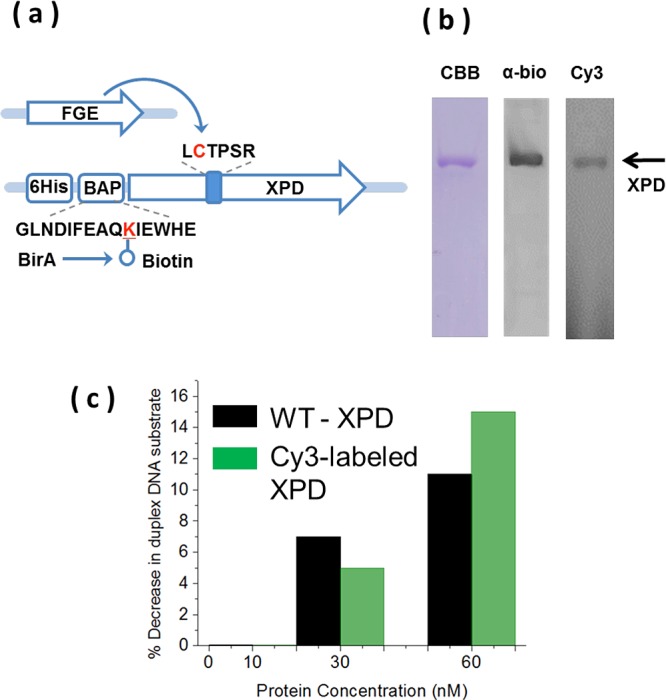
Site-specific labeling of XPD within its ARCH domain. (a) Schematic illustration of the experimental scheme for site-specific labeling of XPD within its ARCH domain. The construct for E. coli expression of the Ferroplasma acidarmanus XPD (FacXPD) contains poly histidine (6His) tag and biotin-acceptor peptide (BAP) at the N-terminus, and the aldehyde tag motif, LCTPSR, inserted in the ARCH domain after N258. The lysine residue within BAP which is biotinylated by E. coli BirA biotin ligase, and the cysteine residue within the aldehyde tag motif which is specifically converted to formyl-glycine, fGly, by formyl-glycine generating enzyme, FGE, are shown in red. After purification, Cy3-hydrazide was specifically and covalently conjugated to the aldehyde group of fGly. (b) Confirmation of purity, biotinylation, and Cy3 incorporation in XPD. SDS-PAGE of the purified aldehyde-tagged XPD (AA1-XPD) from left to right: CBB, AA1-XPD visualized by Coomassie brilliant blue staining, α-bio, antibiotin Western blot of AA1-XPD, Cy3, direct fluorescence imaging of gel of the aldehyde-tagged XPD after labeling with Cy3-hydrazide. (c) Cy3-labeled XPD retains helicase activity. Helicase activity was measured in a standard duplex separation assay where a synthetic Cy5-labeled DNA substrate (10 nM) is incubated with indicated concentrations of XPD and ATP for 15 min and the product of the reaction are separated from the substrate due to difference in their mobility on the polyacrylamide gel. The activity was estimated by measuring the percent decrease in duplex DNA mean band intensity.
Although an atomic resolution structure of FacXPD helicase is not available to date, we expect this helicase to conform to the general fold identified in related thermophilic archaeal XPDs,12−15 which feature the ARCH as a modular domain inserted into HD1 and comprised by four α-helices flanked by two β-strands. A flexible, solvent-exposed loop between the first two α-helices of the ARCH domain was selected as the location for the aldehyde-tag motif. This loop is located outside the helicase signature motifs and structural elements known to be important for both XPD helicase activity12−16 and DNA damage verification.11,15,18 Based on multiple sequence alignment, FacXPD-N258, our selected labeling site, is the equivalent of TacXPD-Q250. This residue is located approximately four nanometers (40 Å) from the FeS cluster in both the apo structure of TacXPD (PDB: 2vsf) and in the structure of TacXPD bound to a short ssDNA fragment (PDB: 4a15). We expect that this distance reflects the “closed” conformation of the ARCH domain observed in all structures solved to date.12−15 This distance is expected to increase to approximately eight to ten nanometers (80–100 Å) in the “open” conformation of the ARCH domain.
After expression and purification of the site-specifically aldehyde tagged XPD protein, it was labeled with Cy3-hydrazide, Cy3-Hz, according to Shi et al. (2012),26 but with some modifications (see Methods section for more details). The resulting Cy3-AA1-XPD contained both biotin and fluorescent dye covalently and specifically incorporated into the protein (Figure 2b). Using a single-molecule assay, we estimated the labeling efficiency to be approximately 90% (see Methods section and Figure S1 in Supporting Information ). Cy3-AA1-XPD retained dsDNA unwinding activity indistinguishable from that of the wild type protein (Figure 2c).
Cy3-AA1-XPD helicase was immobilized on the surface of the imaging chamber through the interaction between its covalently attached biotin and Neutravidin molecules bound to the sparsely biotinylated PEG-coated surface of the microscope slide (Figure 1b). Using a single-molecule ATP-dependent translocation assay established previously in our lab,19,24 we excluded any significant immobilization effects on the activities of XPD protein (See Methods section in Supporting Information and figure S2). The distribution of the durations of translocation events of surface-tethered XPD molecules was identical to the corresponding distribution of freely diffusing XPD molecules.
Immobilized Cy3-labeled XPD molecules were continuously illuminated with 532 nm laser and single-molecule data were acquired using prism-type TIRF microscopy19,27,28 (see Methods section for details). Figure 3 shows representative fluorescence intensity trajectories from individual, surface-tethered XPD molecules recorded in the absence of DNA. After single-molecule fluorescence time trajectories were extracted from videos and visualized, we applied a set of rules to select Cy3 trajectories for further analysis (see Methods section for more details). Each trajectory picked for analysis ends with a single-step loss of the Cy3 fluorescence signal to background level. This single-step, irreversible photobleaching indicates that each selected trajectory was derived from an individual molecule carrying a single label.29 As depicted in Figure 3, the Cy3 trajectories display fluctuations in fluorescence intensity in the form of discrete jumps (with transition time <100 ms) between highly fluorescent and weakly fluorescent (quenched) sets of substates.
Figure 3.

Representative Cy3 fluorescence intensity trajectories derived from individual surface-tethered XPD protein molecules. Highly fluorescent set of substates comes from more open ARCH domain conformations (“OPEN”), and weakly fluorescent (quenched) set of substates comes from closed conformations (“CLOSED”). The half a mplitude threshold for the normalized fluorescence signal is marked by the black dashed line. A less populated intermediate state approximately at the level of the threshold is shown as “I”. This state is excluded from statistical analysis. The single irreversible photobleaching step at the end of each trajectory is indicated by the black arrow.
To quantitatively evaluate the kinetics of fluorescence intensity transitions, we estimated the lifetime of each fluorescent state as follows: First, the fluorescence intensity was background corrected and normalized.30 Normalization factor for each trajectory was set as the average level of the highest fluorescent state that lasts for at least three frames. Then, transitions between highly fluorescent (open) state, and quenched (closed) state were detected by threshold criterion method.31 The threshold of each trajectory was set as half32,33 of its normalized fluorescent intensity. A state was considered finished if fluorescence intensity changes to a value that is within one standard deviation of baseline from the threshold. Each Cy3 fluorescence trajectory was processed and analyzed separately from other trajectories. An intermediate state (within one standard deviation of the threshold) was also observed, albeit infrequently, in some trajectories (Figure 3, lower panel). This less-populated state was excluded from further analysis due to the paucity of available data of this type.
The dwell times for open and closed states were combined into cumulative distributions for subsequent analysis (see Methods section for details of the error analysis and motivation for selecting this type of distributions). The cumulative dwell time distribution for the set of highly fluorescent substates was best fitted with a double exponential function, whereas the corresponding distribution of the set of weakly fluorescent substates was best fitted with three exponentials (Figure 4a and Table 1. See Methods section for more details). To rule out a photophysical origin for the observed fluctuations in fluorescence intensity, the Cy3 trajectories were extracted from videos recorded at different laser powers. The time constants of all components of the dwell time distributions for both the highly fluorescent and the quenched sets of substates were independent (within experimental uncertainty) of the laser power (Figure 4b). Such absence of laser power dependence demonstrates that the fluctuations in the fluorescence intensity are not photoinduced34 but are due to a molecular process.35,36 Accordingly, we attribute the observed fluorescence intensity fluctuations to XPD conformational transitions which change the distance between the Cy3-labeled tip of the ARCH domain and the FeS cluster. The highly fluorescent set of substates will be collectively called here the “open” state of the ARCH domain, whereas the weakly fluorescent set of substates will be collectively called the “closed” state. Our experimental system, therefore, allows direct observation of the ARCH domain stochastically sampling a range of open and closed conformations on the subsecond to tens of seconds time-scale (Table 1).
Figure 4.
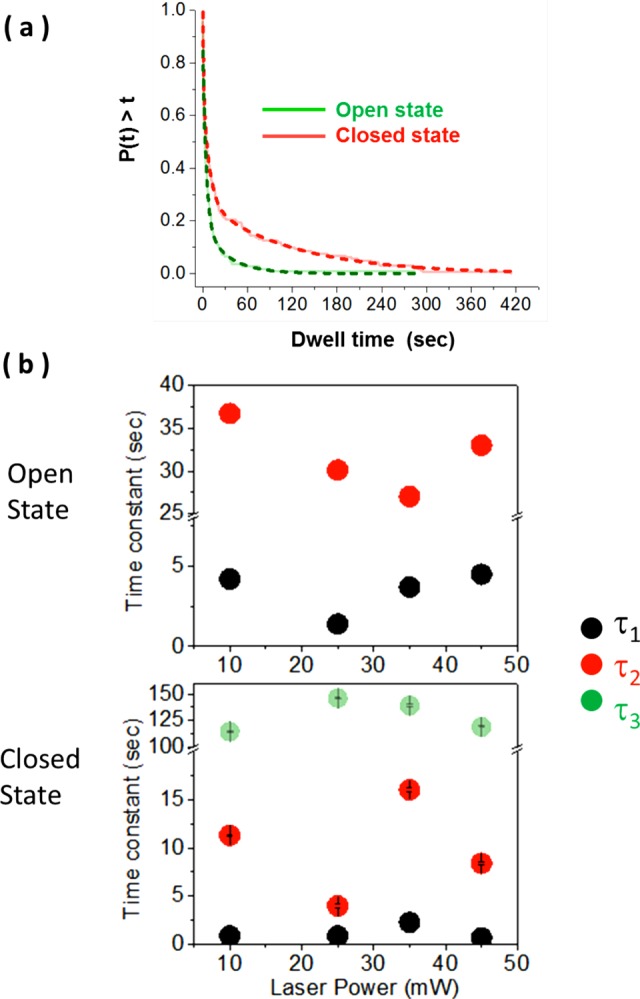
Multiexponential nature of dwell time distributions of ARCH domain conformations. (a) Normalized cumulative distributions for the ARCH domain dwell times in open (green) and closed (red) conformations. The dashed lines are best fits. Distribution for the open state is fit to double-exponential, whereas that of the closed state is fit to a triple exponential. The open–closed equilibrium favors the closed conformation. (b) Time constants of the individual exponential components of the dwell time distributions of each protein state derived from the experiments carried out at different laser powers. For each laser power, dwell time data points of each protein state were compiled into one cumulative distribution from several movies recorded on different days. Cumulative dwell time distribution of each protein state for each laser power value was constructed and fitted in the same way. Error bars (standard errors from fitting) were too small to be clearly visible.
Table 1. Summary of Fitting Results of Dwell Time Distributions of Protein Statesa.
| state | protein onlyg | undamaged DNA | damaged DNA | only undamaged DNAe | only damaged DNAh | |
|---|---|---|---|---|---|---|
| open | τ1b, s | 4.5 ± 0.1c | 1.1 ± 0.1 | 2.4 ± 0.1 | 0.6 ± 0.1 | 1 ± 0.1 |
| τ2, s | 33 ± 0.7 | 23.6 ± 0.1 | 28.3 ± 0.2 | 22 ± 0.1 | 33.6 ± 0.2 | |
| % A1b | 79 | 52 | 52 | 39 | 36 | |
| % A2 | 21 | 48 | 48 | 61 | 64 | |
| τwmi, s | 10.5 ± 1j | 11.9 ± 1 | 14.8 ± 1.1 | 13.7 ± 1.5 | 21.7 ± 2.4 | |
| Nf | 110 | 190 | 192 | 90 | 85 | |
| closed | τ1, s | 0.7 ± 0.1 | 1.7 ± 0.1 | 1.6 ± 0.1 | 1 ± 0.1 | 1.3 ± 0.3 |
| τ2, s | 8.4 ± 0.1 | 8.5 ± 0.1 | 16 ± 0.6 | 5 ± 0.2 | 10.9 ± 1.2 | |
| τ3d,s | ∼ 119 | ∼ 123 | ∼ 162 | ∼ 136 | ∼ 173 | |
| %A1 | ∼ 34 | ∼ 37 | ∼ 50 | ∼ 31 | ∼ 21 | |
| %A2 | ∼ 41 | ∼ 41 | ∼ 18 | ∼ 35 | ∼ 16 | |
| %A3d | ∼ 25 | ∼ 22 | ∼ 32 | ∼ 33 | ∼ 63 | |
| τwmi, s | ∼ 33.4 ± 2.6 | ∼ 31 ± 2 | ∼ 56 ± 3.7 | ∼ 47 ± 4.4 | ∼ 111 ± 10.9 | |
| Nf | 160 | 238 | 230 | 116 | 104 | |
Measurements reported here were done at room temperature (20 °C), 50 mM Tris–HCl (pH 7.5), 40 mM NaCl, 2 mM ATP, 3 mM MgCl3, 1 mM DTT. Respective DNA substrates were present at the concentration of 150 pM molecules.
τi and Ai are time constant and amplitude, respectively, of the exponential component i.
The errors for the τi constants are the standard errors from fitting the dwell time distributions.
Time constant and amplitude are not adjusted to account for systematic bias in data collection due to a comparable photobleaching time constant.
Parameters in this column were derived from the fitted cumulative distributions of the dwell times of the indicated protein states associated with binding events of individual “undamaged” DNA molecules.
Number of dwell times compiled in each cumulative distribution.
Single-molecule intensity–time traces were recorded in the absence of DNA.
Parameters in this column were derived from the fitted cumulative distributions of the dwell times of the indicated protein states associated with binding events of individual “damaged” DNA molecules.
“Weighted mean” of time constants was calculated as the sum of products of each time constant multiplied times its corresponding amplitude: τwmi = ∑i(τi*Ai).
The errors for the τwm values were estimated independently of the fits. See “Methods” section for more details.
By visual inspection we grouped the Cy3 fluorescence time trajectories into the following categories: (1) molecules that are switching reversibly between a rapidly fluctuating phase and a stable phase (Figure 3, upper panel); (2) molecules in which the stable phase dominates during the observation time window, with few transitions between open and closed conformations (Figure 3, lower panel); (3) molecules showing rapid fluctuations throughout the entire period of observation; and (4) molecules where XPD remained in a stable phase without transitions until the associated Cy3 dye photobleached. The latter category of trajectories was excluded from the analysis. While constructing the dwell time distribution of each protein state, we compiled dwell time data points from all categories of trajectories (except the last category). Observed diversity in behavior of conformational transitions could be one of the origins of the multiexponential nature of the dwell time distributions of protein states.37 The fastest component (τ1 in Table 1) of the multiexponential fits to the dwell time distributions for both the open and the closed states originate mainly from the third category of trajectories, whereas the slowest component (τ2 of open state, and τ3 of closed state in Table 1) originate mainly from the second category of trajectories, with less contribution from the first category of trajectories. Furthermore, each of the open and closed conformational states of the ARCH domain comprises an ensemble of substates (Figure 3, upper panel). When constructing the cumulative dwell time distributions of each of the protein states, we pooled together all the dwell times for all its substates. This could also contribute to the observed multiexponential lifetime distributions of ARCH domain conformational states.
The fast components of the multiexponential dwell time distributions of the open and closed states account for ∼75% of the total amplitude (τ1 of the open state, τ1 and τ2 of the closed state, as shown in Table 1). The weighted mean lifetime of the closed state (∼34 s) is approximately 3-fold longer than the corresponding lifetime of the open state (∼10.5 s) (Table 1). This bias toward the closed state is in agreement with the fact that all published crystal structures captured XPD helicase in the closed conformation of its ARCH domain.12−15
Past studies led us to expect a large degree of conformational flexibility along the ARCH domain - FeS cluster distance coordinate.21 In addition, the interface between the FeS and the ARCH domains of related S. acidocaldarius XPD is stabilized by weak hydrogen bonding and salt-bridges, suggesting functionally important flexibility of this interface.13 Spontaneous reversible open–close transitions of accessory domains in the absence of DNA were observed in a number of DNA repair proteins.1−3 Solution ensemble FRET studies, for example, showed that the 2B domain of UvrD helicase interconverts between two conformations in the absence of DNA.1 Domain motions around a hinge were also observed for E. coli endonuclease VIII3 and rat DNA-polymerase β.2
The conformational transitions we report here are the large amplitude collective motions that typically occur on a submillisecond to seconds time scale.38 In the case of the XPD ARCH domain, these conformational transitions are slow and occur on a subsecond to tens of seconds time scale (Table 1). There are several possibilities for the biological significance of this type of large scale, thermally driven ARCH domain motion in the absence of DNA. First, it permits switching between different functional states without consuming energy.39,40 In the case of DNA polymerase β, structural studies showed that the closed state of the apo form is very similar to the closed state of the DNA-bound form.2 Second, spontaneous domain motion enables a mechanism whereby a protein may switch from one biochemical pathway to another, without inducing a new conformation.41 Egly and co-workers proposed that the ARCH domain of human XPD helicase acts as a molecular switch, which may control the conversion of TFIIH complex from transcription to DNA repair.42 Third, conformational flexibility is critical for many DNA damage detection proteins because of the large diversity of damaged substrates they have to detect.43 Indeed, XPD helicase, and the NER machinery in general, recognize a diverse repertoire of substrates.44
Dual Illumination Single-Molecule Fluorescence Microscopy Enables Simultaneous, Direct Real-Time Observation of a Protein Domain Motion and DNA Binding and Dissociation
The most direct method to correlate conformations of the ARCH domain and binding of a DNA substrate to XPD is to supply the reaction mixture with DNA labeled with a fluorescent dye spectrally distinct from the Cy3 attached to the protein. Simultaneous visualization of the DNA and labeled ARCH domain is then achieved using dual TIR illumination with lasers that specifically excite the two dyes. The biggest technical limitation to dual illumination experiments is that many of the available, single-molecule compatible dyes display suboptimal photophysical behavior, which manifests in short photobleaching times and frequent blinking.45 Cy5 is a small organic fluorescent dye whose photophysical behavior is the closest to Cy3 when compared to other available dyes suitable for single-molecule detection. In general, data interpretation for an experimental design that uses Cy3 to report on the ARCH conformational state and Cy5 to distinguish DNA bound from DNA-free states of XPD may be complicated by FRET (Förster resonance energy transfer) between donor (Cy3) and acceptor (Cy5).46 Our experimental system allowed us to simultaneously visualize Cy5-labeled DNA binding to Cy3-labeled XPD without significant interference from FRET between this pair of dyes due to several factors. First, the FeS cluster quenches efficiently both Cy319 and Cy5.24 Second, bubble-containing DNA structures were used as the substrates (Figure 1b). We expect XPD to bind within the ssDNA bubble at the ss-dsDNA junction16,47 (Figure 1a). In all substrates used in all the dual illumination single-molecule experiments reported here, Cy5 is positioned at the end of the duplex region, 25 base pairs away from the ss-dsDNA junction. Thus, when binding takes place without unwinding, the distance between Cy3 in the ARCH domain and DNA-tethered Cy5 should be approximately nine nanometers (90 Å) or more, a sufficient distance to prevent any detectable FRET. Third, although previous studies showed that the surface-tethered monomeric XPD retains its unwinding activity, this activity largely depends on the accessory ssDNA binding protein RPA2.17 By themselves, XPD monomers display low processivity.20 Finally, XPD performance as a helicase is influenced by the sequence of the base pairs to be unwound because its unwinding mechanism relies largely on thermal breathing of the duplex. The dsDNA arms surrounding the bubble in all the substrates used here were made of G/C rich sequences (Supporting Information Table S1), which should essentially prevent substrate unwinding by single XPD molecules. Cooperation between two or more XPD molecules increases processivity, which is prevented in the single-molecule experiments reported here by immobilization of the individual XPD molecules on the surface of the microscope slide. Combined, our experimental system makes it highly unlikely for the immobilized XPD molecules to reach the vicinity of Cy5 label at the extreme end of DNA.
To probe how DNA binding affects the ARCH domain conformation, we supplied the reaction mixture with 150 pM Cy5-labeled DNA. The Cy3 and Cy5 dyes present near the surface were simultaneously excited using dual illumination with green (532 nm) and red (640 nm) lasers. We used Cy3/Cy5 dual-band-pass emission filter (Semrock, FF01-577/690) in the emission optical pathway. Images were chromatically separated using 630 nm dichroic mirror in the dual view system into Cy3 image and Cy5 image at a data acquisition rate of 10 frames per second (see Methods section). Figure 5a shows fluorescence intensity time trajectories of the ARCH domain (green) and binding/dissociation of a DNA (red), which contains a CPD (cyclobutane pyrimdine dimer; a common DNA lesion resulting from UV irradiation) at the center of its single-stranded bubble region. Similar fluorescence intensity time trajectories were recorded in the presence of undamaged DNA (the same DNA structure, except for the absence of a CPD) (see Supporting Information Figure S3a). The abrupt increases and decreases in Cy5 fluorescence intensity correspond to association of freely diffusing fluorescent DNA molecules with and their dissociation from a single, surface-tethered XPD molecule. Fluctuations in Cy3 fluorescence intensity between highly fluorescent and weakly fluorescent states reflect opening and closing, respectively, of the ARCH domain. The similar fluorescence intensities of successive DNA binding events and the single-step appearance and loss of Cy5 fluorescence signals, both indicate that the fluorescence signals originate from individual Cy5-labeled DNA molecules. Using polyacrylamide gel electrophoresis, we confirmed that the annealed Cy5-labeled DNA structure is monodispersed and, therefore, fully annealed. No significant FRET between Cy3 and Cy5 was observed; this was confirmed by the absence of any detectable anticorrelated changes in Cy3 and Cy5 fluorescence signals (Figure 5a).46 Careful selection of combined optical properties of a dual band-pass emission filter and the dichroic mirror of the dual view system (see Methods section) efficiently prevented leakage from the Cy3 channel to the Cy5 channel, which was evident from the absence of detectable directly correlated fluctuations Cy3 and Cy5 intensities. Dual illumination followed by dual detection experiments reported in the present work provide direct real-time evidence that the ARCH domain continuously samples the open and closed conformations in the presence of either damaged DNA (Figure 5a) or undamaged DNA (Supporting Information Figure S3a). In other words, the binding of either of the two types of DNA does not strictly force the protein into a specific conformation.
Figure 5.

Simultaneous direct real time observation of the DNA binding and dissociation and the conformational transitions of a domain of a repair protein. (a) Representative fluorescence intensity time trajectories of a dual illumination and dual detection experiment, with the green trace (Cy3) showing an individual XPD protein ARCH domain opening and closing and the red trace (Cy5) showing the association and dissociation of individual damaged DNA molecules. The Cy5-labeled DNA concentration was 150 pM. Distinct protein states (open and unbound, closed and unbound, closed and bound, and open and bound) are schematically shown above the corresponding fluorescence states. (b) Normalized cumulative distributions for the ARCH domain dwell times in “open” conformation in absence of DNA from the imaging chamber (black), only when simultaneously detected with binding events of undamaged DNA (green) and only when simultaneously detected with binding events of damaged DNA (red). The dashed lines represent the best fits to double-exponential. (c) Normalized cumulative distributions for the ARCH domain dwell times in “closed” conformation in absence of DNA from the imaging chamber (black), only when simultaneously detected with binding events of undamaged DNA (green) and only when simultaneously detected with binding events of damaged DNA (red). The dashed lines are best fits to triple-exponentials. The difference between the red and the green curves indicates that DNA damage stabilizes the closed conformation of ARCH domain.
In the case of undamaged DNA, approximately 80% of all binding events had a two-state appearance characteristic of repeating binding and dissociation of different Cy5-labeled DNA molecules to a single surface-tethered XPD. Binding events of damaged DNA were also dominated by this simple form of discrete jumps in Cy5 fluorescence intensity (∼70%). In the remaining events, DNA association was followed by a series of complex fluctuations in Cy5 fluorescence intensity which most likely originate from a combination of unwinding attempts, forward and backward steps20 or XPD hopping from one single-strand to the other on the same bubble (see Supporting Information Figure S3b for examples of these complex binding events).
Approximately 70% of the binding events (of all types) of undamaged DNA were initiated while the ARCH domain was in the closed conformation. A similar tendency was observed in the case of damaged DNA (out of 190 binding events counted, we observed 115 association events occurred while the ARCH domain was sampling the closed conformation). The tendencies of the ARCH domain to undergo a conformational transition in either of the two directions (opening or closing) during a binding event were similar between undamaged and damaged DNA (∼16% of all binding events of each type of DNA). However, by dividing the number of binding events associated with closed-to-open transitions by the total number of binding events associated with conformational transitions in both directions, we noticed that the percentage of binding events associated with an opening transition was smaller in the case of damaged DNA (∼60%) as compared to undamaged DNA (∼80%). Although the numbers of binding events associated with transitions in ARCH domain conformation are not large enough for a robust statistical analysis (27 and 31 binding events in the presence of undamaged and damaged DNA, respectively), it is likely that the lower percentage of damaged DNA binding events associated with opening (i.e., closed-to-open) transition is due to a slight, but detectable, stabilization of the closed state effected by the damage in the DNA substrate. Comparison of the mean lifetimes of open and closed states of the ARCH domain in the presence of damaged and undamaged DNA substrates may help verify this interpretation.
Observation that bubble DNA binding events initiated while the ARCH domain was sampling closed conformations was somewhat unexpected. On the basis of the XPD structures published to date,12−15 it is difficult to imagine how this DNA substrate can be positioned within the extended binding site15,18 while the ARCH is closed. According to the current DNA–XPD interaction model (Figure 1a), substrate binding compatible with helicase activity or damage detection by XPD can only be achieved when ssDNA passes through the pore made by the HD1, FeS, and ARCH domains.11−15,18,21 Nevertheless, we are confident that in our single-molecule assay XPD is bound to the ssDNA portion of the bubble-containing substrate because both the ensemble16 and single-molecule20,47 studies showed XPD helicase binding preferentially to the ssDNA-dsDNA junction within DNA substrates. In agreement with this binding mode, most of the dominant binding events observed for each individual XPD molecule displayed similar fluorescence intensity levels (Figure 5a), which is consistent with XPD binding to the ssDNA portion of the bubble DNA structure and away from the duplex region containing the Cy5 dye. One possible explanation for how the bubble DNA substrate is able to associate with the closed state of XPD lays in the half amplitude threshold method we used to assign open and closed states of the ARCH domain. As result, the closed ARCH state actually represents an ensemble of substates, some of which may be somewhat open, permitting the entrance of a ssDNA portion of the substrate into the central pore between the HD1, FeS, and ARCH domain.
Our dual illumination followed by dual detection routine allowed us to pinpoint and analyze separately the dwell times of only protein states which are associated with DNA binding events. By separating DNA-bound and DNA-free states of the helicase, we were in a position to evaluate subtle differences in the effect of undamaged and damaged DNA substrates on the lifetime of each ARCH domain conformational state. By comparing the cumulative dwell time distribution of each of the two conformational states in the presence of damaged DNA with its corresponding dwell time distribution in the presence of undamaged DNA, it becomes evident that the damage in DNA is associated with more significant overall increase in the weighted mean lifetime of the closed state than the case with open state (Figure 5b and c, and Table 1; see Methods section for the details of error analysis when using cumulative distribution plot). The weighted mean lifetime of closed state associated with binding events of damaged DNA is ∼140% longer (∼111 s) than the corresponding lifetime associated with undamaged DNA (47 s) (Table 1). The weighted mean lifetime of the open state increased by only 60%. The amplitude of the longest exponential component of the dwell time distribution of the closed state was approximately doubled in the presence of damaged DNA compared to the corresponding exponential component in the presence of undamaged DNA (Table 1). We did not observe a significant increase in the amplitude of the longest exponential component of the dwell time distribution of the open state. This asymmetrical increase in lifetimes of the two conformations in the presence of DNA damage results from increased stabilization of the closed state relative to the open state.
Notably, the CPD-containing DNA bound tighter to the XPD than the undamaged substrate (Figure 6). An approximately 2-fold lower Kd was the result of the enhanced kinetic association rate constant (Figure 6c), whereas the kinetic dissociation rate constant and corresponding average dwell-time of the bound state were the same for both substrates (Figure 6b). Importantly, the DNA concentration dependence of the association rates for damaged and undamaged DNA shown in Figure 6c and the absence of such dependence for the dissociation rates further confirm the binding of the DNA substrates to surface-tethered XPD molecules were not affected by the proximity to the surface.
Figure 6.

Single-molecule analysis of binding of undamaged and damaged Cy5-labeled bubble DNA to Cy3-labeled XPD. (a) Representative fluorescence intensity time trajectories of a dual illumination experiment from a single XPD molecule in the presence of bubble DNA. The green trace (Cy3) showing an ARCH domain persisting in the open state for 10s of seconds and the red trace (Cy5) showing the association and dissociation of individual bubble DNA molecules. This form of simple association/dissociation binding represents the most dominant type of events. Inverse of binding on-time is the apparent dissociation rate, and the inverse of binding off-time is the apparent association rate for each specific DNA concentration. (b) Binding on-time histogram for undamaged (left) and damaged (right) bubble DNA (at 150 pM concentration) fitted to a single exponential decay. Errors shown between brackets are the standard errors from fitting the on-time distributions. Durations of individual events were collected from approximately 50 XPD molecules and compiled in the distribution for each type of DNA. Apparent dissociation rates (inverse of binding on-time) for both types of bubble DNA are almost the same. (c) Effect of DNA concentration on the apparent association rate (inverse of binding off-time). Binding off-time at each DNA concentration was calculated in the same way as described above for binding on-time. Damaged bubble DNA shows a slightly higher apparent association rate than undamaged bubble at all DNA concentrations tested.
Eukaryotic XPD helicase participates in DNA damage detection and demarcation in the NER pathway,11,48 where it verifies that a stalled RNA polymerase, bound XPC-Rad23, or UV-DDB do indeed signify an NER compatible DNA lesion. We propose that stabilization of the closed state of the XPD ARCH domain underlies damage verification and downstream signaling in the NER pathway, likely by creating a specific interface. Transition to a more compact protein conformation in the presence of DNA damage is a widely observed phenomenon among DNA repair proteins.2−5 Stabilization of a more compact form of XPD protein in the presence of damage is consistent with in vivo observations that suggested that XPD is more stably integrated into TFIIH after UV irradiation.49
In order for XPD to act as an efficient detector of DNA damage, it should be both sensitive and specific. Recent studies have shown dynamic enzymes to be more sensitive to cellular stimuli when their free energy landscape is flatter around the native state.50 Such a landscape agrees with the spontaneous transitions in ARCH domain conformation we report here. Specificity amplification where high recognition specificity between cognate and noncognate substrates is achieved despite small differences in affinity, has been observed in many systems.51−53 This phenomenon prompted the concept of “kinetic proofreading”, whereby specificity of a biochemical reaction may be enhanced purely by kinetic means without the need for highly specific structural adaptations. Instead, the delay in one of the steps of a reversible reaction acts as “specificity kinetic amplifier”.52 In this study, we used a CPD-containing bubble DNA as a prototypical NER intermediate. Despite only marginal structural difference between CPD-containing and undamaged DNA substrates,44 XPD recognizes CPD both in vitro and in the cell.11,47 Structural transitions of the ARCH domain in the presence of damage occur on the same time scale as in the absence of damage, which indicates a relatively small difference in the activation energies of these transitions. We propose here that a loose coupling between binding of damaged DNA and populating the closed state of the ARCH domain may act as a kinetic amplifier of XPD damage detection (Figure 7). Kinetically enhanced damage detection by XPD may proceed through a bipartite mechanism: a fast initial DNA binding step reflected in the increased association rate constant for the damaged over undamaged DNA (Figure 6b and c) is followed by a slower step mediated through the large-amplitude low-frequency motion of the ARCH domain. We envision that the latter step is likely to be involved in signaling to downstream factors in the NER pathway (Figure 7).
Figure 7.
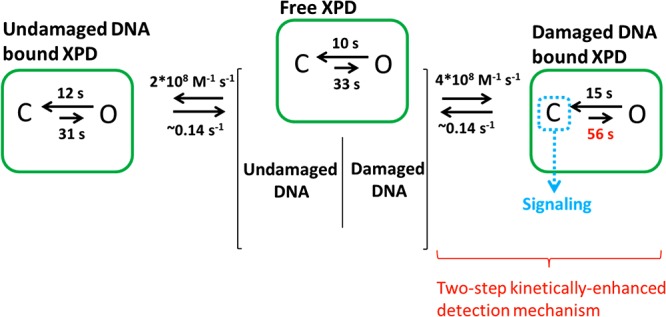
Minimal model for the role of ARCH domain dynamics in a kinetically enhanced damage detection process and in the recruitment of downstream factors of the NER pathway. Damaged and undamaged DNA can bind to both open and closed states. The association rate constants obtained without specifying the conformational state during which any binding event occurs, however, is higher for damaged DNA resulting in a slightly higher affinity (Figure 6). The ARCH domain undergoes conformational transitions both in the DNA bound and free states of XPD. Time values shown above the arrows associated with opening and closing reactions are “weighted means” of the time constants of the exponentials used to fit the lifetime distributions of the conformational states (Table 1). We propose a kinetically enhanced damage detection process composed of two steps: the first level of discrimination takes place at the moment of binding undamaged or damaged substrate, whereas the second occurs at the lifetime scale of ARCH domain conformational states. DNA binding is not strictly coupled to ARCH domain motion, but DNA damage slightly shifts the conformational equilibrium toward closed state, providing a means for a “kinetic amplification” of XPD damage detection (or discriminative power). The mechanism of signaling the presence of damage relies mainly on the increased lifetime of the closed state of the ARCH domain. Thus, a slight shift in the conformational equilibrium provides a platform for assembly of the downstream factors in NER pathway.
In conclusion, the dual illumination single-molecule imaging assay reported here allowed us for the first time to correlate directly and in real time DNA binding to and dissociation from a DNA repair protein and the conformational states of the protein domain. Surprisingly, DNA binding induced neither open–close nor close–open transitions of the ARCH domain of XPD helicase protein. On the contrary, domain conformational transitions were dominated by thermal fluctuations similar to those observed in the absence of DNA. However, the closed state becomes slightly favored upon damage detection and may create a surface for interaction with downstream factors in the NER pathway. We are currently in the process of applying this single-molecule imaging assay to other iron–sulfur containing nucleic acids processing proteins. Our method may be readily extended to the proteins that lack an intrinsic iron–sulfur cluster. This may be achieved by site-specific labeling of the target location in a protein with a quencher (such as, for example, BHQ-245,54), thereby expanding the applicability of the dual illumination–dual detection single-molecule imaging strategy we report in this work.
Methods
Proteins
All oligonucleotides used for molecular cloning were purchased from IDT, and are listed in Supporting Information Table S1. An aldehyde tag motif, LCTPSR25 was introduced to a construct for expression of FacXPD helicase containing an N-terminal 6xHis tag and E. coli BirA ligase recognition sequence.17 Aldehyde tag motif was inserted in ARCH domain after N258 using PCR-driven overlap extension method.55The aldehyde tag motif, a recognition motif for formylglycine generating enzyme (FGE), is inserted at the target location of the protein to be labeled. The constructs for expression of both the aldehyde tag containing target protein and M. tuberculosis FGE are then coexpressed in E. coli.25 FGE efficiently recognizes the aldehyde tag and catalyzes the enzymatic conversion of the cysteine residue within the motif to aldehyde-containing formylglycine, fGly. After purification of the aldehyde-tagged target protein, the resulting formyl-glycine residue can be specifically and covalently labeled with Cy3 hydrazide.26 Plasmids for expression of XPD helicase in pET47b vector and FGE in pBAD vector were cotransformed into E. coli. AB1157 (DE3) ΔrecA strain, and XPD helicase and FGE were coexpressed by following the protocol described in Carrico et al. 2007, but with some modifications. Cells were incubated in LB media at 37 °C until OD600 = 0.2–0.25, at which time FGE expression was induced with 0.02% (w/v) arabinose. After 30 min, the temperature was lowered to 16 °C and expression of XPD helicase was induced by 0.1 mM IPTG. All forms of XPD helicase were purified as previously described.16
Labeling of the Aldehyde Tagged XPD Helicase
Using an Amicon Ultra-0.5 centrifugal filter (Millipore), purified aldehyde tagged XPD protein was exchanged into labeling buffer that contained 250 mM potassium phosphate (pH 7), 500 mM KCl, and 5 mM DTT. Protein solution (30 μL of ∼15 μM concentration) was mixed with 1 mg of dried Cy3-hyrdarzide, Cy3-Hz (GE Healthcare), and then incubated in darkness at 4 °C for 24 h. Free unreacted dye was removed by using PD SpinTrap G-25 column (GE Healthcare). Labeled protein was then aliquoted and flash frozen in liquid nitrogen and finally stored at −80 °C.
Confirmation of Unwinding Activity of Cy3-Labeled XPD
Standard curve generated using Coomassie Blue stained SDS-PAGE of the wild type XPD56,57 was used to calculate the concentration of Cy3-labeled XPD (Cy3-AA1-XPD). DNA unwinding activities of the biotinylated wild type XPD and Cy3-AA1-XPD were compared using a gel-based unwinding assay described previously,16 but with some modifications. The reactions contained 10 nM Cy5-labeled forked DNA substrate with 17 bp duplex part, and 20 poly dT ssDNA overhangs. Products of unwinding reaction were separated using 15% (19:1) native polyacrylamide gel and visualized using fluorescence imaging mode of ChemiDoc MP system (BioRad). Mean band intensities were quantified using ImageJ software. Unwinding activity was estimated by measuring the decrease in forked DNA substrate mean band intensity.17
DNA Substrates
All oligonucleotides (except for CPD-containing ssDNA oligo) used in the construction of the DNA substrates were purchased from IDT. CPD-containing ssDNA oligo was purchased from TriLink Biotechnologies. Sequences of all oligonucleotides are listed in Supporting Information Table S1. To produce bubble DNA substrates, equimolar concentrations of the ssDNA oligos were mixed in a buffer contaning 10 mM Tris–HCl (pH 7.5) and 50 mM NaCl. The reaction mixture was then heated at 95 °C for 5 min in a metal heat-block. Finally, the heat block with the reaction mixture in it was allowed to cool gradually to room temperature on the work-bench. Quality of the annealed products was confirmed using electrophoresis in 15% native polyacrylamide gel.
Single-Molecule Imaging
Prism-type TIRF microscopy was used for single-molecule data acquisition.19,27,28 The TIRFM was built on an Olympus IX-71 frame (Olympus America Inc.). Diode-pumped solid state (DPSS) laser (532 nm; Coherent) and diode laser (640 nm, Coherent) were coaligned by polarizing cube beam splitter (Melles Griot, Cat. No. PBSH-450-700-050), and then guided through Pellin–Broca prism (Eksma Optics, Cat. No. 325-1206) to generate two evanescent fields of illumination for the excitation of Cy3 and Cy5 fluorophores, respectively. Fluorescence signals of both fluorophores were collected by a water immersion 60× objective (UPLANSAPO, numerical aperture 1.2, Olympus). Scattered excitation light was removed using Cy3/Cy5 dual band-pass filter (Semrock, FF01-577/690) in the emission optical pathway for both the dual-illumination and the single-color illumination imaging experiments. Images were chromatically separated into Cy3 image and Cy5 image using 630 nm dichroic mirror inside the dual view system (DV2; Photometrics). Images were recorded using EMCCD camera (Andor, DU-897-E-CSO-#BV) at 10 frames per second acquisition rate and amplification gain of 250 without binning. For dual illumination experiments, red laser intensity was adjusted independently to achieve Cy3 and Cy5 fluorescence signals of comparable levels. Cy3 emission rate of 15 kcps (i.e., kHz) at 45 mW green light was consistently achieved for all single-molecule data reported in this study (except for the experiments of the laser power dependence of dwell times of fluorescence states). A total of 20 pM XPD was immobilized on the surface of imaging chamber coated with the sparsely biotinylated PEG and Neutravidin. The excess of the labeled, untethered protein molecules was removed from the microscope imaging chamber with buffer of the same composition. Unless otherwise stated, all XPD conformational transitions experiments were carried out in the reaction buffer containing 50 mM Tris–HCl (pH 7.5), 40 mM NaCl, 3 mM MgCl2, 2 mM ATP, and 1 mM DTT. Oxygen scavenging system was used as previously described19,27 in addition to 12 mM Trolox (6-hydroxy-2,5,7,8-tetramethylchromane-2-carboxylic acid, Sigma-Aldrich, cat. no. 238813-1G). The Trolox solution was prepared in Milli-Q water in the presence of 12 mM NaOH (to guarantee complete dissolving of Trolox powder), and then incubated at room temperature (23 °C) under the light of compact fluorescent tube while being mixed by continued rotation for 2–3 days. This procedure generates an oxido-redox mixture of Trolox forms.58
Analysis of Single-Molecule Data
Single-molecule fluorescence trajectories were extracted from recorded videos and visualized as previously described.19,27,28 The rules described below were applied to select Cy3 trajectories for further analysis. First, a trajectory should show a single-step irreversible photobleaching.29 Second, average intensity of the trajectory should be stable over time, without significant gradual decrease.59 Third, at least two conformational transitions should be observed. Fourth, signal-to-noise ratio (SNR) should be more than 6:1.60 Fifth, a trajectory should be more than or equal to 10 s long.
A protein state was considered associated with DNA if a binding event took place for more than or equal to three frames during the lifetime of the state. Lifetime of a protein state at a specific experimental condition was estimated by combining dwell times from several movies (recorded on different days) in one cumulative distribution,61 which was fit to a set of exponential functions by using OriginPro software (version 8.5). Cumulative distribution representation of the dwell times was selected because it is independent of binning.61−63 Additionally, each event in this type of representation is given an equal weight, which increases the ratio of data points to parameters allowing for more robust analysis62 and increases the weight of the rare long events.64 This enhances the accuracy when fitting the distribution by conventional least-squares fitting algorithms. Cumulative representation of dwell time distributions is especially useful for estimation of the number of rate constants. Determination of the minimum number of exponentials which best fit each distribution was based on the F-test, the AIC (Akaike information criterion) test, residuals analysis, adjusted R2 (adjusted coefficient of determination) and reduced chi square values.
Error Estimation of the “Weighted Mean” Time Constants (τwm)
Because cumulative distribution plots overestimate the accuracy associated with the fits, we estimated the error in each value of τwm (see Table 1) independent of the fits by assuming that it is equivalent to fitting each cumulative distribution with only one exponential function for which the error of its time constant, τ, is τ/√N (based on Poisson statistics). Additionally, the dwell time data points presented in each cumulative distribution for each experimental condition were compiled from many videos recorded on separate days.
Acknowledgments
We thank Drs. Taekjip Ha (HHMI and University of Illinois) and Xinghua Shi (HHMI, Janelia Farm Research Campus) for providing FGE/pBAD plasmid and for sharing their protocol for in vitro labeling of the aldehyde-tagged protein. We thank all members of the Spies’ lab for the fruitful discussions and experimental advice, Dr. Todd Washington, Shyamal Subramanyam, and David Beyer for critically reading the manuscript, and to Amanda Heyward for her help with data analysis. This work was supported by HHMI early career scientist award to M.S., NIH R01 GM101167, NIH 1R01 GM108617, and University of Iowa start-up funds.
Glossary
Abbreviations
- TIRF
total-internal reflection fluorescence
- FeS
iron–sulfur
- CPD
cyclobutan pyrimidine dimer
- ssDNA
single-stranded DNA
- dsDNA
double-stranded DNA
- NER
nucleotide excision repair
Supporting Information Available
Methods used for evaluating the labeling efficiency of XPD helicase, and for exclusion of surface effects. Supplementary Figure S1: Representative single-molecule fluorescence time trajectories observed in the single-molecule translocation assay used for estimation of labeling efficiency of XPD. Supplementary Figure S2: Representative single-molecule translocation events of freely diffusing and immobilized XPD molecules, and their corresponding histograms of events durations to show that surface tethering has no effect on XPD activity. Supplementary Figure S3: Representative dual illumination single-molecule fluorescence time trajectories showing the dominant type of binding events of undamaged DNA, and the less frequent complex binding events. Supplementary Table S1: Oligonucleotides used in this study. This material is available free of charge via the Internet at http://pubs.acs.org
Author Contributions
M.G. and M.S. designed the research; M.G. performed research and analyzed data; and M.G. and M.S. wrote the paper.
The authors declare no competing financial interest.
Funding Statement
National Institutes of Health, United States
Supplementary Material
References
- Jia H.; Korolev S.; Niedziela-Majka A.; Maluf N. K.; Gauss G. H.; Myong S.; Ha T.; Waksman G.; Lohman T. M. J. Mol. Biol. 2011, 4113633–48. [DOI] [PMC free article] [PubMed] [Google Scholar]
- Berlow R. B.; Swain M.; Dalal S.; Sweasy J. B.; Loria J. P. J. Mol. Biol. 2012, 4193–4171–182. [DOI] [PMC free article] [PubMed] [Google Scholar]
- Golan G.; Zharkov D. O.; Feinberg H.; Fernandes A. S.; Zaika E. I.; Kycia J. H.; Grollman A. P.; Shoham G. Nucleic Acids Res. 2005, 33155006–16. [DOI] [PMC free article] [PubMed] [Google Scholar]
- Zharkov D. O.; Golan G.; Gilboa R.; Fernandes A. S.; Gerchman S. E.; Kycia J. H.; Rieger R. A.; Grollman A. P.; Shoham G. EMBO J. 2002, 214789–800. [DOI] [PMC free article] [PubMed] [Google Scholar]
- Kuper J.; Kisker C. Curr. Opin. Struct. Biol. 2012, 22188–93. [DOI] [PubMed] [Google Scholar]
- Juette M. F.; Terry D. S.; Wasserman M. R.; Zhou Z.; Altman R. B.; Zheng Q.; Blanchard S. C. Curr. Opin. Chem. Biol. 2014, 20, 103–11. [DOI] [PMC free article] [PubMed] [Google Scholar]
- Hohng S.; Lee S.; Lee J.; Jo M. H. Chem. Soc. Rev. 2014, 4341007–13. [DOI] [PubMed] [Google Scholar]
- Kim E.; Lee S.; Jeon A.; Choi J. M.; Lee H. S.; Hohng S.; Kim H. S. Nat. Chem. Biol. 2013, 95313–8. [DOI] [PubMed] [Google Scholar]
- Rudolf J.; Rouillon C.; Schwarz-Linek U.; White M. F. Nucleic Acids Res. 2010, 383931–41. [DOI] [PMC free article] [PubMed] [Google Scholar]
- Mathieu N.; Kaczmarek N.; Naegeli H. Proc. Natl. Acad. Sci. U.S.A. 2010, 1074117545–50. [DOI] [PMC free article] [PubMed] [Google Scholar]
- Mathieu N.; Kaczmarek N.; Ruthemann P.; Luch A.; Naegeli H. Curr. Biol.: CB 2013, 233204–12. [DOI] [PubMed] [Google Scholar]
- Wolski S. C.; Kuper J.; Hanzelmann P.; Truglio J. J.; Croteau D. L.; Van Houten B.; Kisker C. PLoS Biol. 2008, 66e149. [DOI] [PMC free article] [PubMed] [Google Scholar]
- Fan L.; Fuss J. O.; Cheng Q. J.; Arvai A. S.; Hammel M.; Roberts V. A.; Cooper P. K.; Tainer J. A. Cell 2008, 1335789–800. [DOI] [PMC free article] [PubMed] [Google Scholar]
- Liu H.; Rudolf J.; Johnson K. A.; McMahon S. A.; Oke M.; Carter L.; McRobbie A. M.; Brown S. E.; Naismith J. H.; White M. F. Cell 2008, 1335801–12. [DOI] [PMC free article] [PubMed] [Google Scholar]
- Kuper J.; Wolski S. C.; Michels G.; Kisker C. EMBO J. 2012, 312494–502. [DOI] [PMC free article] [PubMed] [Google Scholar]
- Pugh R. A.; Honda M.; Leesley H.; Thomas A.; Lin Y.; Nilges M. J.; Cann I. K.; Spies M. J. Biol. Chem. 2008, 28331732–43. [DOI] [PubMed] [Google Scholar]
- Pugh R. A.; Lin Y.; Eller C.; Leesley H.; Cann I. K.; Spies M. J. Mol. Biol. 2008, 3835982–98. [DOI] [PubMed] [Google Scholar]
- Pugh R. A.; Wu C. G.; Spies M. EMBO J. 2012, 312503–14. [DOI] [PMC free article] [PubMed] [Google Scholar]
- Honda M.; Park J.; Pugh R. A.; Ha T.; Spies M. Mol. Cell 2009, 355694–703. [DOI] [PMC free article] [PubMed] [Google Scholar]
- Qi Z.; Pugh R. A.; Spies M.; Chemla Y. R. eLife 2013, 2, e00334. [DOI] [PMC free article] [PubMed] [Google Scholar]
- Spies M. DNA Repair 2014, 20, 58–70. [DOI] [PMC free article] [PubMed] [Google Scholar]
- Wu Y.; Brosh R. M. Jr. Nucleic Acids Res. 2012, 40104247–60. [DOI] [PMC free article] [PubMed] [Google Scholar]
- White M. F.; Dillingham M. S. Curr. Opin. Struct. Biol. 2012, 22194–100. [DOI] [PubMed] [Google Scholar]
- Pugh R. A.; Honda M.; Spies M. Methods 2010, 513313–21. [DOI] [PMC free article] [PubMed] [Google Scholar]
- Carrico I. S.; Carlson B. L.; Bertozzi C. R. Nat. Chem. Biol. 2007, 36321–2. [DOI] [PubMed] [Google Scholar]
- Shi X.; Jung Y.; Lin L. J.; Liu C.; Wu C.; Cann I. K.; Ha T. Nat. Methods 2012, 95499–503. [DOI] [PMC free article] [PubMed] [Google Scholar]
- Masuda-Ozawa T.; Hoang T.; Seo Y. S.; Chen L. F.; Spies M. Nucleic Acids Res. 2013, 4163576–87. [DOI] [PMC free article] [PubMed] [Google Scholar]
- Haghighat Jahromi A.; Honda M.; Zimmerman S. C.; Spies M. Nucleic Acids Res. 2013, 41136687–97. [DOI] [PMC free article] [PubMed] [Google Scholar]
- Xie X. S.; Dunn R. C. Science 1994, 2655170361–4. [DOI] [PubMed] [Google Scholar]
- Jin H.; Heller D. A.; Kim J. H.; Strano M. S. Nano Lett. 2008, 8124299–304. [DOI] [PubMed] [Google Scholar]
- Zhou R.; Kunzelmann S.; Webb M. R.; Ha T. Nano Lett. 2011, 11125482–8. [DOI] [PMC free article] [PubMed] [Google Scholar]
- Sachs F.; Neil J.; Barkakati N. Pflugers Arch. (Eur. J. Physiol.) 1982, 3954331–40. [DOI] [PubMed] [Google Scholar]
- Colquhoun D.; Sigworth F. J.. Fitting and Statistical Analysis of Single-Channel Records. In Single-Channel Recording; Sakmann B., Neher E., Eds.; Springer: New York, 1995; pp 483–587. [Google Scholar]
- Lu H. P.; Xie X. S. Nature 1997, 3856612143–146. [Google Scholar]
- Lia G.; Michel B.; Allemand J.-F. Science 2012, 3356066328–331. [DOI] [PubMed] [Google Scholar]
- Brender J. R.; Dertouzos J.; Ballou D. P.; Massey V.; Palfey B. A.; Entsch B.; Steel D. G.; Gafni A. J. Am. Chem. Soc. 2005, 1275118171–8. [DOI] [PubMed] [Google Scholar]
- Akyuz N.; Altman R. B.; Blanchard S. C.; Boudker O. Nature 2013, 5027469114–8. [DOI] [PMC free article] [PubMed] [Google Scholar]
- Henzler-Wildman K.; Kern D. Nature 2007, 4507172964–72. [DOI] [PubMed] [Google Scholar]
- Ratzke C.; Berkemeier F.; Hugel T. Proc. Natl. Acad. Sci. U.S.A. 2012, 1091161–6. [DOI] [PMC free article] [PubMed] [Google Scholar]
- Hanson J. A.; Duderstadt K.; Watkins L. P.; Bhattacharyya S.; Brokaw J.; Chu J. W.; Yang H. Proc. Natl. Acad. Sci. U.S.A. 2007, 1044618055–60. [DOI] [PMC free article] [PubMed] [Google Scholar]
- Balci H.; Arslan S.; Myong S.; Lohman T. M.; Ha T. Biophys. J. 2011, 1014976–984. [DOI] [PMC free article] [PubMed] [Google Scholar]
- Abdulrahman W.; Iltis I.; Radu L.; Braun C.; Maglott-Roth A.; Giraudon C.; Egly J. M.; Poterszman A. Proc. Natl. Acad. Sci. U.S.A. 2013, 1108E633–42. [DOI] [PMC free article] [PubMed] [Google Scholar]
- Yu B.; Edstrom W. C.; Benach J.; Hamuro Y.; Weber P. C.; Gibney B. R.; Hunt J. F. Nature 2006, 4397078879–84. [DOI] [PubMed] [Google Scholar]
- Kesseler K. J.; Kaufmann W. K.; Reardon J. T.; Elston T. C.; Sancar A. J. Theor. Biol. 2007, 2492361–75. [DOI] [PMC free article] [PubMed] [Google Scholar]
- Chen J.; Tsai A.; Petrov A.; Puglisi J. D. J. Am. Chem. Soc. 2012, 134135734–7. [DOI] [PMC free article] [PubMed] [Google Scholar]
- Ha T. Methods 2001, 25178–86. [DOI] [PubMed] [Google Scholar]
- Buechner C. N.; Heil K.; Michels G.; Carell T.; Kisker C.; Tessmer I. J. Biol. Chem. 2014, 28963613–24. [DOI] [PMC free article] [PubMed] [Google Scholar]
- Compe E.; Egly J. M. Nat. Rev. Mol. Cell Biol. 2012, 136343–54. [DOI] [PubMed] [Google Scholar]
- Giglia-Mari G.; Miquel C.; Theil A. F.; Mari P. O.; Hoogstraten D.; Ng J. M.; Dinant C.; Hoeijmakers J. H.; Vermeulen W. PLoS Biol. 2006, 46e156. [DOI] [PMC free article] [PubMed] [Google Scholar]
- Ma B.; Nussinov R. Top. Curr. Chem. 2013, 337, 123–37. [DOI] [PMC free article] [PubMed] [Google Scholar]
- Hopfield J. J. Proc. Natl. Acad. Sci. U.S.A. 1974, 71104135–9. [DOI] [PMC free article] [PubMed] [Google Scholar]
- Ninio J. Biochimie 1975, 575587–95. [DOI] [PubMed] [Google Scholar]
- Qian H. Annu. Rev. Phys. Chem. 2007, 58, 113–42. [DOI] [PubMed] [Google Scholar]
- Chen J.; Petrov A.; Tsai A.; O’Leary S. E.; Puglisi J. D. Nat. Struct. Mol. Biol. 2013, 206718–27. [DOI] [PMC free article] [PubMed] [Google Scholar]
- Heckman K. L.; Pease L. R. Nat. Protoc. 2007, 24924–32. [DOI] [PubMed] [Google Scholar]
- Vincent S. G.; Cunningham P. R.; Stephens N. L.; Halayko A. J.; Fisher J. T. Electrophoresis 1997, 18167–71. [DOI] [PubMed] [Google Scholar]
- Knight M. I.; Chambers P. J. Mol. Biotechnol. 2003, 23119–28. [DOI] [PubMed] [Google Scholar]
- Cordes T.; Vogelsang J.; Tinnefeld P. J. Am. Chem. Soc. 2009, 131145018–9. [DOI] [PubMed] [Google Scholar]
- Zhao Y.; Terry D. S.; Shi L.; Quick M.; Weinstein H.; Blanchard S. C.; Javitch J. A. Nature 2011, 4747349109–13. [DOI] [PMC free article] [PubMed] [Google Scholar]
- Haller A.; Rieder U.; Aigner M.; Blanchard S. C.; Micura R. Nat. Chem. Biol. 2011, 76393–400. [DOI] [PubMed] [Google Scholar]
- Sung J.; Sivaramakrishnan S.; Dunn A. R.; Spudich J. A. Methods Enzymol. 2010, 475, 321–75. [DOI] [PubMed] [Google Scholar]
- Gebhardt J. C.; Clemen A. E.; Jaud J.; Rief M. Proc. Natl. Acad. Sci. U.S.A. 2006, 103238680–5. [DOI] [PMC free article] [PubMed] [Google Scholar]
- Okamoto K.; Terazima M. J. Phys. Chem. B 2008, 112247308–14. [DOI] [PubMed] [Google Scholar]
- Bartley L. E.; Zhuang X.; Das R.; Chu S.; Herschlag D. J. Mol. Biol. 2003, 32851011–26. [DOI] [PubMed] [Google Scholar]
Associated Data
This section collects any data citations, data availability statements, or supplementary materials included in this article.