

Abstract
Purpose of review
Living kidney donation improves the lives of those with kidney failure, but there are potential risks to the donor. We review two recent publications that describe the long-term risk of end-stage renal disease (ESRD) in living kidney donors.
Recent findings
One study reported that the long-term risk (median follow-up 15.1 years) of ESRD was, in relative terms, 11-fold higher in living kidney donors compared to healthy nondonors, and suggested a hereditary association since all affected donors were biologically related to their recipients and the causes were predominantly immunological diseases. In a second study, we estimated that the long-term risk (median follow-up 7.6 years) of ESRD was, in relative terms, eight-fold higher in living kidney donors compared to healthy matched nondonors. In both studies, the absolute increase in the 15-year incidence of ESRD from donation was below 0.5%. There are limitations in these studies, which have raised questions about the accuracy of the estimates of risk.
Summary
The results of these studies should be discussed with potential living kidney donors with an emphasis on the low 15-year incidence of ESRD following donation. The lifetime incidence of ESRD for donors of different age, race, and other characteristics requires further study.
Keywords: end-stage renal disease, living kidney donors, long-term outcomes
INTRODUCTION
For patients with end-stage renal disease (ESRD), kidney transplantation is associated with improved long-term survival compared to dialysis [1,2]. Every year, over 27 000 living kidney donations are performed worldwide, comprising almost 40% of transplants performed [3]. The risks to the living kidney donor are thought to be minimal when balanced against the benefits for the recipient [4–8]. Despite a 25–40% reduction in glomerular filtration rate (GFR) following living donor nephrectomy, the risk of ESRD was previously thought to be lower or no different compared to the general population (e.g. 180 cases per million person-years in donors vs. 268 per million person-years in the general population [9]) since living kidney donors are thoroughly screened and are inherently healthier than the general population [9–11]. Recently, two studies have reported an increased risk of ESRD amongst living kidney donors compared to a selected group of healthy nondonors [12▪▪,13▪▪].
Box 1.
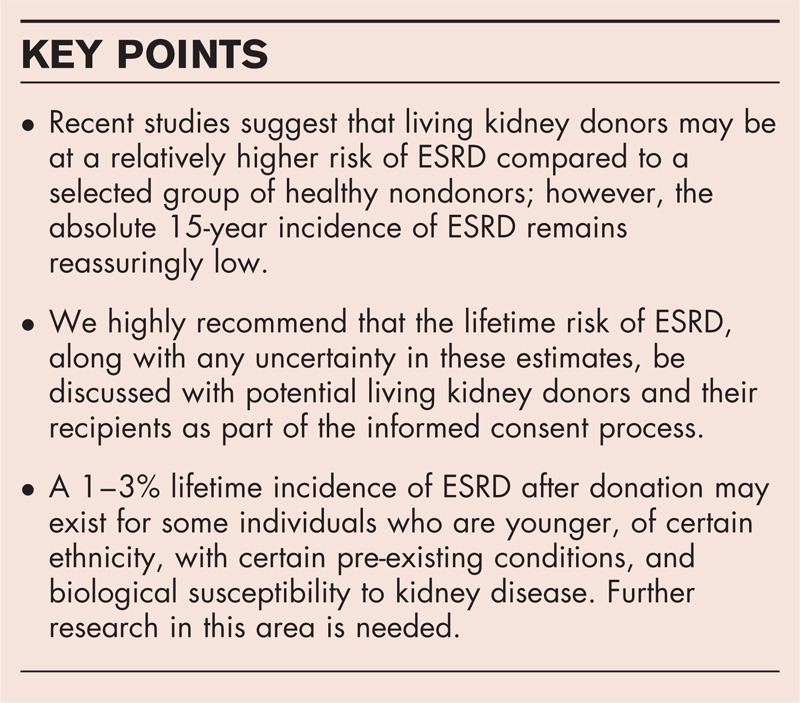
no caption available
END-STAGE RENAL DISEASE IN LIVING KIDNEY DONORS
In this review, we address current concepts about the risk of ESRD following living kidney donation, the issues that need to be considered when putting these results into context for potential donors, and the unanswered questions that guide future research.
The Norwegian experience
Mjøen et al.[12▪▪] reported on 1901 living kidney donors who underwent donor nephrectomy from a single center in Norway between 1963 and 2007 (median follow-up 15.1 years, range 1.5–43.9 years). Few Norwegian residents emigrate ensuring a high rate of follow-up through their national registry, though we expect the loss to follow-up was not zero. Whereas some centers adopt a minimum estimated GFR (eGFR) of 80 ml/min/1.73 m2 to proceed with donor nephrectomy, the minimum eGFR of donors for inclusion in the main analyses was 70 ml/min/1.73 m2 (41 donors with an eGFR <70 ml/min/1.73 m2 were excluded). However, this is unlikely to be a major concern, as the mean predonation eGFR was 105 ml/min/1.73 m2 and the results did not change when a minimum eGFR of 80 ml/min/1.73 m2 was used. The authors excluded older donors (>70 years old, n = 89), and those with hypertension (blood pressure >140/90 or treatment with antihypertensive medications, n = 106), or obesity (BMI >30 kg/m2, n = 125). The comparison control group consisted of 32 621 individuals selected from a population-based survey [Health Study of Nord-Trøndelag (HUNT)] conducted between 1984 and 1987 (median follow-up 24.9 years, range 0.1–26.0 years) with similar exclusion criteria to donors, although information on renal function was not available.
Nine donors (0.47%) developed ESRD during follow-up (defined as receipt of chronic dialysis or a kidney transplant; median time from donation 18.7 years, range 10.3–24.3 years) compared to 22 healthy nondonors (0.07%). All nine donors who developed ESRD were biologically related to their recipient and immunologic renal diseases were the main cause of ESRD (e.g. glomerulonephritis, vasculitis), suggesting a hereditary factor to the development of renal failure in donors [14]. However, since 85% of donors (1608/1901) were related to their recipient [80% of donors (1519/1901) were first-degree relatives], this may explain why cases of ESRD were more likely to be observed in donors. Additionally, Norway began accepting biologically unrelated donors in 1983 [n = 293 (15%) included in this study] and the follow-up time for the development of ESRD may have been shorter compared to biologically related donors. Lastly, although immunologic diseases predominated in donors, the causes of ESRD in their recipients were not reported.
The authors concluded that the risk of ESRD was higher in living kidney donors than healthy nondonors [adjusted hazard ratio 11.38, 95% confidence interval (CI) 4.37–29.63, P < 0.001]. There was also an increased risk of all-cause mortality (from the Kaplan–Meier curve, the cumulative incidence at 25 years was approximately 18% in donors vs. 13% in healthy nondonors matched to the donors on age, sex, SBP, BMI, and smoking status; adjusted hazard ratio 1.30, 95% CI 1.11–1.52, P < 0.001) and cardiovascular mortality (adjusted hazard ratio 1.40, 95% CI 1.03–1.91, P = 0.03).
Although previous studies have shown little to no additional risk following donor nephrectomy compared to the general population [9,10], this study is among the first to suggest an increase in risk compared to a group of selected healthy nondonors [15]. This is one reason why the results have been scrutinized. One consideration of this study is the different accrual periods between the donors and nondonors. The longer maximum follow-up in the donors may have led to more detected cases of ESRD than in nondonors by the end of the study follow-up if the risk of renal failure is nonlinear and increases with time since cohort entry [16]. However, given that the minimum and maximum time from donation to ESRD (10.3 and 24.3 years) were within the follow-up time for the control group, and how the survival analyses compare similar periods of follow-up for the two groups, the potential for bias related to differing lengths of follow-up may be low.
It is possible that differences in the baseline characteristics between the donors and nondonors may have confounded the observed increased risk. For example, donors were older at baseline than nondonors [mean age, years (SD), 46.0 (11.5) vs. 37.6 (11.7)] [17]. To address this, in a ‘Letter to the Editor’, the authors provided the baseline characteristics of the healthy matched nondonors, demonstrating the mean age at cohort entry for both groups was 46 years [18].
Lastly, the healthy nondonors were selected from a population-based survey of residents from a single county that may not have been representative of the Norwegian population. For example, the average income and prevalence of higher education is lower in Nord-Trøndelag county compared to Norway overall (and these were not adjusted for in the multivariable analyses); reassuringly, the incidence of morbidity and mortality in this county appears representative of Norway [19].
If the incidence of ESRD in living kidney donors is 300 per million person-years, as suggested in this study, and if one assumes everyone lives to the age of 80 and that the average incidence rate over the remaining years lived is the same irrespective of the age at donation (which it may not be), then for a 20, 40 and 60-year-old donor, the estimated lifetime incidence of ESRD would approximate 1 in 50, 1 in 75, and 1 in 150, respectively [20]. Corresponding numbers for nondonors based on an incidence of 100 per million person-years in the Norway general population would approximate 1 in 150, 1 in 250, and 1 in 500, respectively. This may influence how transplant programs select living kidney donors, particularly when recipients have more than one donor come forward. Instead of selecting a younger donor to optimize graft function for the recipient, an alternative strategy, when the anticipated graft survival is acceptable, may be to select the older donor with established stable renal function whose lifetime incidence of developing ESRD would be less than the younger donor [21▪,22]. Another advantage of this strategy would be that the younger donor might still be eligible to donate to their intended recipient in the event that the initial graft fails. By this time, the potential donor will have either maintained acceptable general and renal health (and now their lifetime incidence of ESRD is lower) or developed medical conditions since their initial evaluation that would now preclude donation. In circumstances where only one young donor is available, it remains to be clarified what level of predonation GFR minimizes the complications from living with a single kidney for many decades.
The American experience
Muzaale et al.[13▪▪] reported on 96 217 living kidney donors from the United States who underwent donor nephrectomy between 1994 and 2011 [median follow-up 7.6 years, interquartile range (IQR) 3.9–11.5 years, maximum 15.0 years]. The mean eGFR at donation was 101 ml/min/1.73 m2 (SD 23.7). The comparison group consisted of 20 024 participants from the Third National Health and Nutrition Examination Survey (NHANES III) enrolled between 1988 and 1994. Participants with medical conditions that could have precluded donation were excluded from the primary analyses (n = 10 660) leaving 9364 healthy nondonors as controls. The healthy nondonors were matched to the donors with replacement iteratively expanding radius matching based on age, sex, race, education, BMI, smoking history, and SBP. Nondonors could be selected more than once resulting in a cohort of 96 217 healthy matched nondonors (median follow-up 15.0 years, IQR 13.7–15.0 years, maximum 15.0 years).
The observed median followup time was shorter in donors than healthy matched nondonors. In donors, 99 (0.10%) developed ESRD in follow-up (defined as receipt of chronic dialysis or a kidney transplant or placement on the waiting list) compared to 36 events (0.04%) in healthy matched nondonors (drawn from 17 events in 9364 healthy unmatched nondonors, defined as receipt of chronic dialysis or a kidney transplant). The estimated 15-year cumulative incidence of ESRD was higher in living kidney donors compared to healthy matched nondonors [30.8 per 10 000 persons (95% CI 24.3–38.5, approximately 1 in 320) vs. 3.9 per 10 000 persons (95% CI 0.8–8.9; approximately 1 in 2500); P < 0.001]. The proportion of ESRD among the screened but prematched NHANES pool (0.18%) has been highlighted in another commentary [23], but is not directly comparable before demographic matching because NHANES oversampled for older, Black, and Hispanic participants. ESRD occurred at a mean duration of 8.6 years (SD 3.6 years) after donation compared to 10.7 years (SD 3.2 years) after enrollment for the healthy matched nondonors.
In subgroup analyses of the donors, the 15-year cumulative incidence of ESRD was higher in donors who were older (≥60 years) vs. younger (18–39 years) at the time of donation [70.2 per 10 000 persons (approximately 1 in 140) vs. 29.4 per 10 000 persons (approximately 1 in 340)] and amongst African-American donors vs. Caucasian donors. Notably, the absolute increase in the estimated 15-year incidence of ESRD attributable to donation (i.e. compared with healthy controls) was higher in African-Americans (increase of 50.8 events per 10 000 persons) than among Caucasians (increase of 22.7 events per 10 000 persons). About two-thirds of the donors were biologically related to the recipient and 84% (83/99) of ESRD cases were observed in such donors; however, the 15-year cumulative incidence of ESRD did not significantly differ between biologically related and unrelated donors.
The lifetime incidence of ESRD, estimated across the life scale by splicing together observed incidence at younger ages (accrued by individuals who were young while in the study) with observed incidence at older ages (accrued by individuals who were older while in the study), was 90 per 10 000 in donors, 14 per 10 000 in healthy matched nondonors, and 326 per 10 000 in the demographically matched, unscreened nondonors, drawn from NHANES to represent the general population.
Selecting the appropriate nondonor control group to whom donors can be compared is central to any study attempting to define risks attributable to donor nephrectomy [23]. Despite using a matching technique, there were modest differences in the baseline characteristics between the two groups, raising the possibility that the estimates (adjusted for baseline differences only through the matching process) were slightly confounded. In our opinion, the method of nondonor selection in this study was reasonable. One consideration, though, is the repeated inclusion of healthy nondonors for the matching technique, which may have underestimated the incidence of renal failure in nondonors if by chance the incidence in the initial sample was lower than a larger sample 10 times its size [24].
The definition of ESRD also differed amongst donors vs. nondonors (the former included placement on the waiting list). This would be a concern if many of the donors in the study with ESRD were placed on the waiting list for preemptive transplants but were never subsequently transplanted or started on dialysis. Lastly, symptoms of kidney disease frequently manifest when the disease is advanced. Greater follow-up kidney surveillance in donors vs. nondonors, as well as the possibility of less comorbidity at the time of ESRD (which increases the chances of ESRD being treated), and greater access to ESRD treatment (in many jurisdictions living kidney donors with ESRD are given priority on the transplant waiting list) could have contributed to a higher number of detected ESRD cases in donors vs. nondonors.
These two studies highlight the importance of considering the absolute incidence of ESRD rather than relying on relative risks alone when interpreting and applying these results. Although the calculated relative risk of ESRD was higher compared to a selected group of healthy nondonors, there was a reassuringly low absolute incidence of ESRD over the follow-up period. The consistent results of both studies are compelling enough that the risks should be discussed with potential donors and their recipients as part of the informed consent process, with emphasis on the low absolute 15-year incidence of developing ESRD following donor nephrectomy.
ASSESSING INDIVIDUAL RISK OF END-STAGE RENAL DISEASE
Whereas these two studies advance our current knowledge regarding the long-term risk of ESRD in living kidney donors, it is still unclear how certain donor characteristics such as age, race, and baseline comorbidities affect these estimates of risk. Although Mjøen et al.[12▪▪] excluded certain living kidney donors from their analyses (e.g. older donors, those with hypertension), Muzaale et al.[13▪▪] included these donors of which 4.2% were older (≥60 years old), 9.0% had hypertension (SBP ≥140 mmHg), 25.2% were obese (BMI ≥30), and 22.1% had lower predonation renal function (eGFR <80 ml/min/1.73 m2). As described above, the 15-year cumulative incidence of ESRD was higher among older (vs. younger) donors and African-American (vs. Caucasian) donors. An increased risk of ESRD amongst African-American donors may be due to either genetics [including variants in the gene for apolipoprotein L1 (APOL1)] or the increased risk of developing comorbidities after donation, such as hypertension [25,26,27▪]. More stringent exclusion criteria for African-American donors may worsen racial disparities in access to living donor transplantation and further studies assessing the lifetime incidence of ESRD in African-American living kidney donors are needed [27▪,28].
Although practices vary by center, there has been more common acceptance of living kidney donors with pre-existing medical conditions, such as hypertension [29,30]. This recent shift in practice has occurred with limited data to support whether the outcomes beyond 10 years, including ESRD, are acceptable for these donors. There is a need for carefully designed, prospective, multicenter cohort studies comparing living kidney donors with an appropriate nondonor control group with extended follow-up and little to no loss to follow-up [16,17]. Such studies would ideally also include living kidney donors who were older, were racially diverse, and had pre-existing conditions to determine if these factors increase long-term risks compared to nondonors. Whereas there are challenges in developing and performing such a study, the results would improve the informed consent process for living kidney donors and their recipients, justify the ongoing practice of living donation, and guide follow-up recommendations for living kidney donors to ensure long-term renal health.
CONCLUSION
Two recent publications suggest consistent findings of approximately a 10-fold increased relative risk of ESRD following live donor nephrectomy. Although the limitations of the studies should be recognized when interpreting the results, the findings raise sufficient concerns that warrant further discussion amongst the transplant community and with future potential donors and their recipients. Further research is needed to guide our understanding of the lifetime implications of living kidney donation.
Acknowledgements
None.
Conflicts of interest
N.N.L. was supported by the Clinical Investigator Program at Western University and by a Kidney Research Scientist Core Education and National Training Program (KRESCENT) postdoctoral fellowship award. K.L.L. was supported by a grant from the National Institutes of Health (NIH)/National Institute of Diabetes and Digestive and Kidney Diseases (NIDDK), ‘Long-Term Health Outcomes After Live Kidney Donation in African Americans’ (R01-DK096008). A.X.G. received an investigator-initiated grant from Astellas and Roche to support Canadian Institutes of Health Research study in living kidney donors, and his institution received unrestricted research funding from Pfizer.
REFERENCES AND RECOMMENDED READING
Papers of particular interest, published within the annual period of review, have been highlighted as:
▪ of special interest
▪▪ of outstanding interest
REFERENCES
- 1.Wolfe RA, Ashby VB, Milford EL, et al. Comparison of mortality in all patients on dialysis, patients on dialysis awaiting transplantation, and recipients of a first cadaveric transplant. N Engl J Med 1999; 341:1725–1730 [DOI] [PubMed] [Google Scholar]
- 2.Medin C, Elinder CG, Hylander B, et al. Survival of patients who have been on a waiting list for renal transplantation. Nephrol Dial Transplant 2000; 15:701–704 [DOI] [PubMed] [Google Scholar]
- 3.Horvat LD, Shariff SZ, Garg AX. Global trends in the rates of living kidney donation. Kidney Int 2009; 75:1088–1098 [DOI] [PubMed] [Google Scholar]
- 4.Thomas SM, Lam NN, Huang A, et al. Risk of serious gastrointestinal bleeding in living kidney donors. Clin Transplant 2014; 28:530–539 [DOI] [PubMed] [Google Scholar]
- 5.Thomas SM, Lam NN, Welk BK, et al. Risk of kidney stones with surgical intervention in living kidney donors. Am J Transplant 2013; 13:2935–2944 [DOI] [PubMed] [Google Scholar]
- 6.Lam N, Huang A, Feldman LS, et al. Acute dialysis risk in living kidney donors. Nephrol Dial Transplant 2012; 27:3291–3295 [DOI] [PMC free article] [PubMed] [Google Scholar]
- 7.Garg AX, Meirambayeva A, Huang A, et al. Cardiovascular disease in kidney donors: matched cohort study. Br Med J 2012; 344:e1203. [DOI] [PMC free article] [PubMed] [Google Scholar]
- 8.Clemens K, Boudville N, Dew MA, et al. The long-term quality of life of living kidney donors: a multicenter cohort study. Am J Transplant 2011; 11:463–469 [DOI] [PubMed] [Google Scholar]
- 9.Ibrahim HN, Foley R, Tan L, et al. Long-term consequences of kidney donation. N Engl J Med 2009; 360:459–469 [DOI] [PMC free article] [PubMed] [Google Scholar]
- 10.Garg AX, Muirhead N, Knoll G, et al. Proteinuria and reduced kidney function in living kidney donors: a systematic review, meta-analysis, and meta-regression. Kidney Int 2006; 70:1801–1810 [DOI] [PubMed] [Google Scholar]
- 11.Cherikh WS, Young CJ, Kramer BF, et al. Ethnic and gender related differences in the risk of end-stage renal disease after living kidney donation. Am J Transplant 2011; 11:1650–1655 [DOI] [PubMed] [Google Scholar]
- 12▪▪.Mjøen G, Hallan S, Hartmann A, et al. Long-term risks for kidney donors. Kidney Int 2013; 86:162–167 [DOI] [PubMed] [Google Scholar]; This study reports that the long-term risk of end-stage renal disease after a median follow-up of 15.1 years was 11-fold higher in living kidney donors compared to a selected group of healthy nondonors. There was also an increased risk of all-cause mortality and cardiovascular death.
- 13▪▪.Muzaale AD, Massie AB, Wang M-C, et al. Risk of end-stage renal disease following live kidney donation. J Am Med Assoc 2014; 311:579–586 [DOI] [PMC free article] [PubMed] [Google Scholar]; This study used US national data to follow 96 217 living kidney donors over a median of 7.6 years and we estimate that the risk of end-stage renal disease was almost eight-fold higher compared to matched nondonor controls. Although the study included a large number of living kidney donors, concerns regarding the statistical matching of nondonors is a limitation of the study.
- 14.O’Dea DF, Murphy SW, Hefferton D, Parfrey PS. Higher risk for renal failure in first-degree relatives of white patients with end-stage renal disease: a population-based study. Am J Kidney Dis 1998; 32:794–801 [DOI] [PubMed] [Google Scholar]
- 15.Garg AX, Prasad GVR, Thiessen-Philbrook HR, et al. Cardiovascular disease and hypertension risk in living kidney donors: an analysis of health administrative data in Ontario, Canada. Transplantation 2008; 86:399–406 [DOI] [PubMed] [Google Scholar]
- 16.Garg AX, Boudville N. Live kidney donation was associated with increased mortality and end-stage renal disease at 15 years. Ann Intern Med 2014; 160:JC12. [DOI] [PubMed] [Google Scholar]
- 17.Kaplan B, Ilahe A. Quantifying risk of kidney donation: the truth is not out there (yet). Am J Transplant 2014; 14:1715–1716 [DOI] [PubMed] [Google Scholar]
- 18.Mjøen G, Hallan S, Holdaas H. The authors reply. Kidney Int 2014; 85:1241–1242 [DOI] [PubMed] [Google Scholar]
- 19.Holmen J, Midthjell K, Kruger O, et al. The Nord-Trøndelag Health Study 1995–97 (HUNT2): objectives, contents, methods and participation. Nor J Epidemiol 2003; 13:19–32 [Google Scholar]
- 20.Boudville N, Garg AX. End-stage renal disease in living kidney donors. Kidney Int 2014; 86:20–22 [DOI] [PubMed] [Google Scholar]
- 21▪.Steiner RW, Ix JH, Rifkin DE, Gert B. Estimating risks of de novo kidney diseases after living kidney donation. Am J Transplant 2014; 14:538–544 [DOI] [PubMed] [Google Scholar]; This study suggests that young donors may be at a higher lifetime risk of developing renal failure than older donors.
- 22.Young A, Kim SJ, Speechley MR, et al. Accepting kidneys from older living donors: impact on transplant recipient outcomes. Am J Transplant 2011; 11:743–750 [DOI] [PubMed] [Google Scholar]
- 23.Lin J, Kramer H, Chandraker AK. Mortality among living kidney donors and comparison populations. N Engl J Med 2010; 363:797–798 [DOI] [PubMed] [Google Scholar]
- 24.Gill JS, Tonelli M. Understanding rare adverse outcomes following living kidney donation. J Am Med Assoc 2014; 311:577–579 [DOI] [PubMed] [Google Scholar]
- 25.Cohen DM, Mittalhenkle A, Scott DL, et al. African American living-kidney donors should be screened for APOL1 risk alleles. Transplantation 2011; 92:722–725 [DOI] [PMC free article] [PubMed] [Google Scholar]
- 26.Lentine KL, Schnitzler MA, Xiao H, et al. Racial variation in medical outcomes among living kidney donors. N Engl J Med 2010; 363:724–732 [DOI] [PMC free article] [PubMed] [Google Scholar]
- 27▪.Lentine KL, Schnitzler MA, Xiao H, et al. Consistency of racial variation in medical outcomes among publicly and privately insured living kidney donors. Transplantation 2014; 97:316–324 [DOI] [PMC free article] [PubMed] [Google Scholar]; This study highlights the increased risk of developing co-morbidities postdonation in African-American living kidney donors compared to Caucasian donors.
- 28.Gibney EM, King AL, Maluf DG, et al. Living kidney donors requiring transplantation: focus on African Americans. Transplantation 2007; 84:647–649 [DOI] [PubMed] [Google Scholar]
- 29.Reese PP, Feldman HI, McBride MA, et al. Substantial variation in the acceptance of medically complex live kidney donors across US renal transplant centers. Am J Transplant 2008; 8:2062–2070 [DOI] [PMC free article] [PubMed] [Google Scholar]
- 30.Taler SJ, Messersmith EE, Leichtman AB, et al. Demographic, metabolic, and blood pressure characteristics of living kidney donors spanning five decades. Am J Transplant 2013; 13:390–398 [DOI] [PMC free article] [PubMed] [Google Scholar]