

Abstract
Background
The gut microbiome plays a role in the regulation of the immune system.
Methods
We prospectively enrolled 26 kidney transplant recipients and collected serial fecal specimens (N=85) during the first three months of transplantation. We characterized bacterial composition by PCR amplification of the 16S rRNA V4-V5 variable region and deep sequencing using the Illumina® MiSeq platform.
Results
An increase in the relative abundance of Proteobacteria was observed in the post-transplantation specimens compared to pre-transplantation specimens (P=0.04, Wilcoxon signed-rank test). In patients with post-transplant diarrhea, the mean(±SD) Shannon diversity index was lower in those with diarrhea (N=6) than those without diarrhea (N=9) (2.5±0.3 vs. 3.4±0.8, P=0.02, Wilcoxon rank-sum test). Principal coordinate analysis (PCoA) showed clear separation between the two groups, and linear discriminant analysis effect size (LEfSe) method revealed that Bacteroides, Ruminococcus, Coprococcus, and Dorea were significantly lower in the patients with diarrhea. PCoA analysis also showed clear separation between the acute rejection (AR) group (N=3) and the no AR group (N=23) and LEfSe method revealed several significant differences between the two groups. Fecal abundance of Enterococcus was associated with Enterococcus urinary tract infection (UTI). The median Enterococcus fecal abundance was 24% (Range: 8% to 95%) in the 3 patients with Enterococcus UTI compared to 0% in the 23 patients without Enterococcus UTI (Interquartile range: 0.00% to 0.08%)(P=0.005, Wilcoxon rank-sum test).
Conclusions
Our pilot study identified significant alterations in the gut microbiota following kidney transplantation. Moreover, distinct microbiota structures were observed in allograft recipients with post-transplant diarrhea, AR, and Enterococcus UTI.
Keywords: gut microbiota, diarrhea, acute rejection, urinary tract infection, 16S rRNA deep sequencing, renal transplantation
INTRODUCTION
The Human Microbiome Consortium has catalogued the rich diversity in microbial structure and function and habitat-related microbial speciation in healthy individuals (1). While the diversity within the healthy population poses challenges in developing disease-specific microbial signatures, it is encouraging that Oh et al found in a study of ileal microbiota from 19 small bowel transplants recipients that the relative compositions of multiple bacterial taxa are diagnostic of acute rejection (2). Moreover, alterations in the gut microbiota do not appear to be restricted to small bowel transplants. Taur and colleagues found marked disruption of intestinal flora in human recipients of allogeneic stem cell grafts and that the alterations in microbial structure was informative of risk for bacteremia (3).
In this pilot study, we extracted DNA from 85 fecal specimens collected from 26 kidney allograft recipients and characterized the gut microbiota by PCR amplification of the 16S rRNA V4–V5 variable region and deep sequencing using the Illumina® MiSeq platform. We examined whether alterations in microbial composition occur following transplantation, and whether post-transplant complications such as diarrhea, acute rejection (AR), and urinary tract infection (UTI) are associated with alterations in relative microbial abundance.
RESULTS
Characteristics of the Kidney Transplant Cohort
We characterized the microbiota of 85 fecal specimens collected from 26 allograft recipients. At least two specimens from each recipient were collected within the first 90 days of transplantation (Table S1, Supplemental Digital Content [SDC]). Among the 26 recipients, 24 received a kidney allograft alone and 2 received simultaneous kidney and pancreas allografts (SPK). Table 1 is a summary of the characteristics of the 26 patients. Data at the individual patient level are provided in Table S2.
Table 1.
Clinical Characteristics of the Study Cohort
| Transplant Recipients, N (%) | 26 (100) |
|---|---|
| General Characteristics | |
| Age (Median, Interquartile Range) | 56, 46–63 |
| Female, N (%) | 13 (50) |
| Race | |
| Caucasian, N (%) | 16 (61.5) |
| Hispanic, N (%) | 6 (23.1) |
| African American, N (%) | 4 (15.4) |
| Organ Type | |
| Kidney, N (%) | 24 (92) |
| Simultaneous Pancreas & Kidney, N (%) | 2 (8) |
| Type of Transplantation | |
| Living Donor Transplantation, N (%) | 14 (53.8) |
| Deceased Donor Transplantation, N (%) | 12 (46.2) |
| Immunosuppressive Therapy | |
| Induction Antibody Therapy | |
| Anti-thymocyte globulin, N (%) | 20 (77) |
| Basiliximab, N (%) | 6 (23) |
| Maintenance Immunosuppressive Drugs | |
| Tacrolimus and Mycophenolate Acid, N (%) | 25 (96) |
| Tacrolimus and Mycophenolate Mofetil, N (%) | 1 (4) |
| Steroid Protocol | |
| Steroid Maintenance, N (%) | 10 (38) |
| Steroid Free, N (%) | 16 (62) |
| Perioperative Antibiotics | |
| Preoperative Surgical Prophylaxis | |
| Cefazolin, N (%) | 21 (81) |
| Vancomycin, N (%) | 3 (11) |
| Ampicillin/Sulbactam/Cefoxitin, N (%) | 1 (4) |
| Ampicillin/Sulbactam, N (%) | 1 (4) |
| Pneumocystic Jiroveci Prophylaxis | |
| Trimethoprim/Sulfamethoxazole, N (%) | 23 (88) |
| Dapsone, N (%) | 2 (8) |
| Atovaquone, N (%) | 1 (4) |
16S rRNA Deep Sequencing for the Characterization of the Gut Microbiota
DNA was extracted from each fecal specimen; the 16S rRNA V4–V5 variable region was amplified using PCR; and the purified PCR products were sequenced on an Illumina® MiSeq platform. A total of 1,946,273 high quality 16S rRNA-encoding sequences were obtained from these 85 fecal specimens. From the total reads, a maximum of 5000 reads per specimen were randomly selected for computation and the results reported herein are based on 4,764±777 (mean±SD) reads per fecal specimen.
Changes in Fecal Microbiota Following Transplantation
Five of 26 recipients provided a fecal specimen prior to transplantation and prior to the initiation of induction therapy/preoperative antibiotic prophylaxis and a second specimen approximately 2 weeks following transplantation. All 5 received induction therapy with anti-thymocyte globulin, pre-operative antibiotics with cefazolin, and Pneumocystis jiroveci pneumonia (PCP) prophylaxis with trimethoprim/sulfamethoxazole. The gut microbiota in the 5 pretransplant specimens from the 5 recipients had a higher abundance of Firmicutes to Bacteroidetes when compared to the composition in the healthy general population, as characterized by the Human Microbiome Consortium (1) but similar to the abundance reported in a study of patients with end-stage renal disease (4).
Figure 1 shows the alterations in the fecal microbiota following transplantation at the level of genus (Fig. 1A), phylum (Fig. 1B), and order (Fig. 1C, Table S3). At the phylum level, the relative abundance of Proteobacteria increased from 0.9% in the pre-transplant specimens to 4.1% in the post-transplant specimens (P=0.04, Wilcoxon signed-rank test) (Fig. 1B and Table S3). At the order level, the relative abundance of Erysipelotrichales increased from 5.6% to 10.2% (P=0.04) and Enterobacteriales from 0.4% to 3.9% (P=0.04) (Fig. 1C and Table S3).
Figure 1. Alterations in the Gut Microbiota Following Kidney Transplantation.

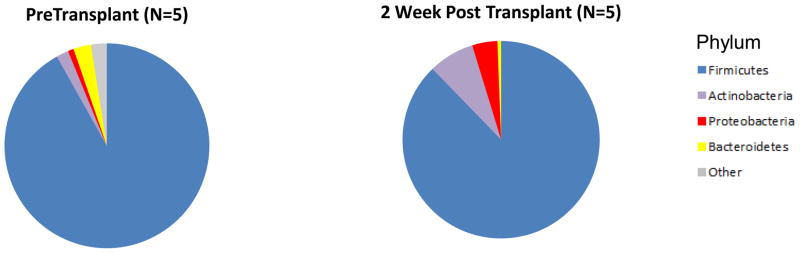
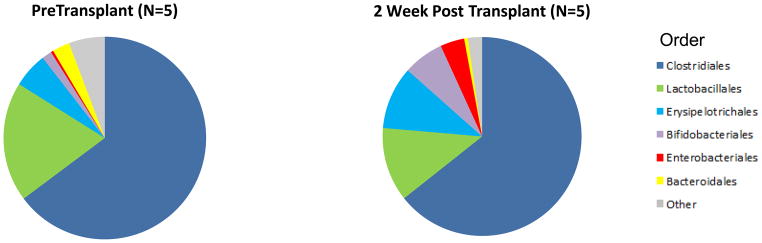
Each of the 5 kidney transplant recipients provided a fecal specimen prior to transplantation and prior to receiving any induction immunosuppression therapy or antibiotic prophylaxis and a second fecal specimen approximately 2 weeks after transplantation. All 5 recipients received similar induction therapy, preoperative antibiotics, and PCP prophylaxis therapy. The 5 sets of bar graphs show the gut microbiota of the 5 kidney transplant recipients at the genus level over time (Panel A). Each bar represents the relative composition of bacteria in the stool sample from each patient. The x-axis indicates the day of specimen collection from the transplantation event as the reference day (Day 0); the y-axis indicates the relative bacterial percentage corresponding to each taxon. Each taxon is labeled by color as defined in the legend. Panels B and C show the differences in gut microbial composition between the pre-transplantation specimens and the 2 week post-transplantation specimens by phylum and order levels, respectively. Each color in the pie chart represents the corresponding taxon group in the legend. At the phylum level, the relative abundance of Proteobacteria (red) was higher in the post-transplantation specimens compared to pre-transplantation specimen in all 5 patients (P=0.04, Wilcoxon signed-rank test). At the order level, the relative abundance of Erysipelotrichales (light blue, P=0.04) and Enterobacteriales (red, P=0.04) were higher in the post-transplantation specimen compared to pre-transplantation specimen in all 5 patients.
The Shannon diversity index is a measure of microbial species diversity in a community. The index reflects its richness, that is the number of different species in an environment, and its evenness, that is the relative abundance of each species in that environment (5). A low diversity as measured by the Shannon diversity index has been associated with disease states like inflammatory bowel disease (6). The mean(±SD) Shannon diversity index in the pre-transplantation samples was 3.7±0.3 and 3.1±0.8 in the post-transplantation samples (P=0.22, Wilcoxon signed-rank test).
Post-Transplantation Diarrhea and the Fecal Microbiota
Six patients developed diarrhea within the first month of kidney transplantation. The median time from transplantation to the occurrence of diarrhea was 10.5 days. The median number of bowel movements per day was 4 and the median duration of diarrhea was 4.5 days.
We compared the microbial composition in the 6 fecal specimens collected from the 6 patients during an episode of diarrhea to the microbial composition in 9 time-matched fecal specimens from the 9 recipients who did not develop diarrhea. We selected these 9 patients for comparison since these patients received similar induction with anti-thymocyte globulin therapy as the 6 patients with diarrhea. They also had similar preoperative antibiotic prophylaxis with cefazolin, PCP prophylaxis therapy with trimethoprim/sulfamethoxazole, and maintenance immunosupression with tacrolimus and mycophenolic acid. No additional antibiotics were administered prior to the studied time frame.
The Shannon diversity index was significantly lower in the samples collected from the patients with diarrhea compared to the time-matched fecal specimens collected from the patients without diarrhea (2.5±0.3 vs. 3.4±0.8, respectively) (P=0.02, Wilcoxon rank-sum test).
We utilized principal coordinate analysis (PCoA) to analyze differences between the diarrhea and no diarrhea cohort. PCoA is an analytical tool to investigate the dissimilarity between different communities using a distance matrix that is based on an N dimensional coordinate system where N is the number of samples (7). The distance matrix can be created using UniFrac which measures the phylogenetic distances between sets of taxa as the fraction of the branch length of the tree that leads to descendants from one environment or another (7). Importantly, the analysis can be represented in two-dimensional space, allowing for an exploration of the differences between groups of bacterial communities. The analysis provides an overall comparison of bacterial communities but does not identify differences in specific taxa.
PCoA of the diarrhea cohort and the no diarrhea cohort shows clear separation between the two groups (Fig. 2A). Table S4 shows the differences in the mean relative abundances at the phylum and order levels. At the phylum level and order level, the abundance of Bacteroidetes (P=0.007) and Bacteroidales (P=0.007) were lower in the fecal specimens from the patients with diarrhea than in the specimens from the patients without diarrhea (Wilcoxon rank-sum test) (Fig. 2B and 2C, Table S4).
Figure 2. Differential Gut Microbial Composition in Patients with or without Post-Transplant Diarrhea.


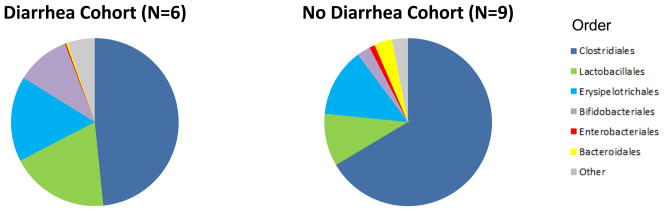

Panel A shows the principal coordinate analyses of the 6 patients with diarrhea and the 9 patients without diarrhea. The first two axes of the principal coordinate analysis are represented with principal coordinate axis 1 on the y-axis (10.60% variability) and principal coordinate axis 2 on the x-axis (9.17% variability). The individual red points represent the 6 fecal specimens from the 6 patients with diarrhea and the individual green points represent the 9 fecal specimens from the 9 patients without diarrhea. Panels B and C represent the differences in gut microbiota between the diarrhea cohort and no diarrhea cohort by phylum and order levels, respectively. Each color in the pie chart represents the corresponding taxon group in the legend. Bacteroidetes and Bacteroidales are represented in yellow and were significantly decreased in the diarrhea cohort (P=0.007, P=0.007, respectively). LEfSe method was performed to determine individual taxons that were significantly associated with the diarrhea cohort (red) and the no diarrhea cohort (green) (Panel D). A cladogram based on the LEfSe method is shown in Panel E and highlights the taxonomic groups in the diarrhea cohort (red) and in the no diarrhea cohort (green).
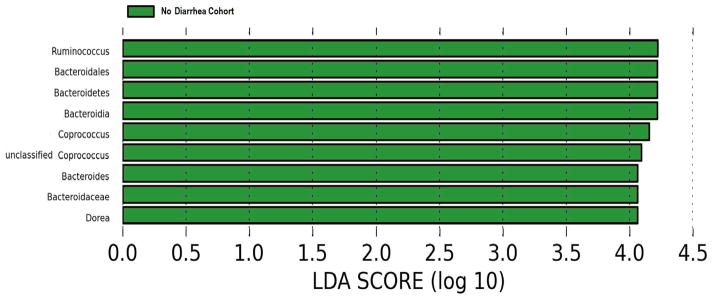
We utilized the linear discriminant analysis effect size (LEfSe) method to compare taxa between the diarrhea vs. no diarrhea groups. The LEFSe method is an algorithm for biomarker discovery that identifies differently abundant taxa (e.g. Escherichia coli) between two or more groups (8). It utilizes the non-parametric Kruskal-Wallis statistical test to compare all taxa at different taxonomic levels between groups and then paired Wilcoxon Rank Sum tests among subgroups. It builds a linear discriminant analysis (LDA) model which utilizes continuous independent variables to predict one dependent variable (e.g. diarrhea vs. no diarrhea) and provides an effect size for the significantly different taxa (8).
LEfSe method revealed that the phylum, Bacteroidetes, and its derivative, Bacteroides, as well as Ruminococcus, Coprococcus, and Dorea are all significantly higher in the fecal specimens from the patients without diarrhea and conversely, significantly lower in the fecal specimens from the patients with diarrhea (Fig. 2D). Clostridium difficile was not detected in the fecal specimens from 5 of the 6 patients with diarrhea.
A cladogram that highlights the relationship between the significantly different taxa is shown in Fig. 2E. A cladogram is a diagram that provides the relationship between taxa at different taxonomic levels (e.g. Bacteroides (genus) is under Bacteroidales (order) which is under Bacteroidetes (phylum)). A single clade is a group of organisms with a common ancestor (e.g. Bacteroidetes is a common ancestor for all of the genera under it). Whereas Fig. 2D lists the significantly different taxa based on effect size, Fig. 2E represents the significantly different taxa in a tree like structure and reveals how the significantly different taxa are interrelated.
Acute Rejection, UTI and Fecal Microbiota
Three of the 26 allograft recipients experienced a biopsy-confirmed acute rejection within the first 90 days of transplantation. Patient 2 (SPK recipient) underwent a clinically indicated kidney allograft biopsy on post-transplant day 23 and the biopsy showed mixed acute T cell mediated cellular rejection (ACR) and acute antibody mediated acute rejection (AMR); patient 18 (Kidney alone recipient) had a biopsy on post-transplant day 7 that was diagnosed as AMR; and patient 26 (Kidney alone recipient) had a biopsy on post-transplant day 64 that was diagnosed as ACR.
We compared the gut microbial composition in the fecal samples from the acute rejection recipients (AR Cohort, N=3) to time-matched control samples from the recipients without acute rejection (no AR Cohort, N=23) (Fig. 3 and Table S5). Principal coordinate analysis of the AR Cohort and the no AR Cohort is presented in Fig. 3A and shows clear separation between the two groups. At the phylum level, Bacteroidetes was lower in the AR cohort than in the no AR cohort (0.02% vs. 3.1%, P=0.03, Wilcoxon rank-sum test) (Fig. 3B and Table S5). At the order level, Lactobacillales was higher in the AR cohort than in the no AR cohort (49.9% vs. 12.7%, P=0.04) while Clostridiales (16.9% vs. 63.1%, P=0.01) and Bacteroidiales (0.02% vs. 3.1%, P=0.03) were lower in the AR cohort than in the no AR cohort (Fig. 3C and Table S5).
Figure 3. Differential Gut Microbial Composition in Patients with or without Acute Rejection.

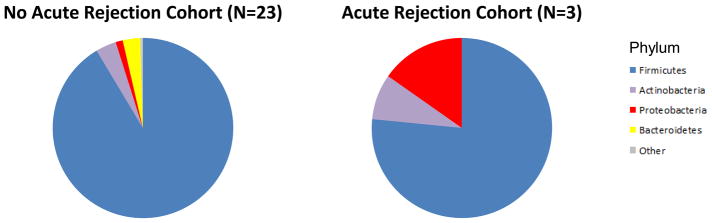
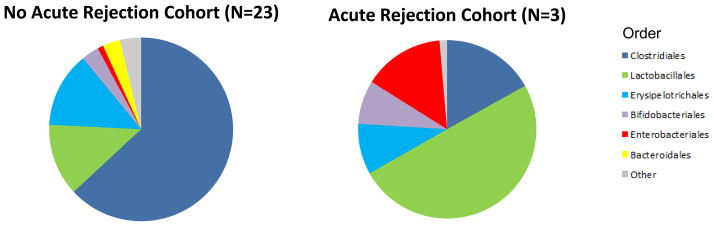


Panel A represents the principal coordinate analyses of the individual patients with or without biopsy confirmed acute rejection. The first two axes of the principal coordinate analysis are represented with principal coordinate axis 1 on the y-axis (8.17% variability) and principal coordinate axis 2 on the x-axis (5.58% variability). The individual red points represent the 3 fecal specimens from the 3 patients with biopsy confirmed AR and the individual green points represent the 23 time matched fecal specimens from the 23 patients who did not develop AR. Panels B and C represent the differences in fecal microbiota between the two groups by phylum and order levels, respectively. Each color in the pie chart represents the corresponding taxon in the legend. At the phylum level, Bacteroidetes was lower in the AR cohort than in the no AR cohort (P=0.03). At the order level, Lactobacillales was higher in the AR cohort (P=0.04) and Clostridiales and Bacteroidales was lower in the AR cohort (P=0.01, P=0.03, respectively) when compared to the no AR cohort. LEfSe method was performed to determine individual taxons that were significantly associated in the AR cohort (red) and in the no AR cohort (green) (Panel D). A cladogram based on the LEfSe method is shown on Panel E and highlights the taxonomic groups associated with AR (red) and no AR (green).
LEfSe method to compare taxa between the AR cohort and the no AR cohort revealed several significantly different taxa. The AR cohort had higher relative abundance of Lactobacillales, Enterococcus, Anaerofilum, and Clostridium tertium. The AR cohort also had lower relative abundance of Clostridiales, Bacteroidales, and Lachnospiraceae and that of Blautia, Eubacterium dolichum, Ruminococcus, and Bacteroides (Fig. 3D). A cladogram representing the phylogenetic relationships among the significantly different taxa is shown in Fig. 3E.
The 3 patients with an episode of AR had treatment with multiple antibiotics for infections prior to the occurrence of AR. Table S6 lists the antibiotics and the infectious complications including the date of diagnosis and duration of antibiotic therapy. In 2 of the 3 recipients with AR, fecal specimens collected prior to the development of acute rejection were available to document antibiotic therapy associated changes in microbial composition. Supplementary figure S1A shows the changes in the microbiota of these two patients following administration of antibiotics and Fig. S1B shows the marked decrease in Shannon diversity index following administration of antibiotics. In contrast, neither marked perturbations in microbial composition nor major decreases in the Shannon diversity index were observed in 5 recipients who did not received additional antibiotics or experienced an episode of acute rejection (Fig. S1A and Fig. S1B, respectively).
Three kidney transplant recipients developed Enterococcus urinary tract infection (UTI). Figure 4 illustrates the genus composition of serial stool samples from the 3 patients with Enterococcus UTI and from 3 representative kidney transplant recipients without Enterococcus UTI. Patient 2 developed detectable Enterococcus in the stool 16 days prior to the diagnosis of Enterococcus UTI; Patient 18 had detectable Enterococcus a day after the diagnosis of Enterococcus UTI; Patient 26 had detectable Enterococcus 39 days after the diagnosis of Enterococcus UTI but also detectable Enterococcus 26 days prior to the diagnosis of a recurrent Enterococcus UTI. Figure 4 highlights the persistence of Enterococcus (in green) in the recipients with Enterococcus UTI and Enterococcus absence in graft recipients without Enterococcus UTI.
Figure 4. Enterococcus Fecal Abundance and Enterococcus Urinary Tract Infections in Allograft Recipients.

The 6 sets of bar graphs represent 6 of the 26 kidney transplant recipients studied; patients 2, 18, and 26 developed Enterococcus UTI and patients 9, 12, and 19 are 3 of the 23 patients who did not develop Enterococcus UTI. Each bar represents the relative composition of bacteria in the stool sample from each patient. The x-axis indicates the day of specimen collection from the transplantation event as the day of reference (day 0); the y-axis indicates the relative bacterial percentage corresponding to each taxon. Each taxon is labeled by color as defined in the legend. Enterococcus relative abundance is represented in green and is present in patients 2, 18, and 26 whereas absent in the patients without Enterococcus UTI. The timing/day of the Enterococcus UTI is indicated by the horizontal bar in green above the bar graphs.
We also compared the microbiota in the 3 fecal specimens closest to the diagnosis of Enterococcus UTI to the microbiota of 23 time-matched control fecal specimens from kidney transplant recipients without Enterococcus UTI. This analysis showed that the median Enterococcus fecal abundance is 24% (range:8% to 95%) in the patients with Enterococcus UTI compared to 0% in the patients without Enterococcus UTI (interquartile range [IQR}:0.00% to 0.08%) (P=0.005, Wilcoxon rank-sum test).
Induction Therapy, Corticosteroid Maintenance, and the Fecal Microbiota
Eighteen of the 26 patients were induced with either anti-thymocyte globulin (N=15) or basiliximab (N=3) and received similar perioperative antibiotics and did not receive any additional antibiotic therapy. In this subset of patients, we explored whether the type of induction therapy impacted gut microbial composition. This analysis showed that the relative abundance of Actinobacteria (8.5% vs. 1.0%) (P=0.34) and Bifdobacteriales (7.7% vs. 0.4%) (P=0.37) in the fecal specimens collected at week 2 post-transplantation were numerically higher in the group induced with anti-thymocyte globulin but not statistically significant, that is P<0.05 (Table S7).
Among the 15 patients induced with anti-thymocyte globulin therapy and treated with similar perioperative antibiotics and a tacrolimus and mycophenolic acid based regimen, 11 were managed with an early corticosteroid withdrawal regimen and 4 with a chronic corticosteroid maintenance therapy based on clinical considerations. None of the 15 patients received any additional antibiotic therapy prior to the collection of the post-transplantation specimen. A comparison of the steroid-free vs. steroid maintenance group showed that the relative abundance of Clostridiales was lesser (47.8% vs. 67.2%, P= 0.19) and that of Erysipelotrichales (22.6% vs. 7.8%, P=0.70) higher in the steroid maintenance group in the fecal specimens collected at week 2 post-transplantation. These numeric differences, however, were not statistically significant (Table S8).
DISCUSSION
Our investigation of the gut microbiota by PCR amplification of the 16S rRNA V4–V5 variable region and deep sequencing using the Illumina® MiSeq platform has identified significant alterations in microbial composition following kidney transplantation and has begun to characterize perturbations associated with post-transplant diarrhea, acute rejection, and Enterococcus UTI.
Changes in the Gut Microbiota Following Transplantation
Firmicutes were the most abundant bacterial taxa in the pre and post-transplantation fecal specimens but the relative abundance of Bacteroidetes was strikingly low in our study subjects compared to healthy subjects characterized by the Human Microbiome Consortium (1). A further decrease in Bacteroidetes following transplantation was accompanied in our study by a relative increase in the abundance of Proteobacteria at the phylum level. The basis and significance of these perturbations remain unknown. However, the Proteobacteria phylum is comprised of a broad range of gram-negative bacteria and includes many known infectious pathogens (e.g. Escherichia coli, Klebsiella pneumoniae, Pseudomonas aerugonosa, Enterobacter cloacae, and Proteus Mirabalis) (9). Taur et al. reported that a fecal domination of Proteobacteria of greater than 30% was associated with a 5 fold increased risk for gram negative bacteremia (3). It is possible that an increase in Proteobacteria post transplantation could potentially contribute to the high rate of infectious complications after kidney transplantation, but further studies are needed to elucidate this possibility.
Gut Microbiota and Post Transplant Diarrhea
Diarrhea is a common and troublesome complication following kidney transplantation. Herein, we document a striking lower abundance of Bacteroidetes and Bacteroidales in those with post-transplant diarrhea. LEfSe method identified Bacteroides as well as Ruminococcus, Coprococcus, and Dorea to be significantly lower in the diarrhea cohort. These differences are unlikely to be related to post-transplant medications since the 9 patients without diarrhea received the same induction therapy, preoperative antibiotics, and PCP prophylaxis therapy as the 6 patients with diarrhea. Two additional issues are also worth noting. First, none of the 15 patients received additional antibiotic therapy prior to fecal specimen collection, and second, the fecal specimens from the patients without diarrhea and those with diarrhea were closely matched with respect to time from transplantation to specimen collection.
In a database study of 41,442 kidney transplant recipients, diarrhea affected approximately 20% of kidney transplant recipients and the most common etiology (83%) was described as “other and unspecified diarrhea” (10). While studies have utilized a targeted PCR approach to identify the etiology for post-transplant diarrhea (11, 12), such strategies test for a limited number of organisms. Our study, to the best of our knowledge, is the first to utilize 16S rRNA deep sequencing technology to characterize the microbiota associated with diarrhea post-kidney transplantation. With this global approach, we identified a novel association between the absence of Bacteroides, Ruminococcus, Coprococcus, and Dorea and post-transplant diarrhea. Bacteroides and Ruminococcus are some of the most common genera found in the human gut (1, 13, 14) and are considered to have a role in carbohydrate utilization, in degradation of non-digestible dietary carbohydrates and host carbohydrates, and in carbohydrate fermentation (13, 14). It is currently unknown how a lack of these bacteria may lead to diarrhea but may be hypothesized to include a commensal role in competing out pathological microbiota and an inability to effectively digest carbohydrates.
Reduction in mycophenolate mofetil in response to gastrointestinal disturbances like diarrhea is a common treatment strategy but has been associated with an increased risk of acute rejection and allograft loss (15, 16). Further characterization of the microbiota associated with diarrhea may allow for targeted therapies that do not involve a one-size-fits-all reduction in graft protective immunosuppressive therapies.
Gut Microbiota, Acute Rejection, and Enterococcus UTI
In small bowel transplant recipients, AR was associated with an increase in the relative abundance of Proteobacteria and a decrease in Firmicutes (2). In a study of 16 stem cell transplant recipients, increased microbial chaos as measured by the Bray-Curtis dissimilarity index was associated with graft versus host disease (17). In our study, the relative abundance of Bacteroidetes was lower in the fecal specimens collected from patients during an episode of AR compared to those without an AR. At the order level, Lactobacillales was higher in the acute rejection cohort and Clostridiales and Bacteroidales were lower. All 3 patients with an episode of AR were treated with multiple antibiotics and sequential data from 2 of 3 patients showed marked changes in gut microbial composition following antibiotic therapy. Considerable data exist that gut microbiome impacts immunity. It is possible that antibiotic administration was associated with changes in microbial composition that helped initiate anti-allograft immunity. Host immune status in response to alterations in gut microbial structure, however, was not investigated in our study.
Our pilot study further highlights a potential association between the gut microbiota and infectious complications following kidney transplantation. Specifically, relative fecal abundance of Enterococcus was significantly higher in the 3 transplant recipients with Enterococcus UTI than in the 23 transplant recipients who did not develop Enterococcus UTI. It is striking that the 23 transplant recipients who did not develop Enterococcus UTI have a very low relative abundance of Enterococcus in their fecal specimens (median:0%, IQL:0.00% to 0.08%). The association observed in this study is consistent with a study in the allogeneic hematopoietic stem cell transplant population (18). In this context, a study on 94 stem cell transplant recipients reported that Enterococcus domination increased the risk for vancomycin-resistant Enterococcus bacteremia by 9 fold (3). Our findings, viewed in the light of the data from the studies in allogeneic stem cell transplant recipients, suggest that alterations in the gut microbiota may predispose the graft recipient to the development of infectious complications.
Our study has limitations besides the small sample size. The reported statistical associations were mostly based on univariate analyses. The findings in the AR group and Enterococcus UTI group may have been confounded by different induction regimens and different antibiotic regimens. In terms of diarrhea after kidney transplantation, viral infections were not evaluated and unidentified viral infections rather than the identified bacterial organisms may be associated with diarrhea in our patients.
Our findings, if confirmed in a larger cohort of kidney graft recipients, suggests minimization of antibiotics use in the peri and post transplantation period (potentially for modulating acute rejection risk) and evaluation of therapeutic strategies for replenishing microbial diversity (potentially for preventing post transplant diarrhea).
MATERIALS AND METHODS
Subject Population
From August 2012 to January 2013, our transplant center performed 87 kidney transplants and 26 kidney transplant recipients provided at least two fecal specimens within the first 90 days of transplantation. Patients self-collected fecal specimens approximately every two weeks after transplantation during the first month and once a month during the second and third months. Demographical data and transplant characteristics were obtained for each of the transplant recipients. The study protocol was approved by the institutional review board at Weill Cornell Medical College and each patient gave informed written consent.
Fecal Specimen Collection and Analysis
Patients submitted their fecal specimens within 1 day of self-collection and the specimens were stored at −80°C. DNA was extracted using a phenol-chloroform isolation method involving bead beater disruption (18).
16S rRNA Amplification and Deep Sequencing
For each specimen, the 16S rRNA V4–V5 variable region was amplified using PCR assays and was sequenced on an Illumina® MiSeq platform according to manufacturer’s instructions. Further details are provided in the Methods (SDC).
16S rRNA Sequencing Analysis
Sequences were compiled and analyzed using mothur (19). Sequences were aligned using SILVA reference as a template (20) and were grouped into operational taxonomic units (OTUs) using the average neighbor algorithm and on the basis of 97 percent or greater similarity. Further details involving the processing and alignment of sequences are provided in the Methods (SDC).
Post-Transplant Complications
Post-transplant diarrhea was defined as a subjective complaint of diarrhea and three or more bowel movements for two or more consecutive days. Clinical acute rejections were confirmed by for-cause allograft biopsies that were categorized using the Banff 97 schema (21). UTI was defined as a positive urine culture (≥50,000 colony forming units/mL).
Statistical Analyses
Shannon diversity index for each sample was measured using mothur. A phylogenetic tree was constructed based on the 16S sequence alignment using clearcut in mothur (19, 22). Unweighted UniFrac was run using the resulting tree and principal coordinate analysis was performed on the resulting matrix (7). The linear discriminant analysis effect size (LEfSe) method was utilized to compare significant differences in taxa between groups (8). Wilcoxon signed-rank test and Wilcoxon rank-sum test were used to compare groups of paired samples and unpaired samples, respectively, and were performed using STATA 12.0 I/C (Statacorp, College Station, TX).
Supplementary Material
Acknowledgments
Funding Sources:
J.L. is a recipient of a KL2 Scholars Award from the Weill Cornell Clinical and Translational Science Center. T.M. is a recipient of a career development K08-DK087824 from the National Institutes of Diabetic and Digestive and Kidney Diseases, National Institutes of Health. MS is a recipient of the NIH MERIT Award R37AI051652 from the National Institute of Allergy and Infectious Diseases, National Institutes of Health. This publication has been supported, in part, by the KL2-TR000458 award from the National Center for Advancing Translational Sciences, National Institutes of Health, through the Weill Cornell Clinical and Translational Science Center.
We thank our colleagues at the Division of Nephrology and Hypertension, Division of Transplant Surgery, and Department of Transplantation Medicine at New York Presbyterian-Weill Cornell Medical Center and our colleagues at the Division of Infectious Diseases at Memorial Sloan Kettering Cancer Center. We thank the 2N nursing staff and our patients at New York Presbyterian Hospital – Weill Cornell Medical Center and the Rogosin Institute for their kind help in conducting this study.
Footnotes
Author Contributions:
J.L.: research design, data analyses, and writing of the manuscript
T.M.: research design and writing of the manuscript
D.D.: research design and writing of the manuscript
N.T.: data analyses
L.L.: data analyses and writing of the manuscript
E.P.: research design, data analyses, and writing of the manuscript
M.S.: research design, data analyses, and writing of the manuscript
Conflicts of Interest:
The authors declare no conflict of interest.
References
- 1.Human Microbiome Consortium. Structure, function and diversity of the healthy human microbiome. Nature. 2012;486 (7402):207. doi: 10.1038/nature11234. [DOI] [PMC free article] [PubMed] [Google Scholar]
- 2.Oh PL, Martinez I, Sun Y, Walter J, Peterson DA, Mercer DF. Characterization of the ileal microbiota in rejecting and nonrejecting recipients of small bowel transplants. Am J Transplant. 2012;12 (3):753. doi: 10.1111/j.1600-6143.2011.03860.x. [DOI] [PubMed] [Google Scholar]
- 3.Taur Y, Xavier JB, Lipuma L, et al. Intestinal domination and the risk of bacteremia in patients undergoing allogeneic hematopoietic stem cell transplantation. Clin Infect Dis. 2012;55 (7):905. doi: 10.1093/cid/cis580. [DOI] [PMC free article] [PubMed] [Google Scholar]
- 4.Vaziri ND, Wong J, Pahl M, et al. Chronic kidney disease alters intestinal microbial flora. Kidney Int. 2013;83 (2):308. doi: 10.1038/ki.2012.345. [DOI] [PubMed] [Google Scholar]
- 5.Magurran AE. Biological diversity. Curr Biol. 2005;15 (4):R116. doi: 10.1016/j.cub.2005.02.006. [DOI] [PubMed] [Google Scholar]
- 6.Prideaux L, Kang S, Wagner J, et al. Impact of ethnicity, geography, and disease on the microbiota in health and inflammatory bowel disease. Inflamm Bowel Dis. 2013;19 (13):2906. doi: 10.1097/01.MIB.0000435759.05577.12. [DOI] [PubMed] [Google Scholar]
- 7.Lozupone C, Knight R. UniFrac: a new phylogenetic method for comparing microbial communities. Appl Environ Microbiol. 2005;71 (12):8228. doi: 10.1128/AEM.71.12.8228-8235.2005. [DOI] [PMC free article] [PubMed] [Google Scholar]
- 8.Segata N, Izard J, Waldron L, et al. Metagenomic biomarker discovery and explanation. Genome Biol. 2011;12 (6):R60. doi: 10.1186/gb-2011-12-6-r60. [DOI] [PMC free article] [PubMed] [Google Scholar]
- 9.Don Brenner NK, Staley James. Bergey’s Manual of Systematic Bacteriology. Springer US; 2005. [Google Scholar]
- 10.Bunnapradist S, Neri L, Wong W, et al. Incidence and risk factors for diarrhea following kidney transplantation and association with graft loss and mortality. Am J Kidney Dis. 2008;51 (3):478. doi: 10.1053/j.ajkd.2007.11.013. [DOI] [PubMed] [Google Scholar]
- 11.Coste JF, Vuiblet V, Moustapha B, et al. Microbiological diagnosis of severe diarrhea in kidney transplant recipients by use of multiplex PCR assays. J Clin Microbiol. 2013;51 (6):1841. doi: 10.1128/JCM.03366-12. [DOI] [PMC free article] [PubMed] [Google Scholar]
- 12.Arslan H, Inci EK, Azap OK, Karakayali H, Torgay A, Haberal M. Etiologic agents of diarrhea in solid organ recipients. Transpl Infect Dis. 2007;9 (4):270. doi: 10.1111/j.1399-3062.2007.00237.x. [DOI] [PubMed] [Google Scholar]
- 13.Ramakrishna BS. Role of the gut microbiota in human nutrition and metabolism. J Gastroenterol Hepatol. 2013;28 (Suppl 4):9. doi: 10.1111/jgh.12294. [DOI] [PubMed] [Google Scholar]
- 14.Wexler HM. Bacteroides: the good, the bad, and the nitty-gritty. Clin Microbiol Rev. 2007;20 (4):593. doi: 10.1128/CMR.00008-07. [DOI] [PMC free article] [PubMed] [Google Scholar]
- 15.Bunnapradist S, Lentine KL, Burroughs TE, et al. Mycophenolate mofetil dose reductions and discontinuations after gastrointestinal complications are associated with renal transplant graft failure. Transplantation. 2006;82 (1):102. doi: 10.1097/01.tp.0000225760.09969.1f. [DOI] [PubMed] [Google Scholar]
- 16.Knoll GA, MacDonald I, Khan A, Van Walraven C. Mycophenolate mofetil dose reduction and the risk of acute rejection after renal transplantation. J Am Soc Nephrol. 2003;14 (9):2381. doi: 10.1097/01.asn.0000079616.71891.f5. [DOI] [PubMed] [Google Scholar]
- 17.Jenq RR, Ubeda C, Taur Y, et al. Regulation of intestinal inflammation by microbiota following allogeneic bone marrow transplantation. J Exp Med. 2012;209 (5):903. doi: 10.1084/jem.20112408. [DOI] [PMC free article] [PubMed] [Google Scholar]
- 18.Ubeda C, Taur Y, Jenq RR, et al. Vancomycin-resistant Enterococcus domination of intestinal microbiota is enabled by antibiotic treatment in mice and precedes bloodstream invasion in humans. J Clin Invest. 2010;120 (12):4332. doi: 10.1172/JCI43918. [DOI] [PMC free article] [PubMed] [Google Scholar]
- 19.Schloss PD, Westcott SL, Ryabin T, et al. Introducing mothur: open-source, platform-independent, community-supported software for describing and comparing microbial communities. Appl Environ Microbiol. 2009;75 (23):7537. doi: 10.1128/AEM.01541-09. [DOI] [PMC free article] [PubMed] [Google Scholar]
- 20.Pruesse E, Quast C, Knittel K, et al. SILVA: a comprehensive online resource for quality checked and aligned ribosomal RNA sequence data compatible with ARB. Nucleic Acids Res. 2007;35 (21):7188. doi: 10.1093/nar/gkm864. [DOI] [PMC free article] [PubMed] [Google Scholar]
- 21.Racusen LC, Colvin RB, Solez K, et al. Antibody-mediated rejection criteria - an addition to the Banff 97 classification of renal allograft rejection. Am J Transplant. 2003;3 (6):708. doi: 10.1034/j.1600-6143.2003.00072.x. [DOI] [PubMed] [Google Scholar]
- 22.Sheneman L, Evans J, Foster JA. Clearcut: a fast implementation of relaxed neighbor joining. Bioinformatics. 2006;22 (22):2823. doi: 10.1093/bioinformatics/btl478. [DOI] [PubMed] [Google Scholar]
Associated Data
This section collects any data citations, data availability statements, or supplementary materials included in this article.