Abstract
The obesity epidemic is believed to be driven by a food environment that promotes consumption of inexpensive, convenient, high-calorie, palatable foods. Individual differences in obesity susceptibility or resistance to weight loss may arise due to alterations in the neurocircuitry supporting food reward and eating habits. In particular, dopamine signaling in the ventromedial striatum is thought to encode food reward and motivation, whereas dopamine in the dorsal and lateral striatum orchestrates the development of eating habits. We measured striatal dopamine D2-like receptor binding potential (D2BP) using positron emission tomography (PET) with [18F]fallypride in 43 human subjects with body mass indices (BMI) ranging from 18–45 kg/m2. Opportunistic eating behavior and BMI were both positively associated with D2BP in the dorsal and lateral striatum, whereas BMI was negatively associated with D2BP in the ventromedial striatum. These results suggest that obese people have alterations in dopamine neurocircuitry that may increase their susceptibility to opportunistic overeating while at the same time making food intake less rewarding, less goal-directed, and more habitual. Whether or not the observed neurocircuitry alterations pre-existed or occurred as a result of obesity development, they may perpetuate obesity given the omnipresence of palatable foods and their associated cues.
Introduction
The rise in global obesity prevalence over the past several decades is believed to have been driven primarily by changes in the food environment that promote consumption of inexpensive, convenient, high-calorie foods (1). Palatable food cues and eating opportunities have become practically omnipresent, with some individuals being more susceptible than others to overeat and become obese. Indeed, habitual susceptibility to opportunistic eating has been associated with obesity and forms the core component of a behavioral trait called disinhibition or opportunistic eating (2, 3).
Inter-individual variation of dopamine neurocircuitry may contribute to opportunistic eating and obesity since dopamine plays a central role in orchestrating the complex sequence of learning food-reward associations, action-outcomes, and forming automated habitual behaviors. In animal models, dopamine signaling in the dorsal and lateral striatum mediate habit formation (4–7) and dopamine accelerates the development of habit formation from previously goal-directed behaviors (8). Furthermore, suppressing dopamine signaling specifically in the dorsolateral striatum prevents or reverses habit formation (9–11). Therefore, if obesity is associated with habitual opportunistic overeating, one would expect a positive association with dopamine signaling in the dorsal and lateral striatum including regions of the caudate and putamen.
Another mechanism by which dopamine signaling may be altered in obesity involves hypo-function of dopamine-mediated reward signaling (12). Under this mechanism, one would expect a negative association between obesity and dopamine signaling in the ventromedial striatum, and particularly in the nucleus accumbens, which mediates appetitive conditioning and motivation (13).
Therefore, we hypothesized that dopamine D2-like receptor binding potential (D2BP) in the dorsal and lateral striatum would be positively associated with obesity and opportunistic eating behavior whereas D2BP in the ventromedial striatum would be negatively associated with obesity. We investigated D2BP in 43 adults, 20 who were obese with body mass indices (BMI) ≥ 30 kg/m2 (Table 1), whose prior day’s food intake was strictly controlled to ensure energy balance while they were admitted to a metabolic ward. Positron emission tomography (PET) scans were conducted 2 hours following a standard breakfast and immediately following a bolus intravenous infusion of the D2-like receptor radiotracer [18F]fallypride.
Table 1.
Characteristics of obese and non-obese subjects and the dopamine D2-like receptor binding potential (D2BP) in striatal regions of interest: caudate, putamen, and accumbens area. Opportunistic Eating was measured in 17 subjects from each group; Insulin Resistance was measured in 20 non-obese and 13 obese subjects. Mean (95% CI)
| Non-obese BMI < 30 kg/m2 |
Obese BMI ≥ 30 kg/m2 |
p-value | p-value (age adjusted) |
|
|---|---|---|---|---|
| N | 23 | 20 | ||
| Sex (M/F) | 12/11 | 10/10 | ||
| Age (years) | 28 (25.1, 30.4) | 35 (31.9, 38.8) | 0.0008 | |
| Weight (kg) | 67.5 (62.03, 73.96) | 107.4 (99.80, 114.9) | <.0001 | <.0001 |
| BMI (kg/m2) | 22.4 (21.30, 23.49) | 36.1 (33.96, 38.30) | <.0001 | <.0001 |
| Body Fat (%) | 23.2 (19.77, 26.69) | 40.0 (35.94, 44.03) | <.0001 | <.0001 |
| Fat Mass (kg) | 15.7 (12.78, 18.72) | 43.0 (37.50, 48.57) | <.0001 | <0.001 |
| Caudate D2BP | 24.9 (22.95, 26.92) | 28.2 (26.48, 29.86) | 0.014 | 0.0323 |
| Putamen D2BP | 27.0 (25.14, 28.93) | 30.7 (28.61, 32.70) | 0.0099 | 0.0056 |
| Accumbens D2BP | 16.7 (14.16, 19.29) | 18.3 (16.60, 19.94) | 0.30 | 0.37 |
| Opportunistic Eating | 3.9 (2.95, 4.93) | 6.8 (5.38, 8.27) | 0.0016 | 0.0022 |
| Insulin Resistance (HOMA-IR) | 1.5 (1.13, 1.96) | 3.1 (2.0, 4.17) | 0.01 | 0.0053 |
Methods
Subjects
Non-smoking subjects between 18–45 years of age were recruited and screened to exclude those with diabetes, recent weight change, past or present history of drug abuse, neurological, or psychiatric disorders (including eating disorders such as binge eating) as assessed by an abbreviated Structured Clinical Interview for the Diagnostic and Statistical Manual of Mental Disorders. Women were studied in the follicular phase and were excluded if they were pregnant, breastfeeding, or post-menopausal. Twenty-two men and twenty-one women provided informed consent to participate in a study approved by the NIDDK Institutional Review Board (NCT00846040) and were admitted to the NIH Clinical Center where they had body fat measured by dual energy x-ray absorptiometry (Lunar iDXA, GE Healthcare, Madison, WI). Thirty four subjects completed the Three-Factor Eating Questionnaire (TFEQ) (14) and thirty-three had fasting blood draws for measurement of insulin resistance which was calculated using the homeostasis model assessment of insulin resistance (HOMA-IR) (15). The TFEQ disinhibition score was renamed “opportunistic eating” as recently suggested (3) to better reflect the characteristics of this eating behavior whose core component has been identified as “habitual susceptibility” but also involves components of “emotional susceptibility” and “situational susceptibility” (2). All subjects were provided with an energy-balanced diet and consumed all meals as inpatients on the metabolic ward for at least one day prior to measuring D2BP.
Positron Emission Tomography
A morning PET scan (HRRT, Siemens Healthcare, Malvern, PA) began 2 hours after a standard breakfast comprising 20% of each subject’s daily caloric needs as measured by indirect calorimetry. A bolus of 5 mCi of [18F]fallypride was infused intravenously using a Harvard® pump. The specific activity was approximately 2000 mCi/µmol at time of injection and the radiochemical purity of the radiotracer was > 99%. The PET scan was carried out for 3.5 hours in three sessions separated by two 10 minute breaks. Thirty three volumes were acquired at times 0, 0.25, 0.5, 0.75, 1, 1.25, 1.5, 1.75, 2, 2.5, 3, 3.5, 4, 4.5 , 5, 6, 7, 8, 9, 10, 12.5, 15, 20, 25, 30, 40, 50, 60, 90, 110, 130, 170, 200 min. During each scan session, the room was quiet and dimly lit and each subject was instructed to keep their head as still as possible, relax, and try to avoid falling asleep. The image reconstruction process corrected for head motion which was tracked throughout each scan.
Each scan consisted of 207 slices (slice separation = 1.22 mm). The fields of view were 31.2 cm and 25.2 cm for transverse and axial slices, respectively. A transmission scan was obtained with a 137Cs rotating pin source before radiotracer injection and before the emission scan to correct for attenuation. The PET images were aligned within each scan session with 6-parameter rigid registration using 7th order polynomial interpolation and each session was aligned to the volume taken at 20 min of the first session. The final alignments were visually checked, with translations varying by <2 mm and the rotations by <2 degrees.
Magnetic Resonance Imaging
The day prior to PET scanning, high resolution anatomical MRI images were acquired with a HDx General Electric 3 Tesla scanner (TE = 2.7ms, TR 7.24 ms, flip angle 12°, voxel size 0.937*0.937*1.2mm) for each subject. The aligned PET images were coregistered to the anatomical MRI by minimizing a mutual information cost function for each individual subject. The final coregistration was visually checked. The anatomical MRI images were parcellated with FreeSurfer software to obtain region of interest (ROI) binary mask volumes for each subject in the putamen and caudate, accumbens area, and the whole cerebellum as a reference region. All individual ROI masks were visually checked and, if necessary, edited.
Statistical Analyses
The time-activity curves for [18F]fallypride concentration in the ROIs were extracted and kinetic parameters were fit to a four-compartment model (with the cerebellum used as the reference tissue) to determine the D2BP (16). In voxel-wise analysis, the anatomical MRI images were transformed into the Talairach space. The transformation matrix was then applied to the PET images which were also smoothed with a 5-mm of full-width half-max Gaussian kernel. The individual subject’s D2BP maps were included in a regression analysis in AFNI’s 3dttest++ to identify clusters where D2BP across subjects were correlated with adiposity, opportunistic eating, and insulin resistance. Since high D2BP occurs mainly in striatum, small volume corrections were implemented within each hemisphere where D2BP >1.5. A two-sided voxel-wise threshold of p < 0.1 was used, and cluster size threshold to achieve correction for multiple comparisons at p<0.05 was implemented via Monte Carlo simulations in AFNI’s 3dClustSim.
To compare our results with those of previous investigators, we performed ROI analyses and used two-sided t-tests were used to compare the mean D2BP within each ROI between the obese and non-obese groups. Pearson correlation coefficients were calculated to test for associations between D2BP within each ROI and body fat and opportunistic eating scores. Statistical analyses were performed using SAS Statistical Software (version 9.3, Cary, MC).
Results
Striatal correlation patterns of D2BP with adiposity
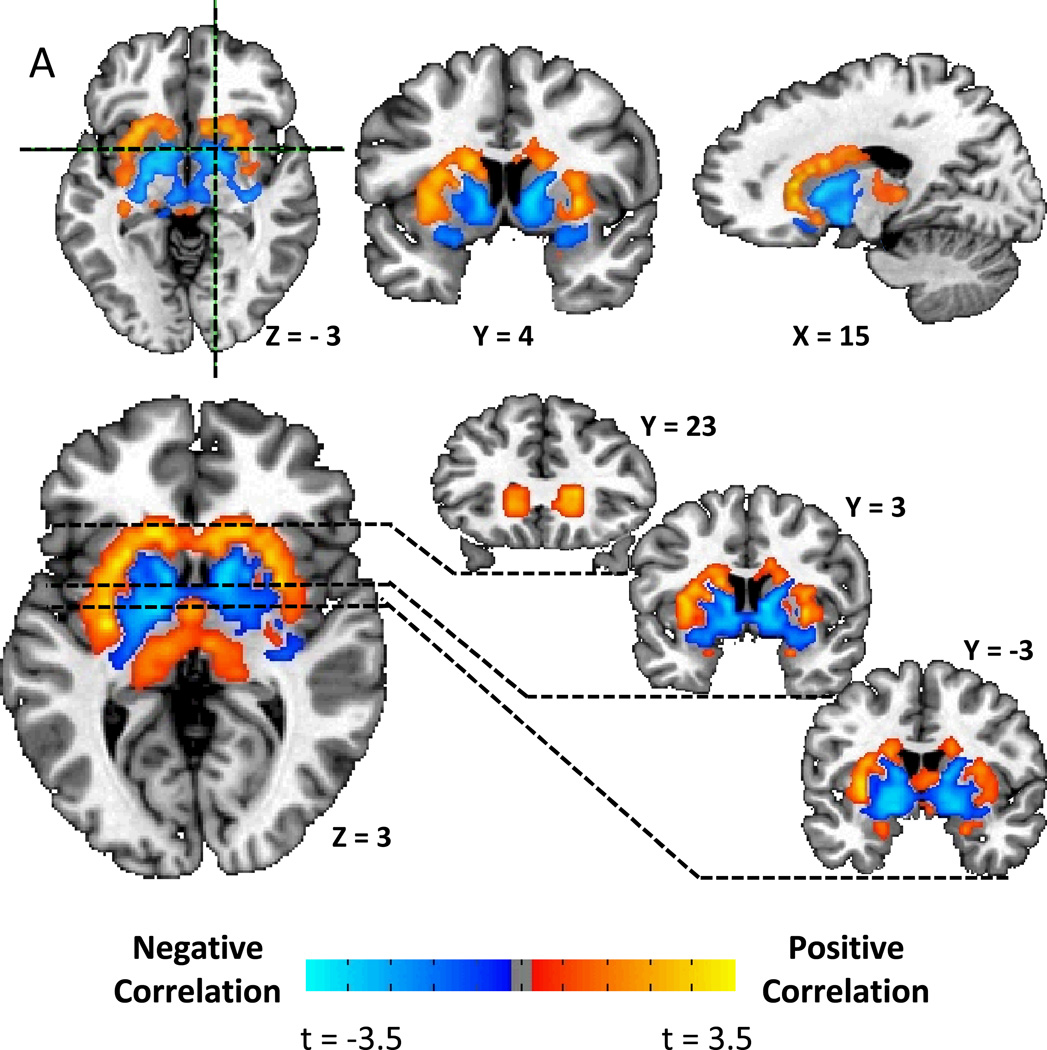
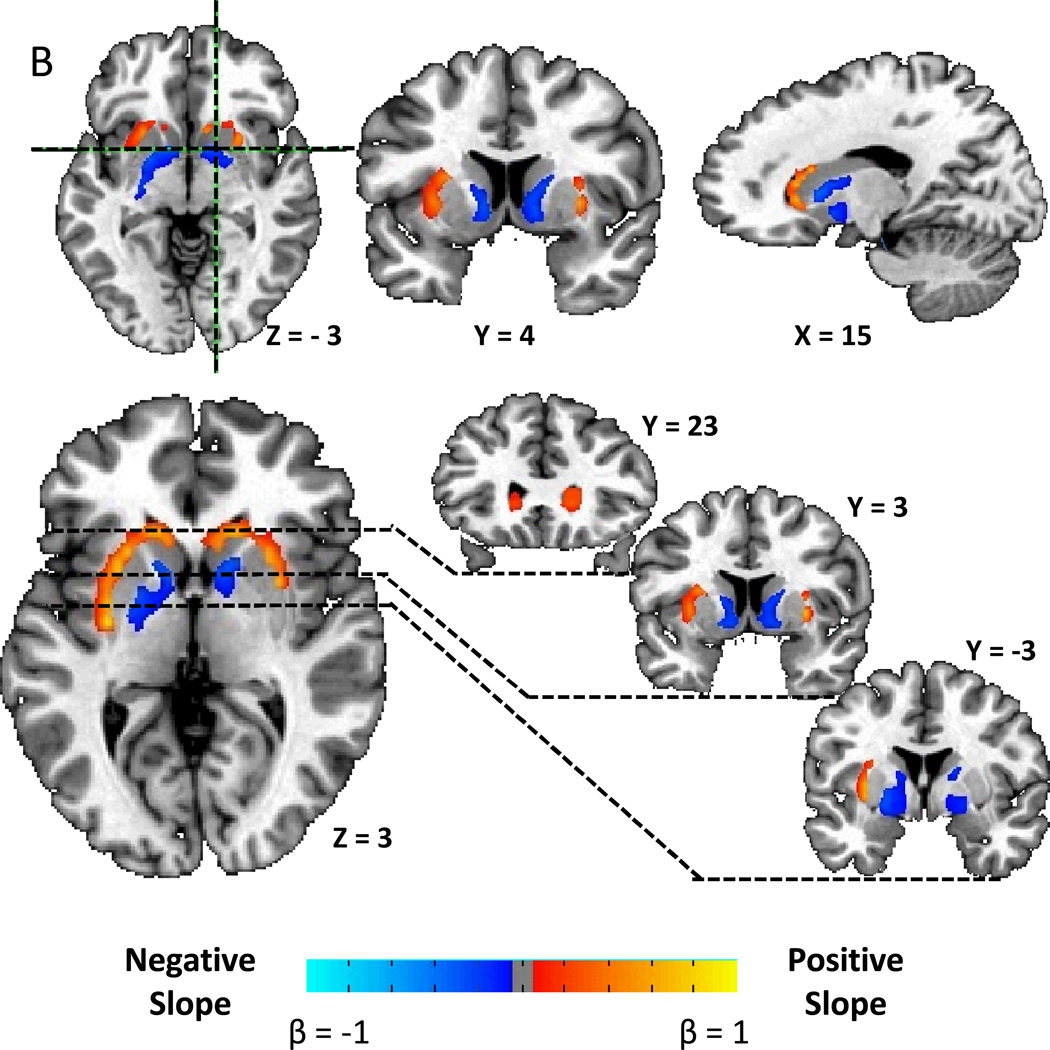
We found a striking correlation pattern between striatal D2BP and BMI, with positive associations in the dorsal and lateral striatum and negative associations in the ventromedial striatum (Fig. 1A). After correcting for multiple comparisons, Figure 1B shows that there were positively associated clusters stretching bilaterally from the head of the caudate, posteriorly through the lateral putamen to the level of the anterior commissure on the right, and approximately 1.5 cm posterior to the anterior commissure in the left hemisphere (Table 2). Bilateral negatively associated clusters were found stretching posteriorly from the medial wall of the caudate posteriorly through the ventral striatum, the ventral pallidum, and into the globus pallidus.
Figure 1.
A) Striatal correlation pattern of dopamine D2-like receptor binding potential (D2BP) with body mass index (BMI) as represented by t-maps showing positive correlations in dorsal and lateral striatum and negative correlations in ventromedial striatum. B) Striatal associations between D2BP and BMI as represented by β-maps within significant clusters after correcting for multiple comparisons.
Table 2.
Locations of significantly correlated D2BP clusters after correction for multiple comparisons. The coordinates in Talairach and Tournoux space indicate the location within each cluster of the peak t-statistic whose value is also indicated along with the average value of the β coefficient across each cluster.
| Location of Peak t | Peak t | Average β |
cluster size mm3 |
||||
|---|---|---|---|---|---|---|---|
| x | y | z | |||||
|
D2BP correlation with BMI (N=43) | |||||||
| left | putamen | −29.8 | −11.5 | 3 | 4.0 | 0.305 | 5788 |
| left | globus pallidus | −22.8 | −8 | 6.5 | −2.0 | −0.139 | 4373 |
| right | putamen | 29.8 | 2.5 | 3 | 3.5 | 0.343 | 4159 |
| right | caudate | 15.8 | 9.5 | 6.5 | −3.1 | −0.136 | 4073 |
|
D2BP correlation with Opportunistic Eating (N=34) | |||||||
| right | putamen | 22.8 | 13 | −4 | 2.5 | 0.539 | 2701 |
| left | putamen | −22.8 | 13 | −0.5 | 2.1 | 0.686 | 2573 |
|
D2BP correlation with BMI (age adjusted) (N=43) | |||||||
| right | caudate | 8.8 | 9.5 | 13.5 | 3.5 | 0.348 | 2530 |
| left | putamen | −29.8 | −11.5 | 3 | 3.7 | 0.333 | 2358 |
| left | globus pallidus | −19.2 | −1 | −4 | −2.0 | −0.109 | 2315 |
|
D2BP correlation with Opportunistic Eating (age adjusted) (N=34) | |||||||
| right | putamen | 22.8 | 13 | −4 | 2.7 | 0.613 | 6689 |
While the obese subjects were significantly older and more insulin resistant (Table 1), age was not significantly correlated with HOMA-IR (r=0.19, p=0.3) or BMI (r=0.29, p=0.06). Furthermore, our results regarding D2BP correlations with BMI, body fat and insulin resistance were similar with or without adjusting for age which was not significantly correlated with D2BP in our relatively young cohort (Supplementary Figs. 1–6).
Striatal correlation patterns of D2BP with opportunistic eating
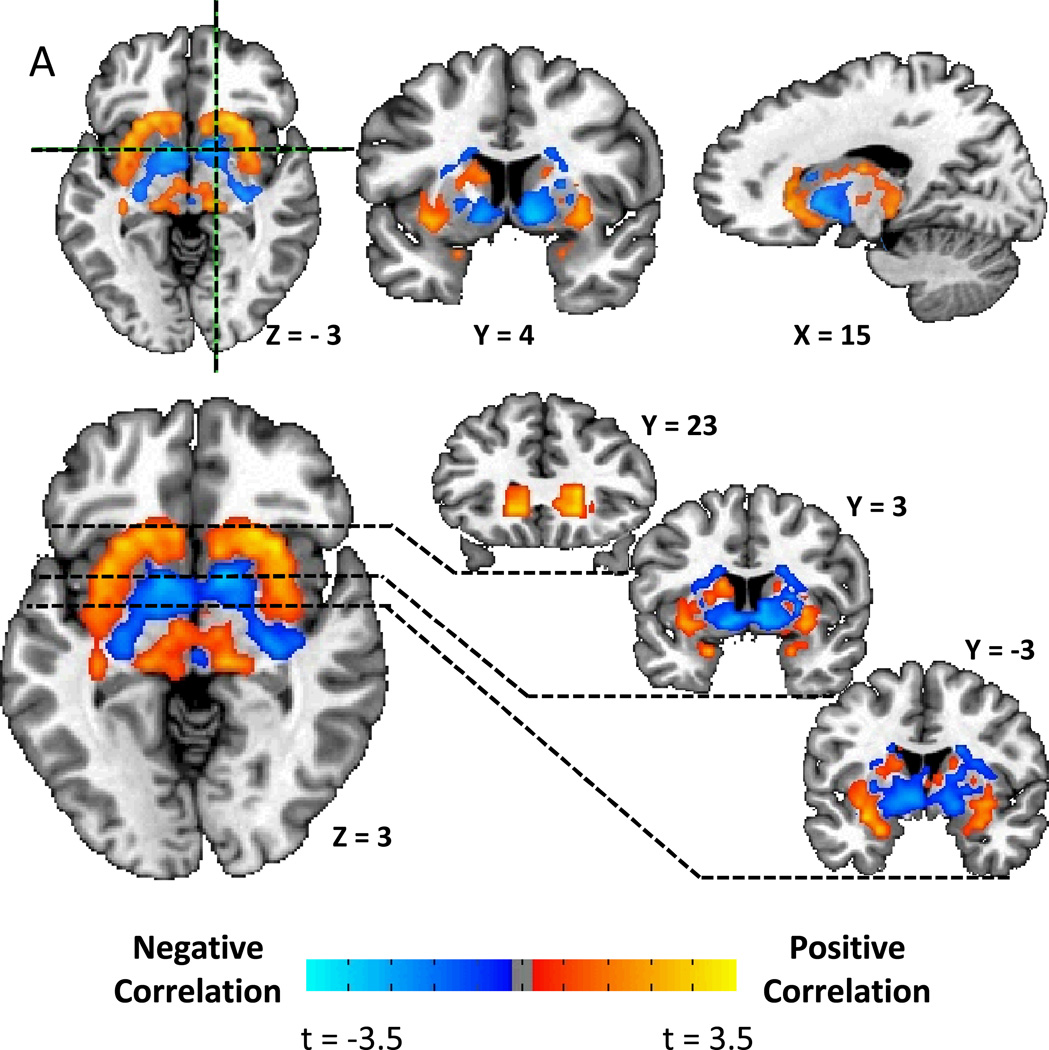
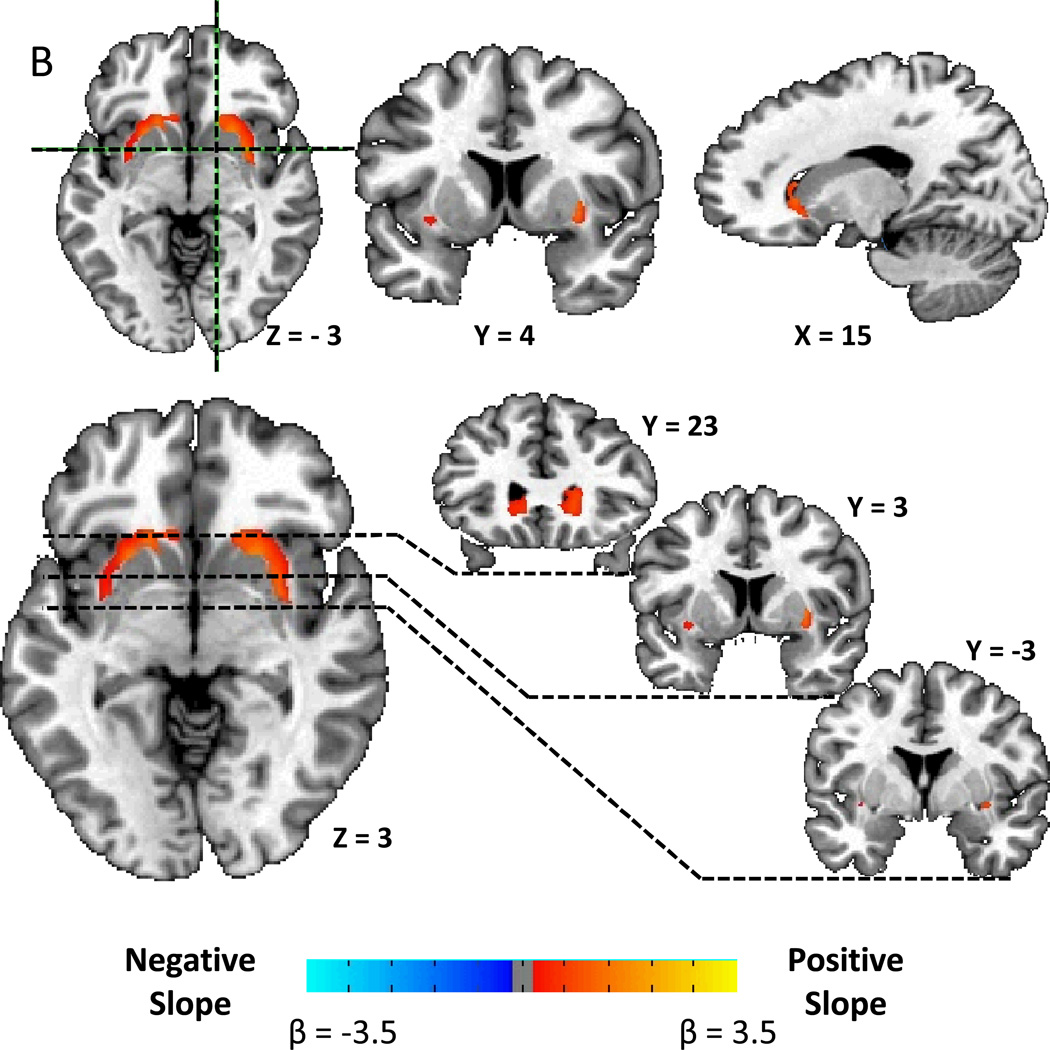
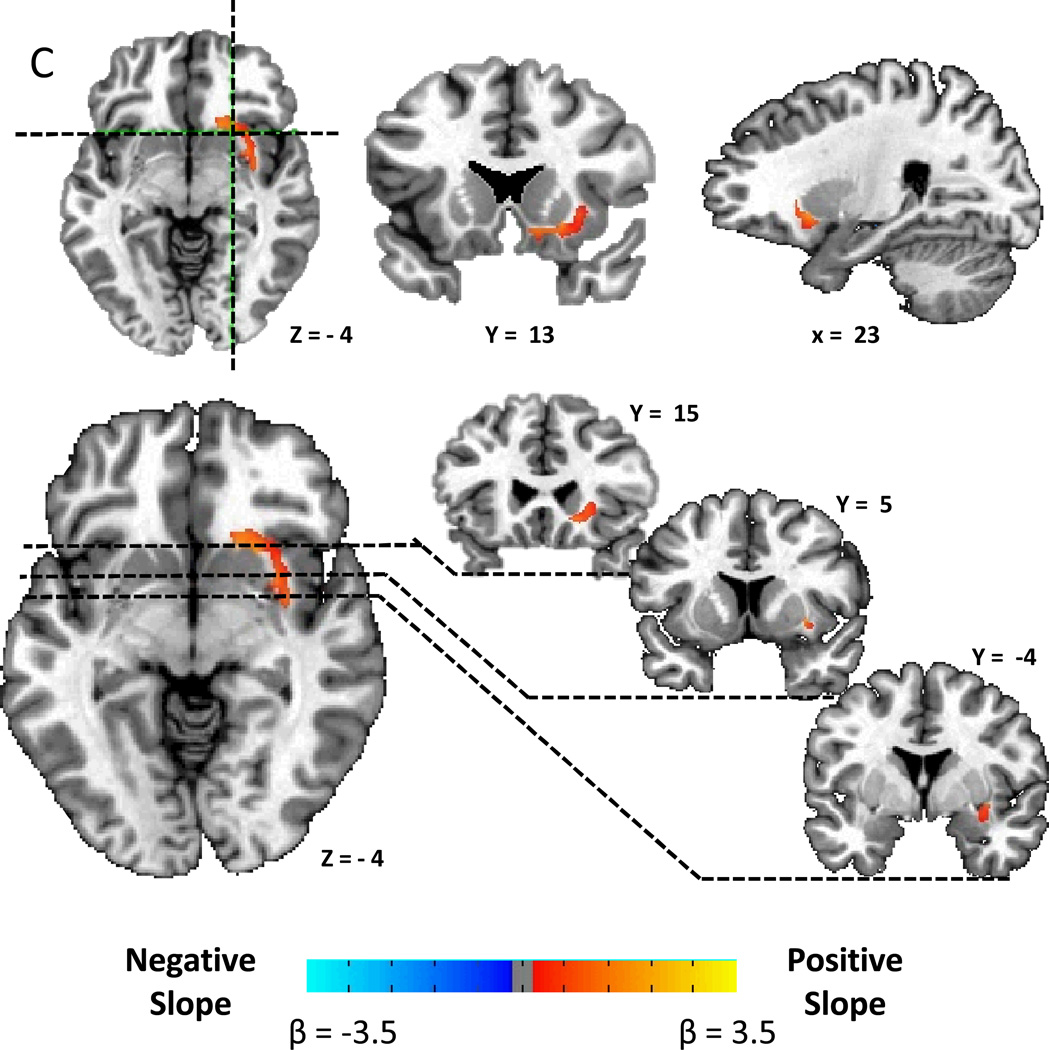
Figure 2A shows that the correlation pattern between D2BP and opportunistic eating behavior was remarkably similar to the BMI pattern. After correcting for multiple comparisons, Figure 2B shows that D2BP was positively associated with opportunistic eating in two bilateral clusters stretching posteriorly from the head of the caudate, back through the lateral putamen to approximately 5 mm posterior to the anterior commissure (Table 2). After correcting for BMI, the right cluster survived correction for multiple comparisons (Fig. 2C) suggesting that the relationship between opportunistic eating and D2BP in the lateral striatum was not driven solely by its positive correlation with BMI (r=0.59, p=0.0002).
Figure 2.
A) Striatal correlation pattern of D2BP with opportunistic eating behavior as represented by t-maps showing positive correlations in the lateral striatum and negative correlations in the ventromedial striatum. B) Positive associations between D2BP with opportunistic eating behavior as represented by β-maps within significant clusters in the lateral striatum after correcting for multiple comparisons. C) Positive association between D2BP and opportunistic eating behavior corrected for BMI as represented by β-maps in significant clusters after correcting for multiple comparisons.
Caudate and Putamen D2BP are positively correlated with adiposity
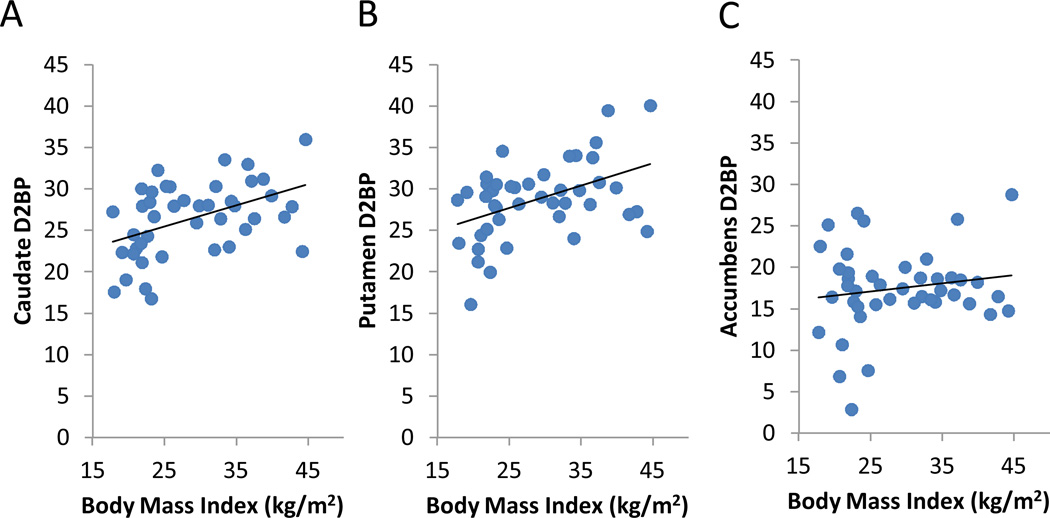
In the ROI analyses, we found that BMI was significantly positively associated with D2BP in the caudate and putamen (Fig. 3A and 3B) (caudate: r=0.45, p=0.002, β=0.26 m2/kg; putamen: r=0.45, p=0.002, β=0.27 m2/kg), but not in the accumbens area (Fig. 3C) (r=8×10⁻⁹, p=0.3, β=0.099 m2/kg). We found similar results when using body fat as the adiposity index (Supplementary Fig. 7). However, no significant D2BP correlations were observed in any ROI with respect to opportunistic eating, age, or sex.
Figure 3.
Correlations between dopamine D2-like receptor binding potential (D2BP) and BMI within striatal regions of interest. Positive correlations were found in (A) caudate, and (B) putamen, but not in (C) the accumbens area.
The obese subjects had significantly increased D2BP in the caudate and putamen, but no significant difference was found in the accumbens region (Table 1). While the obese subjects were significantly older, we found and the D2BP differences in the caudate and putamen between obese and non-obese remained after adjusting for age. Insulin resistance was significantly higher in the obese subjects and was positively correlated with BMI (r=0.69, p<0.0001).
Discussion
Human eating behavior is highly complex and a myriad of factors influence food intake (17, 18). Several times every day, we decide when, where, what, with whom, and how much to eat. Many of these eating decisions are likely habitual and were formed through repeated actions that were previously goal-directed. Opportunistic eating has been associated with obesity, reduced efficacy of weight loss interventions, and subsequent weight regain (3). Our results demonstrated that opportunistic eating and obesity were positively associated with D2BP in the lateral striatum, a region that supports habit formation (4–7). Therefore, variations in dopamine neurocircuitry in the lateral striatum may play a role in the development of obesity by potentiating an individual’s habitual susceptibility to opportunistically overeat in an obesigenic food environment.
Another hypothesized role for dopamine in obesity centers on the theory of reward hypo-function where obese individuals overeat to compensate for attenuated reward signaling (12). Our results also offer some support for this theory since the ventromedial striatum, and the nucleus accumbens in particular, is thought to support appetitive conditioning and motivation (13). Thus, the observed negatively correlated regions between D2BP and BMI in the ventromedial striatum may reflect reward hypo-function or decreased motivation which is a feature in common with addiction (19). While we failed to observe a statistically-significant correlation within the accumbens ROI mask, this may have been due to the fact that parts of the accumbens straddle a transition zone between regions of strong negative and positive association between D2BP and adiposity (Supplementary Fig. 8). In fact, voxel-wise analyses revealed that D2BP was significantly negatively correlated with BMI in regions within the ventromedial striatum, including portions of the accumbens (Fig. 1).
Previous studies investigating associations between striatal D2BP and BMI have produced variable results, with some investigators finding no significant D2BP differences in striatal regions of interest between obese and non-obese subjects (20–22), while others found positive 20, 21 or negative (12, 23, 24) associations with BMI. Our results may help account for these variable previous findings since we demonstrated distinct striatal regions where D2BP was positively or negatively associated with obesity. Past studies that averaged within anatomically defined striatal regions of interest may have included variable contributions from regions that positively and negatively correlate with BMI (Supplementary Fig. 8).
Whereas our subjects exhibited a continuous BMI range from lean to class III obesity, previous studies sometimes had large gaps in the BMI distribution which complicates the interpretation of correlation analyses. In particular, the classic study of Wang et al. (12) found no relationship between D2BP and BMI in 10 subjects with BMI < 30 kg/m2, but demonstrated a significant negative association between striatal D2BP and BMI in 10 class III obese individuals, 9 of which had BMI values in excess of 45 kg/m2 which was greater than all subjects in the current study. Therefore, we cannot rule out a different D2BP correlation pattern in very obese subjects.
Previous studies whose results were in apparent contrast to the current study (12, 20, 21, 23, 24) also used different radiotracers that vary in their affinity to dopamine D2-like receptors. The fallypride tracer used in the present study binds with higher affinity than raclopride and is less sensitive to competition with endogenous dopamine that may be influenced by prior meal consumption (25) which was often uncontrolled in previous raclopride studies investigating obesity (12, 23). Caravaggio et al. (20) recently found positive D2BP associations with BMI in the ventral striatum but no significant associations in the caudate or putamen using the dopamine receptor agonist tracer PHNO, which is highly selective for D3 over D2 receptors and even more susceptible to competition with endogenous dopamine than raclopride (26). While the use of different tracers may help explain the discrepancies, it is important to note that Carravaggio et al. studied a comparatively narrow BMI range that did not include obese subjects whereas the present study investigated a continuous range of subjects from the lower end of normal weight through class III obesity., . Finally, Eisenstein et al. (21) found no relationship between striatal D2BP and obesity when using the dopamine receptor antagonist tracer N-methyl benperidol which has greater specificity for dopamine D2 over D3 receptors and is not displaceable by endogenous dopamine. Thus, variability within the D2-like receptor family may contribute to different conclusions about the role of D2BP and obesity.
A fundamental limitation of PET is that differences in D2BP might be interpreted as resulting from changes in endogenous dopamine in competition with the radiotracer for receptor binding. While this is an important methodological limitation, we believe that our results cannot be explained by putative differences in baseline endogenous dopamine. Pharmacological depletion of baseline endogenous dopamine in humans increases striatal D2BP by only about 10% (27) suggesting that 10% of dopamine D2-like receptors are occupied by endogenous dopamine at baseline, with 90% available to bind with tracer. Subsequent stimulation of endogenous dopamine can therefore displace a large fraction of the tracer and result in a substantial decrease in D2BP. However, given a constant receptor number, D2BP can only increase from baseline if endogenous dopamine is decreased and this is limited by the baseline 10% fraction of the receptors occupied by endogenous dopamine. However, we observed >10% increase in caudate and putamen mean baseline D2BP between obese and non-obese subjects (Table 1) and an approximately 30% increase in baseline caudate and putamen D2BP from the lowest to highest degree of adiposity (Figure 3). Furthermore, we used the high-affinity dopamine D2-like receptor antagonist fallypride which is known to be less sensitive to competition with endogenous dopamine than the more common raclopride tracer (28). Therefore, we interpreted the observed striatal variations in D2BP with obesity as reflecting regional differences in dopamine signaling potential.
Another limitation of our study is that it is cross-sectional and therefore cannot demonstrate causality. There are likely many pathways to obesity, including a sedentary lifestyle as well as variations in the neurocircuitry responsible for homeostatic food intake regulation. While the observed alterations of dopamine signaling potential may have predisposed individuals to obesity, it is also conceivable that these variations in striatal D2BP were adaptations to prolonged increased availability and consumption of food. Indeed, the reduced D2BP in the ventromedial striatum could be interpreted as an adaptive down-regulation of dopamine receptors as a consequence of repeated exposure to palatable foods (29, 30). Furthermore, it is possible that dopamine receptor expression in the dorsolateral striatum was up-regulated due to a possible reduction in endogenous dopamine signaling in this region which is also involved in reward evaluation (25). Longitudinal studies of striatal D2BP dynamics are required to identify their relationship to various pathways of obesity progression.
We have highlighted the potential role of dopamine signaling in the processes of habit formation in the dorsolateral striatum and reward evaluation and motivation in the ventromedial striatum. However, it is important to emphasize that a direct linkage of these psychological processes to eating behavior and obesity has not been demonstrated in this study and these striatal regions likely support additional processes outside habit formation, reward and motivation. Nevertheless, the most straightforward interpretation of our results is that food intake becomes less rewarding, less goal-directed, and more habitual with the development and/or persistence of obesity.
Supplementary Material
Acknowledgements
We thank Kaiping Burrows, Valerie Darcy, Christine Hunter, John Ingeholm, Bernard V. Miller, Monica Skarulis, and Nora Volkow for their assistance with the study. This research was supported, in part, by the Intramural Research Program of the NIH, National Institute of Diabetes & Digestive & Kidney Diseases and National Institute of Mental Health. WKS’ efforts were also partially supported by a NIMH K01MH096175-01. The study was conducted under NIH Clinical Study Protocol 09-DK-0081 (ClinicalTrials.gov ID NCT00846040).
Footnotes
Conflicts of Interest
The authors have no conflicts of interest.
References
- 1.Swinburn BA, Sacks G, Hall KD, McPherson K, Finegood DT, Moodie ML, et al. The global obesity pandemic: shaped by global drivers and local environments. Lancet. 2011 Aug 27;378(9793):804–814. doi: 10.1016/S0140-6736(11)60813-1. PubMed PMID: 21872749. eng. [DOI] [PubMed] [Google Scholar]
- 2.Bond MJ, McDowell AJ, Wilkinson JY. The measurement of dietary restraint, disinhibition and hunger: an examination of the factor structure of the Three Factor Eating Questionnaire (TFEQ) Int J Obes Relat Metab Disord. 2001 Jun;25(6):900–906. doi: 10.1038/sj.ijo.0801611. PubMed PMID: 11439306. [DOI] [PubMed] [Google Scholar]
- 3.Bryant EJ, King NA, Blundell JE. Disinhibition: its effects on appetite and weight regulation. Obes Rev. 2008 Sep;9(5):409–419. doi: 10.1111/j.1467-789X.2007.00426.x. PubMed PMID: 18179615. [DOI] [PubMed] [Google Scholar]
- 4.Graybiel AM. Habits, rituals, and the evaluative brain. Annual review of neuroscience. 2008;31:359–387. doi: 10.1146/annurev.neuro.29.051605.112851. PubMed PMID: 18558860. eng. [DOI] [PubMed] [Google Scholar]
- 5.Wickens JR, Horvitz JC, Costa RM, Killcross S. Dopaminergic mechanisms in actions and habits. J Neurosci. 2007 Aug 1;27(31):8181–8183. doi: 10.1523/JNEUROSCI.1671-07.2007. PubMed PMID: 17670964. eng. [DOI] [PMC free article] [PubMed] [Google Scholar]
- 6.Yin HH, Knowlton BJ. The role of the basal ganglia in habit formation. Nat Rev Neurosci. 2006 Jun;7(6):464–476. doi: 10.1038/nrn1919. PubMed PMID: 16715055. eng. [DOI] [PubMed] [Google Scholar]
- 7.Yin HH, Ostlund SB, Balleine BW. Reward-guided learning beyond dopamine in the nucleus accumbens: the integrative functions of cortico-basal ganglia networks. The European journal of neuroscience. 2008 Oct;28(8):1437–1448. doi: 10.1111/j.1460-9568.2008.06422.x. PubMed PMID: 18793321. eng. [DOI] [PMC free article] [PubMed] [Google Scholar]
- 8.Nelson A, Killcross S. Amphetamine exposure enhances habit formation. J Neurosci. 2006 Apr 5;26(14):3805–3812. doi: 10.1523/JNEUROSCI.4305-05.2006. PubMed PMID: 16597734. eng. [DOI] [PMC free article] [PubMed] [Google Scholar]
- 9.Faure A, Haberland U, Conde F, El Massioui N. Lesion to the nigrostriatal dopamine system disrupts stimulus-response habit formation. J Neurosci. 2005 Mar 16;25(11):2771–2780. doi: 10.1523/JNEUROSCI.3894-04.2005. PubMed PMID: 15772337. eng. [DOI] [PMC free article] [PubMed] [Google Scholar]
- 10.Murray JE, Dilleen R, Pelloux Y, Economidou D, Dalley JW, Belin D, et al. Increased Impulsivity Retards the Transition to Dorsolateral Striatal Dopamine Control of Cocaine Seeking. Biological psychiatry. Oct 21; doi: 10.1016/j.biopsych.2013.09.011. PubMed PMID: 24157338. Eng. [DOI] [PMC free article] [PubMed] [Google Scholar]
- 11.Yin HH, Knowlton BJ, Balleine BW. Lesions of dorsolateral striatum preserve outcome expectancy but disrupt habit formation in instrumental learning. The European journal of neuroscience. 2004 Jan;19(1):181–189. doi: 10.1111/j.1460-9568.2004.03095.x. PubMed PMID: 14750976. eng. [DOI] [PubMed] [Google Scholar]
- 12.Wang GJ, Volkow ND, Logan J, Pappas NR, Wong CT, Zhu W, et al. Brain dopamine and obesity. Lancet. 2001 Feb 3;357(9253):354–357. doi: 10.1016/s0140-6736(00)03643-6. PubMed PMID: 11210998. eng. [DOI] [PubMed] [Google Scholar]
- 13.Berridge KC, Ho CY, Richard JM, DiFeliceantonio AG. The tempted brain eats: pleasure and desire circuits in obesity and eating disorders. Brain research. 2010 Sep 2;1350:43–64. doi: 10.1016/j.brainres.2010.04.003. PubMed PMID: 20388498. Pubmed Central PMCID: 2913163. [DOI] [PMC free article] [PubMed] [Google Scholar]
- 14.Stunkard AJ, Messick S. The three-factor eating questionnaire to measure dietary restraint, disinhibition and hunger. Journal of psychosomatic research. 1985;29(1):71–83. doi: 10.1016/0022-3999(85)90010-8. PubMed PMID: 3981480. [DOI] [PubMed] [Google Scholar]
- 15.Matthews DR, Hosker JP, Rudenski AS, Naylor BA, Treacher DF, Turner RC. Homeostasis model assessment: insulin resistance and beta-cell function from fasting plasma glucose and insulin concentrations in man. Diabetologia. 1985 Jul;28(7):412–419. doi: 10.1007/BF00280883. PubMed PMID: 3899825. eng. [DOI] [PubMed] [Google Scholar]
- 16.Lammertsma AA, Hume SP. Simplified reference tissue model for PET receptor studies. NeuroImage. 1996 Dec;4(3 Pt 1):153–158. doi: 10.1006/nimg.1996.0066. PubMed PMID: 9345505. eng. [DOI] [PubMed] [Google Scholar]
- 17.Berthoud HR. The neurobiology of food intake in an obesogenic environment. Proc Nutr Soc. 2012 Nov;71(4):478–487. doi: 10.1017/S0029665112000602. PubMed PMID: 22800810. Pubmed Central PMCID: 3617987. [DOI] [PMC free article] [PubMed] [Google Scholar]
- 18.Rangel A. Regulation of dietary choice by the decision-making circuitry. Nature neuroscience. 2013 Dec;16(12):1717–1724. doi: 10.1038/nn.3561. PubMed PMID: 24270272. [DOI] [PMC free article] [PubMed] [Google Scholar]
- 19.Volkow ND, Wang GJ, Tomasi D, Baler RD. The addictive dimensionality of obesity. Biological psychiatry. 2013 May 1;73(9):811–818. doi: 10.1016/j.biopsych.2012.12.020. PubMed PMID: 23374642. [DOI] [PMC free article] [PubMed] [Google Scholar]
- 20.Caravaggio F, Raitsin S, Gerretsen P, Nakajima S, Wilson A, Graff-Guerrero A. Ventral Striatum Binding of a Dopamine D Receptor Agonist But Not Antagonist Predicts Normal Body Mass Index. Biological psychiatry. 2013 Mar 27; doi: 10.1016/j.biopsych.2013.02.017. PubMed PMID: 23540907. Pubmed Central PMCID: 3783412. [DOI] [PMC free article] [PubMed] [Google Scholar]
- 21.Eisenstein SA, Antenor-Dorsey JA, Gredysa DM, Koller JM, Bihun EC, Ranck SA, et al. A comparison of D2 receptor specific binding in obese and normal-weight individuals using PET with (N-[ C]methyl)benperidol. Synapse (New York NY) 2013 May 6; doi: 10.1002/syn.21680. PubMed PMID: 23650017. [DOI] [PMC free article] [PubMed] [Google Scholar]
- 22.Steele KE, Prokopowicz GP, Schweitzer MA, Magunsuon TH, Lidor AO, Kuwabawa H, et al. Alterations of central dopamine receptors before and after gastric bypass surgery. Obes Surg. 2010 Mar;20(3):369–374. doi: 10.1007/s11695-009-0015-4. PubMed PMID: 19902317. [DOI] [PubMed] [Google Scholar]
- 23.de Weijer BA, van de Geissen E, van Amelsvoort TA, Boot E, Braak B, Janssen IM, et al. Lower striatal dopamine D2/3 receptor availability in obese compared with non-obese subjects. EJNMMI Research. 2011;1 doi: 10.1186/2191-219X-1-37. [DOI] [PMC free article] [PubMed] [Google Scholar]
- 24.Haltia LT, Rinne JO, Merisaari H, Maguire RP, Savontaus E, Helin S, et al. Effects of intravenous glucose on dopaminergic function in the human brain in vivo. Synapse (New York, NY. 2007 Sep;61(9):748–756. doi: 10.1002/syn.20418. PubMed PMID: 17568412. [DOI] [PubMed] [Google Scholar]
- 25.Small DM, Jones-Gotman M, Dagher A. Feeding-induced dopamine release in dorsal striatum correlates with meal pleasantness ratings in healthy human volunteers. NeuroImage. 2003 Aug;19(4):1709–1715. doi: 10.1016/s1053-8119(03)00253-2. PubMed PMID: 12948725. [DOI] [PubMed] [Google Scholar]
- 26.Elsinga PH, Hatano K, Ishiwata K. PET tracers for imaging of the dopaminergic system. Current medicinal chemistry. 2006;13(18):2139–2153. doi: 10.2174/092986706777935258. PubMed PMID: 16918344. [DOI] [PubMed] [Google Scholar]
- 27.Abi-Dargham A, Rodenhiser J, Printz D, Zea-Ponce Y, Gil R, Kegeles LS, et al. Increased baseline occupancy of D2 receptors by dopamine in schizophrenia. Proceedings of the National Academy of Sciences of the United States of America. 2000 Jul 5;97(14):8104–8109. doi: 10.1073/pnas.97.14.8104. PubMed PMID: 10884434. Pubmed Central PMCID: 16677. [DOI] [PMC free article] [PubMed] [Google Scholar]
- 28.Morris ED, Yoder KK. Positron emission tomography displacement sensitivity: predicting binding potential change for positron emission tomography tracers based on their kinetic characteristics. J Cereb Blood Flow Metab. 2007 Mar;27(3):606–617. doi: 10.1038/sj.jcbfm.9600359. PubMed PMID: 16788713. [DOI] [PubMed] [Google Scholar]
- 29.Alsio J, Olszewski PK, Norback AH, Gunnarsson ZE, Levine AS, Pickering C, et al. Dopamine D1 receptor gene expression decreases in the nucleus accumbens upon long-term exposure to palatable food and differs depending on diet-induced obesity phenotype in rats. Neuroscience. 2010 Dec 15;171(3):779–787. doi: 10.1016/j.neuroscience.2010.09.046. PubMed PMID: 20875839. [DOI] [PubMed] [Google Scholar]
- 30.Johnson PM, Kenny PJ. Dopamine D2 receptors in addiction-like reward dysfunction and compulsive eating in obese rats. Nature neuroscience. 2010 May;13(5):635–641. doi: 10.1038/nn.2519. PubMed PMID: 20348917. Pubmed Central PMCID: 2947358. [DOI] [PMC free article] [PubMed] [Google Scholar]
Associated Data
This section collects any data citations, data availability statements, or supplementary materials included in this article.


