Abstract
Purpose
Due to diagnosis at advanced stages, comorbidities, and the impact of treatment, patients with hepatocellular carcinoma (HCC) may experience pain. The purpose of this study was to evaluate the psychometric properties of a brief, clinically-relevant measure of pain in HCC.
Methods
We conducted a secondary data analysis from four longitudinal studies of patients with HCC (Total n=304). All patients completed the FACT-Hepatobiliary (FACT-Hep) questionnaire and 49 patients completed the Brief Pain Inventory (BPI) Interference scale. We conducted confirmatory factor analysis (CFA), Rasch modeling, and correlational analysis to assess the psychometrics of the three items on the FACT-Hep that assess HCC-relevant pain scale.
Results
Patients had an average age of 63.5 (± 12.2) years and were mostly male (76%). The mean 3-item pain subscale score was 8.5 ± 3.0. Seventy-four (24.3%) patients reported no pain (score=12). Results of a one-factor CFA supported unidimensionality of the items and all items fit the Rasch model. An item-person map demonstrated that the three items covered all patients with non-extreme scores. Pain scores were significantly associated with baseline general health-related quality of life (FACT-General, r = 0.60, p < 0.001), and pain interference (BPI, r = −0.63; p < 0.001).
Conclusions
The three FACT-Hep pain items are unidimensional, cover the range of pain experienced by most patients with HCC, and demonstrate convergent validity. This pain subscale is, if future research demonstrates its sensitivity to change, potentially useful for HCC clinical trials.
Keywords: hepatobiliary cancer, hepatocellular carcinoma, pain, psychometrics, quality of life
Hepatocellular carcinoma (HCC) is a primary hepatic malignancy that often arises as a result of liver cirrhosis. The incidence of HCC has been increasing in recent years and it is currently the second leading cause of cancer death worldwide and results in a significant number of cancer deaths in the United States.1 Choice of treatment for HCC depends largely on stage of disease, patient comorbidities, and center specific expertise.
While mortality and medical morbidity should be central components of treatment decision making, incorporating patient reported outcomes (PROs) would add relevant depth to treatment decisions. Indeed, PROs assessing patient symptoms and other aspects of health-related quality of life (HRQOL) hold promise for increasing our understanding of the most important symptoms and concerns for patients with HCC, as well as the impact of therapy on HCC symptoms and HRQOL. [1] In turn, this information can contribute to evaluations of the comparative effectiveness of HCC therapies.
HRQOL refers to the subjective experience and well-being of a patient as affected by a medical condition or its treatment.[2] HRQOL for HCC has been examined in the literature;[1,3–5] however, there remain a number of open questions regarding the impact of therapeutic intervention on patient HRQOL over time, especially with respect to pain, which some patients experience due to advanced disease at diagnosis, comorbid diseases, and the impact of therapy.[1,3]
The Functional Assessment of Cancer Therapy-Hepatobiliary is a 45-item questionnaire that includes the 27-item FACT-General (FACT-G) and an 18 item hepatobiliary-specific subscale. [6,7] The items on the FACT-Hep were developed on the basis of expert clinician and patient input, ensuring its content validity and clinical relevance for hepatobiliary cancers, such as HCC. In its original form, the scale has specifically been used to assess the QOL impact of HCC treatment, [8] but briefer versions of the scale have been developed for patients with advanced stages of the disease. [9]
To our knowledge, there exists no pain scale specific for patients with HCC or derived from input from patients with HCC. In addition, because the FACT-Hep is often the multidimensional quality of life instrument of choice in HCC trials, a validated pain scale drawn from its content would have practical value. Based on our group’s recent qualitative analysis, [10] we believe three items from the FACT-Hep hold promise to measure clinically significant pain symptoms for patients with HCC. In addition, several investigators select the FACT-Hep as their multidimensional health-related quality of life measure of choice, and would benefit from an embedded, relevant, and responsive pain scale. This would spare patients on those trials the burden of unnecessary added assessment created by adding a pain measure.
The goal of the present study was to test a clinically-relevant pain assessment for people with HCC, derived from items from the FACT-Hep. Such a measure would improve meaningful integration of pain assessment in clinical research on and care of patients with HCC.
Methods
Participants – Secondary Data
We conducted quantitative analysis of existing data from four studies to support the development of a brief pain scale for patients with HCC. Specifically, we analyzed de-identified patient-reported outcome and clinical data previously collected at the University of Pittsburgh Medical Center (UPMC). The original purpose for measuring PROs for the UPMC studies was to characterize the longitudinal changes in health-related quality of life among patients with HCC. A summary of findings from the original research can be found in several published manuscripts.[5,11–14]
Table 1 summarizes the source of the unique patients. All participants with available data were included in our analysis. The studies did have different follow up periods, but at a minimum were followed for a year. The average survival for the patients in the included studies was 11 months. Our focus for the current manuscript was measurement of pain, which was not described in detail in the original manuscripts.
Table 1.
Sociodemographic and clinical characteristics of the sample (n=304)
| Mean (SD) | Range | |
|---|---|---|
| Age, years | 63.5 (12.2) | 27 – 93 |
| Child-Pugh score | 6.1 (1.3) | 5 – 12 |
|
| ||
| N | Percent | |
|
| ||
| Female | 73 | 24% |
| Baseline Treatment | ||
| TACE | 133 | 44% |
| 90Y | 82 | 27% |
| No treatment | 33 | 11% |
| Resection | 20 | 7% |
| Embolization | 17 | 6% |
| RFA laparoscopic | 12 | 4% |
| RFA open | 6 | 2% |
| Nexavar | 1 | <1% |
| Sample | ||
| QOL study | 83 | 27% |
| Intervention | 54 | 18% |
| RCT | 117 | 38% |
| Surgical | 50 | 16% |
| Stage of disease (n=4 missing) | ||
| I | 6 | 2% |
| II | 9 | 3% |
| III | 43 | 14% |
| IV | 242 | 81% |
| Disease progression from Time 1 to Time 2 (n=2 missing) | ||
| Response to treatment | 33 | 11% |
| Stable | 57 | 19% |
| Progression | 115 | 38% |
| Not Available | 62 | 21% |
| Deceased | 35 | 12% |
| Disease progression from Time 2 to Time 3 (n=2 missing) | ||
| Response to treatment | 33 | 11% |
| Stable | 55 | 18% |
| Progression | 85 | 28% |
| N/A | 67 | 22% |
| Deceased | 62 | 21% |
| Disease progression from Time 3 to Time 4 (n=2 missing) | ||
| Response to treatment | 22 | 7% |
| Stable | 59 | 20% |
| Progression | 76 | 25% |
| N/A | 55 | 18% |
| Deceased | 90 | 30% |
Measures
Functional Assessment of Cancer Therapy – Hepatobiliary (FACT-Hep)
The FACT-Hepatobiliary (FACT-Hep) is a 45-item questionnaire that includes the 27-item FACT-General (FACT-G) and an 18 item hepatobiliary-specific subscale. The FACT-G is a general cancer health-related quality of life questionnaire that assesses physical well-being (PWB; 7 items), social/ family well-being (SWB; 7 items), emotional well-being (EWB; 6 items), and functional well-being (FWB; 7 items). Scores were calculated according to developers’ instructions. Specifically, negatively worded items were first reverse scored such that a high score corresponds to better quality of life for all items and subscale scores. If more than 50% of the items in a subscale were completed, missing item responses were imputed using the mean of completed items.[6,7] Item scores were then summed to create subscale scores.
Three items on the FACT-Hep assess pain: GP4 (I have pain), CNS7 (I have pain in my back), and Hep8 (I have discomfort or pain in my stomach area). A three-item pain subscale score was calculated according to the same scoring guidelines and had a possible score range of 0–12 (with lower scores indicating more pain). Our focus in the present manuscript is to report on the relevance and validity of this particular subset of existing questions.
Brief Pain Inventory
The Brief Pain Inventory (BPI) is a self-report instrument that assesses the severity of pain and its impact on daily functions. It has been validated in patients with cancer and other chronic illnesses.[15] Pain severity can be measured by the “worst pain” item for the mean of the four severity items; scores of 5–6 indicate moderate pain and scores of 7–10 indicate severe pain. Pain interference can be summarized by the mean of the 7 interference items. A total of 53 patients had some available BPI data, with 49 having complete data to derive BPI Interference scale scores.
Statistical Analysis
Descriptive Statistics
Available sociodemographic and clinical characteristics of the sample were summarized. Descriptive statistics (mean, standard deviation, median, minimum, maximum) were calculated for all subscale scores.
Internal Consistency Reliability
Cronbach’s coefficient alpha was calculated to evaluate the internal consistency reliability of the pain items. Cronbach’s coefficient alpha is a measure of how closely correlated a set of items are with each other. A Cronbach’s coefficient alpha of 0.70 or greater is generally considered acceptable.[16] We examined item-total correlations to identify items poorly correlated with the total score.
Dimensionality and model fit
We first evaluated the unidimensionality of the three pain items using confirmatory factor analysis as implemented in MPlus. The criteria that were used in this analysis are: comparative fit index (CFI) >0.9; root mean square error of approximation (RMSEAs) <0.08; R-square > 0.3 and modification indices (MI) < 10.[17–20] Once the unidimensionality was confirmed, Rasch analysis,[21] in particular Andrich’s partial credit model[22] as implemented in the WINSTEPS computer program, was used to evaluate the characteristics of the FACT-Hep pain items. Fit statistics for each item, reported as MnSq (criterion: between 0.6–1.4), were used to evaluate whether the items fit the Rasch model.
Item and Scale Information
Item information curves (IICs) were generated for each of the 3 items to characterize the magnitude of information and precision in distinguishing respondents on that item, along the pain measurement continuum. Further, the item information function of each item was aggregated to generate the pain subscale information function curve. The subscale information function curve characterizes the range of the pain domain over which responses to the pain items are best able to distinguish. The scale information function is influenced by the number of items included in the scale. Given that the current pain scale only consists of three items, we report scale information functions for informational purposes only.
Convergent Validity
We hypothesized that the pain scores would be associated with general health-related quality of life, as measured by the FACT-G. The association between the pain scores and the FACT-G was evaluated using Pearson correlations. Moderate correlations in the range of 0.3 to 0.7 were expected.
Results
Descriptive Statistics
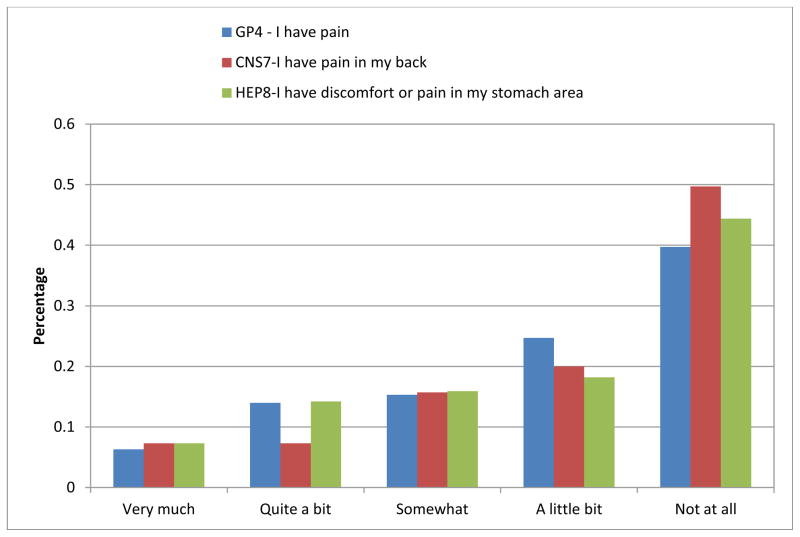
The sociodemographic and clinical characteristics of the 304 patients included in the sample are summarized in Table 1. Descriptive statistics were calculated for all subscale scores and summarized in Table 2. As shown in Figure 1, the majority of patients reported having “none” or “a little bit” of pain on the three-item pain scale derived from the FACT-Hep. Among these 304 patients, 76 showed extreme scores (74 with no pain, 2 with maximum pain, as assessed by these items).
Table 2.
Descriptive statistics of PRO measures
| Time 1 (baseline) | Time 2 (2-months) | Time 3 (4-months) | Time 4 (6-months) | |||||
|---|---|---|---|---|---|---|---|---|
| N | Mean (SD) | n | Mean (SD) | n | Mean (SD) | n | Mean (SD) | |
| FACT-Hep | ||||||||
| Pain | 295 | 8.5 (3.0) | 125 | 8.0 (3.7) | 75 | 8.0 (3.4) | 59 | 8.3 (3.5) |
| PWB | 303 | 21.1 (5.8) | 127 | 18.5 (7.8) | 75 | 18.5 (6.8) | 59 | 20.5 (6.8) |
| SWB | 304 | 22.4 (4.9) | 127 | 18.2 (8.6) | 74 | 19.5 (7.2) | 59 | 21.6 (6.4) |
| EWB | 302 | 16.8 (5.0) | 127 | 15.9 (6.8) | 74 | 16.1 (6.2) | 59 | 18.5 (5.8) |
| FWB | 303 | 16.8 (6.6) | 127 | 16.0 (6.9) | 74 | 16.2 (6.9) | 59 | 18.1 (7.3) |
| FACT-G | 299 | 77.2 (16.6) | 127 | 68.6 (26.6) | 73 | 70.6 (22.5) | 58 | 78.6 (22.4) |
| HCS | 303 | 54.6 (10.7) | 127 | 48.2 (18.3) | 75 | 49.0 (14.8) | 59 | 55.6 (11.6) |
| Total | 298 | 131.6 (25.0) | 127 | 116.8 (43.7) | 73 | 119.5 (36.2) | 58 | 134.2 (32.4) |
| TOI | 301 | 92.5 (20.1) | 127 | 82.7 (30.7) | 74 | 83.7 (25.5) | 59 | 94.2 (23.8) |
| FHSI18 | 304 | 49.6 (12.5) | 127 | 45.8 (16.8) | 75 | 46.0 (15.0) | 59 | 50.9 (14.9) |
| FHSI-DRS | 304 | 39.3 (9.5) | 127 | 36.2 (13.5) | 75 | 36.5 (11.8) | 59 | 40.0 (11.6) |
| FHSI-TSE | 266 | 3.3 (1.1) | 124 | 2.7 (1.4) | 73 | 2.7 (1.2) | 59 | 3.0 (1.2) |
| FHSI-FWB | 303 | 7.0 (3.2) | 127 | 6.9 (3.1) | 74 | 6.8 (3.3) | 59 | 7.9 (3.4) |
| BPI | ||||||||
| Interference | 49 | 4.6 (2.8) | 23 | 4.3 (2.4) | 24 | 4.2 (2.7) | 11 | 4.8 (3.4) |
| Worst pain | 53 | 6.2 (2.7) | 24 | 6.1 (2.5) | 24 | 6.1 (2.8) | 16 | 6.0 (2.7) |
| Least pain | 53 | 3.2 (2.5) | 24 | 2.5 (2.2) | 24 | 2.6 (2.5) | 16 | 3.3 (2.9) |
| Average pain | 53 | 4.9 (2.3) | 24 | 4.4 (2.5) | 24 | 4.3 (2.6) | 15 | 5.2 (2.6) |
| Right now | 53 | 3.6 (3.2) | 24 | 3.4 (3.0) | 24 | 3.1 (2.8) | 16 | 2.9 (3.5) |
Note: FHSI = FACIT Hepatobiliary Symptom Index
Figure 1.
Response frequencies on the three pain items
Internal Consistency Reliability
Cronbach’s coefficient alpha for the three pain items was 0.69 at time 1 (n=295), 0.84 at time 2 (n=125), 0.81 at time 3 (n=75), and 0.81 at time 4 (n=59). Item-total correlations at each time did not indicate any poorly performing items. Pearson correlation coefficients across the time points ranged from: GP4 and CNS7 (0.43 – 0.75); GP4 and Hep8 (0.54 – 0.76); and CNS7 and Hep8 (0.30 – 0.54).
Results of one-factor CFA supported the unidimensionality of these three pain items: CFI=1 (criterion: >.90), RMSEA=0.00 (criterion: <.08), R-square >0.3 (range: 0.341–0.832). With residual correlations from the CFA <.01 and MI all <10, local independence among these three items was also supported.
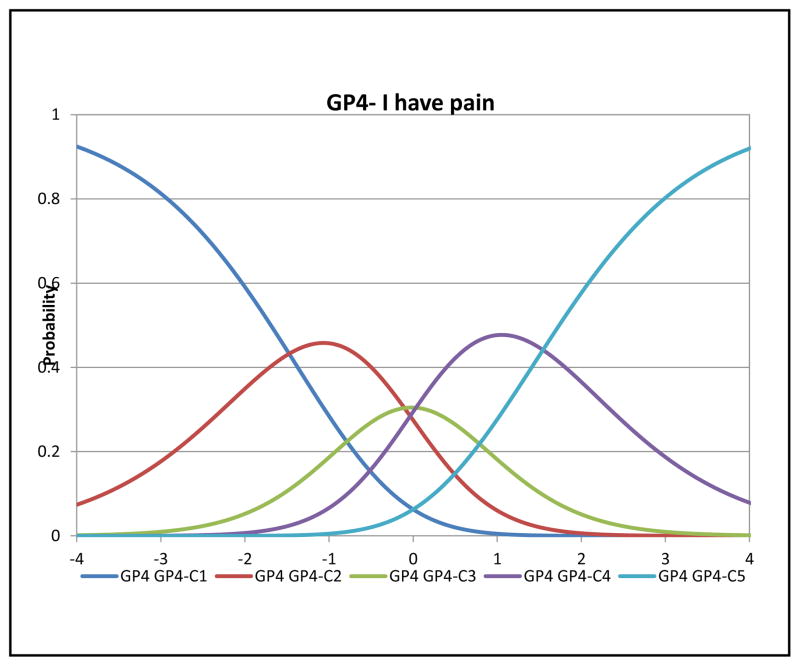
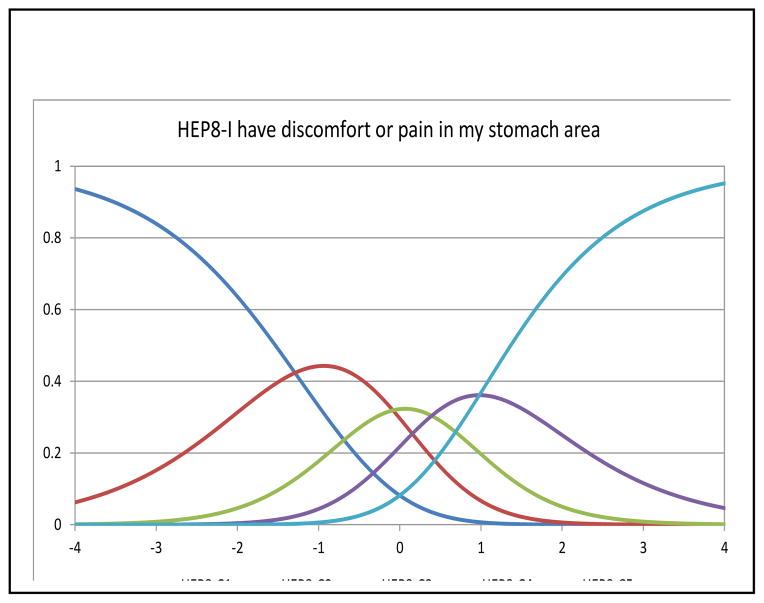
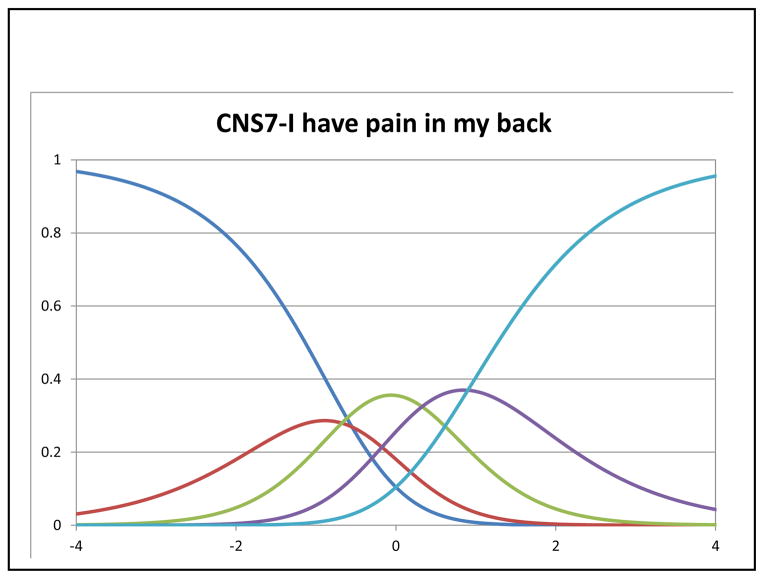
In Rasch analysis, at the item level, all items had acceptable fit with MnSq ranging from 0.84–1.18 (criterion: <1.4). The mean person measure was 1.23 logit (SD=1.57) when all respondents were included. When extreme scores were removed (n=74 extreme high scores and n=2 extreme low scores), the mean person measure was 0.55 logit (SD=1.02). Table 3 shows the item locations and threshold locations for the three items. Figures 2–4 depict category characteristic curves of the rating scale for each item. Each curve represents a response category. Since a 5-point rating scale was used, each figure consisted of 5 curves showing the probability of patients that endorsed each rating at a given latent trait (pain) level (i.e., X-axis) with higher levels showing lower pain. As shown in Figures 2 and 4, each curve was distinguished from each other with ranking of responses in the correct order, satisfying monotonicity. In Figure 3, the curve representing the response category 2 did not have significant peak compared the rest of other four categories. The measures of intersection between two adjacent categories were −0.69 (categories 0 and 1; SE=0.28), −0.81 (categories 1 and 2; SE=0.21), 0.19 (categories 2 and 3; SE=0.17), and 0.76 (categories 3 and 4; SE=0.17). Taking into account the SEs, we concluded this rating scale was valid for measuring this item.
Table 3.
Item locations, fit statistics, and step intercepts
| Item | Item Location | MNSQ | Step 1 | Step 2 | Step 3 | Step 4 |
|---|---|---|---|---|---|---|
|
| ||||||
| GP4 - I have pain. | 0.08 | 0.84 | −1.39 | −0.02 | 0.12 | 1.63 |
| HEP8 - I have discomfort or pain in my stomach area. | 0.05 | 1.00 | −1.24 | −0.03 | 0.45 | 1.03 |
| CNS7 - I have pain in my back. | −0.14 | 1.18 | −0.69 | −0.81 | 0.19 | 0.76 |
NOTE: “Step” represents the intercept between two adjunct response categories. Specifically, “step 1” is the intercept between response “0” and “1”; “step 2” is for response “1” and “2”; “step 3” is for response “2” and “3” and “step 4” is for response “3” and “4”.
Figure 2.
Category characteristic curve of GP4
Figure 4.
Category characteristic curve of CNS7
Figure 3.
Category characteristic curve of CNS7
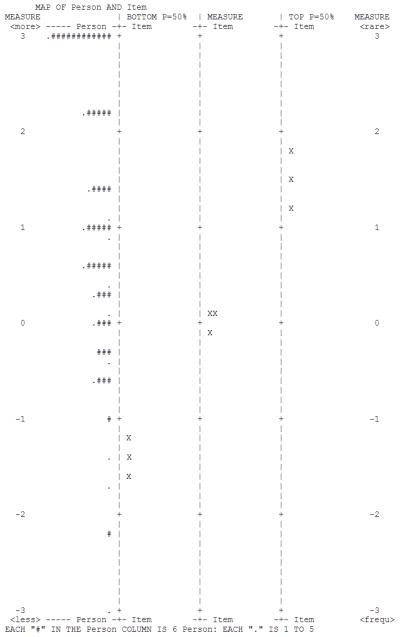
Figure 5 is an “item-person map” that compares whether pain experienced by participants (farthest left column) were fully captured by the pain measurement continuum, as defined by these items. Locations of items on the pain continuum are displayed based on the 50% of probability that patients endorsed the highest (“TOP P=50%”), average of all 5 (“MEASURE”), and lowest (“BOTTOM P=50%”) response category. Specifically, a patient with a measure of 0.5 logit will have <50% of chance to endorse the highest category while on the other hand, >50% to endorse the rest of response categories, As shown in this Figure, except for the 76 extreme patients, all other patients were covered by these 3 items at different probabilities for each response category. In summary, the Rasch analysis results suggest these three items met the Rasch measurement model assumption and could be scaled together.
Figure 5.
Item-person map
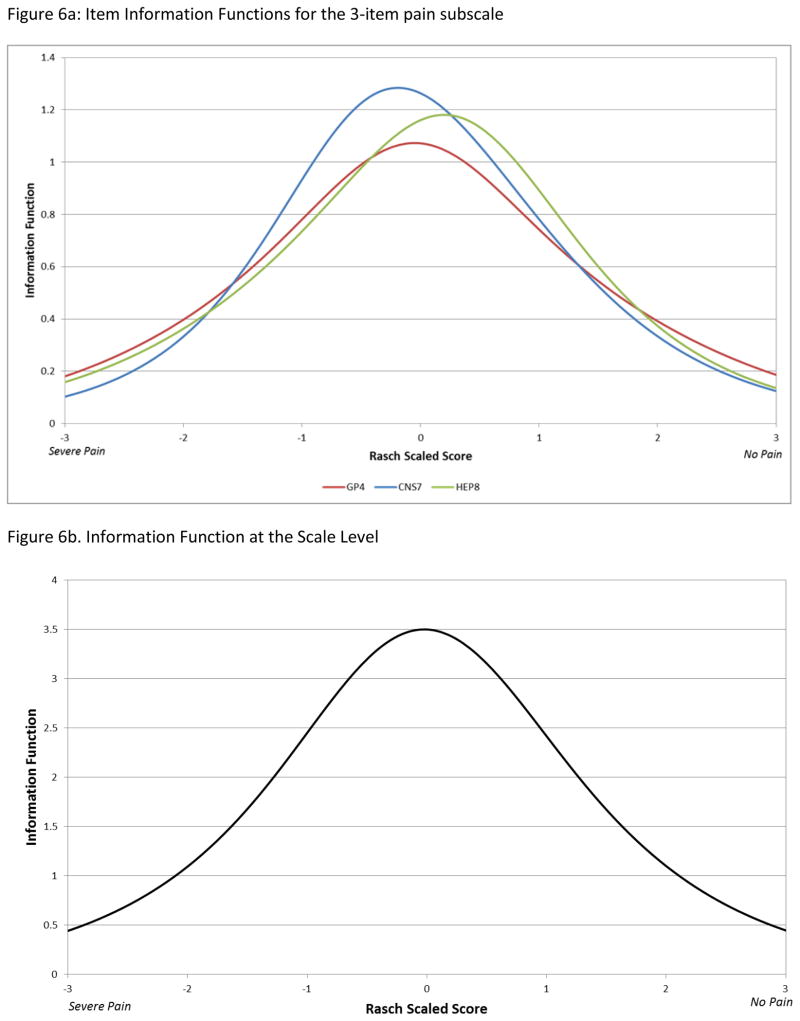
Figure 6a shows item information curves for the 3 pain items. All 3 information curves peaked towards the middle of the latent trait, but compared to HEP8 (I have discomfort or pain in my stomach area) and GP4 (I have pain), CNS7 (I have pain in my back) was somewhat more informative at more severe levels of pain.
Figure 6.
Figure 6a. Item Information Functions for the 3-item pain subscale
Figure 6b. Information Function at the Scale Level
Convergent Validity
The pain scores were moderately associated with general health-related quality of life, as measured by the FACT-G (after removing item GP4, which also appears on this scale), with a Pearson correlation coefficient at baseline of 0.56. For times 2–4, the correlation ranged from 0.69 to 0.74. In the subset of 49 patients who completed the BPI interference scale, the correlation with between the measures was also moderate (r = −0.63 at baseline).
Conclusions
In this secondary data analysis, we evaluated the psychometric properties of a brief, clinically relevant FACT subscale to assess pain in patients with HCC. Results indicated that the 3-item pain scale satisfied the assumptions of response monotonicity, adequate unidimensional fit, and local independence, allowing for Rasch analysis. The range of responses on these items sufficiently covered the pain spectrum, and the item-person fit demonstrated adequate coverage for all except the24% of patients reporting no pain. Responses on all 3 items reflected ordered thresholds, however, for the ‘pain in the back’ item, the response of ‘quite a bit’ was not likely to be endorsed most often at any pain level suggesting little discrimination from the extreme category of ‘very much’ pain.
There were some subtle differences in the location of peaks for the information curves across the 3 items. Notwithstanding the inability to distinguish between the two most extreme response levels on the ‘pain in the back’ item, its item information curve peaked at slightly lower threshold (more severe) pain levels compared to the ‘general pain’ and the ‘stomach pain/discomfort’ items. Given that HCC is characterized by underlying liver cirrhosis, and accompanying ascites, general pain and stomach pain/discomfort may be more common and less informative at high pain trait levels than back pain.
Based on the scale information curve (Figure 6b), the total magnitude of information represented by the scale at its peak was in the 3–4 range, which translates to a reliability coefficient of between 0.66 and 0.75,[23] similar to that estimated for the baseline assessment using the classical test theory-based internal consistency (Cronbach’s alpha) reliability coefficient. Internal consistency of the 3-item scale was better at follow-up assessments than at baseline. This might reflect the greater heterogeneity of the baseline sample with regard to the types of pain assessed by the three items, relative to the co-occurrence of back, abdominal and general pain during follow-up. Nonetheless, for a sub-scale with only 3 items, the estimated reliability coefficients and scale information in this study are reasonable. As with any brief scale, end users should be aware that the standard error of measurement will be greater than for longer scales. The addition of items to this HCC-related pain scale might improve its reliability, but at the expense of additional respondent burden. We also found good evidence for convergent validity of the 3-item pain scale with the FACT-G and with the BPI, for the subset of patients with the additional measures.
Treatment strategies for early HCC include surgical resection, liver transplantation, or locoregional therapies, which include radio frequency-ablation (RFA), cryo-ablation, 90-yttrium, ethanol ablation, or transarterial chemoembolization (TACE).[24,25] Following treatment with non-surgical loco-regional therapy, sorafenib is the most widely used systemic treatment.[26]Previously used symptom endpoints in HCC clinical studies, including the pivotal study for sorafenib, have not always been responsive to changes in radiologically measured disease.[8] It is possible that measurement of change in symptom scales that included other symptoms, notably weight loss, jaundice and nausea, along with pain, in HCC clinical studies may have been confounded by side effects of treatment or progression of underlying cirrhosis, which is not responsive to cancer treatment.[27] Non-pain symptoms in HCC may be due to treatment effects and co-morbidities unrelated to the cancer and/or may be associated with the location of the lesion not captured in the current analysis.
Pain is an important symptom for some patients with HCC, based on feedback from patients and providers.[7,9] However, pain data have not been collected routinely as salient endpoints or intermediary variables in the HCC literature. We believe that this is attributable in part to the challenges inherent in obtaining these data and the lack of perceived value of this type of data. To address these issues, we have developed a brief, clinically-relevant scale of pain for patients with HCC. Prior to use as a sole indicator of pain, it would be wise to pair the 3-item pain scale with another validated pain measure to support confirmation with external criteria. If future research suggests that the scale is sensitive to change, it may be useful in future clinical trials.
Acknowledgments
Zeeshan Butt, Jin-Shei Lai, Jennifer Beaumont, Karen Kaiser, David Cella, and Jennifer Steel have received research funding from Daiichi Sankyo, Inc (DSI). David Cella also has a consultant relationship with DSI. Rajiv Mallick is now an employee at BTG International, Ltd. Data for this secondary analysis was provided by Jennifer Steel.
References
- 1.Fan SY, Eiser C, Ho MC. Health-related quality of life in patients with hepatocellular carcinoma: a systematic review. [Review] Clinical gastroenterology and hepatology : the official clinical practice journal of the American Gastroenterological Association. 2010;8(7):559–564. e551–510. doi: 10.1016/j.cgh.2010.03.008. [DOI] [PubMed] [Google Scholar]
- 2.World Health Organization. Constitution of the World Health Organization. Geneva: World Health Organization; 1946. [Google Scholar]
- 3.Toro A, Pulvirenti E, Palermo F, Di Carlo I. Health-related quality of life in patients with hepatocellular carcinoma after hepatic resection, transcatheter arterial chemoembolization, radiofrequency ablation or no treatment. Surg Oncol. 2012;21(1):e23–30. doi: 10.1016/j.suronc.2011.10.005. S0960-7404(11)00089-2 [pii] [DOI] [PubMed] [Google Scholar]
- 4.Wible BC, Rilling WS, Drescher P, Hieb RA, Saeian K, Frangakis C, et al. Longitudinal quality of life assessment of patients with hepatocellular carcinoma after primary transarterial chemoembolization. Journal of vascular and interventional radiology : JVIR. 2010;21(7):1024–1030. doi: 10.1016/j.jvir.2010.03.005. [DOI] [PubMed] [Google Scholar]
- 5.Steel JL, Chopra K, Olek MC, Carr BI. Health-related quality of life: Hepatocellular carcinoma, chronic liver disease, and the general population. Qual Life Res. 2007;16(2):203–215. doi: 10.1007/s11136-006-9111-2. [DOI] [PubMed] [Google Scholar]
- 6.Heffernan N, Cella D, Webster K, Odom L, Martone M, Passik S, et al. Measuring health-related quality of life in patients with hepatobiliary cancers: the functional assessment of cancer therapy-hepatobiliary questionnaire. J Clin Oncol. 2002;20(9):2229–2239. doi: 10.1200/JCO.2002.07.093. [DOI] [PubMed] [Google Scholar]
- 7.Yount S, Cella D, Webster K, Heffernan N, Chang C, Odom L, et al. Assessment of patient-reported clinical outcome in pancreatic and other hepatobiliary cancers: the FACT Hepatobiliary Symptom Index. [Research Support, Non-U.S. Gov’tValidation Studies] J Pain Symptom Manage. 2002;24(1):32–44. doi: 10.1016/s0885-3924(02)00422-0. [DOI] [PubMed] [Google Scholar]
- 8.Llovet JM, Ricci S, Mazzaferro V, Hilgard P, Gane E, Blanc JF, et al. Sorafenib in advanced hepatocellular carcinoma. N Engl J Med. 2008;359(4):378–390. doi: 10.1056/NEJMoa0708857. [DOI] [PubMed] [Google Scholar]
- 9.Butt Z, Parikh ND, Beaumont JL, Rosenbloom SK, Syrjala KL, Abernethy AP, et al. Development and validation of a symptom index for advanced hepatobiliary and pancreatic cancers: the National Comprehensive Cancer Network Functional Assessment of Cancer Therapy (NCCN-FACT) Hepatobiliary-Pancreatic Symptom Index (NFHSI) Cancer. 2012;118(23):5997–6004. doi: 10.1002/cncr.27588. [DOI] [PMC free article] [PubMed] [Google Scholar]
- 10.Kaiser K, Mallick R, Butt Z, Mulcahy MF, Benson AB, Cella D. Important and relevant symptoms including pain concerns in hepatocellular carcinoma (HCC): a patient interview study. Support Care Cancer. 2013 doi: 10.1007/s00520-013-2039-5. [DOI] [PubMed] [Google Scholar]
- 11.Steel JL, Eton DT, Cella D, Olek MC, Carr BI. Clinically meaningful changes in health-related quality of life in patients diagnosed with hepatobiliary carcinoma. Ann Oncol. 2006;17(2):304–312. doi: 10.1093/annonc/mdj072. [DOI] [PubMed] [Google Scholar]
- 12.Steel JL, Geller DA, Carr BI. Proxy ratings of health related quality of life in patients with hepatocellular carcinoma. Qual Life Res. 2005;14(4):1025–1033. doi: 10.1007/s11136-004-3267-4. [DOI] [PubMed] [Google Scholar]
- 13.Steel JL, Kim KH, Dew MA, Unruh ML, Antoni MH, Olek MC, et al. Cancer-related symptom clusters, eosinophils, and survival in hepatobiliary cancer: an exploratory study. J Pain Symptom Manage. 2010;39(5):859–871. doi: 10.1016/j.jpainsymman.2009.09.019. [DOI] [PMC free article] [PubMed] [Google Scholar]
- 14.Steel JL, Nadeau K, Olek M, Carr BI. Preliminary results of an individually tailored psychosocial intervention for patients with advanced hepatobiliary carcinoma. J Psychosoc Oncol. 2007;25(3):19–42. doi: 10.1300/J077v25n03_02. [DOI] [PubMed] [Google Scholar]
- 15.Cleeland CS. The Brief Pain Inventory: User Guide. Houston, TX: The University of Texas MD Anderson Cancer Center; 2009. [Google Scholar]
- 16.Reeve BB, Wyrwich KW, Wu AW, Velikova G, Terwee CB, Snyder CF, et al. ISOQOL recommends minimum standards for patient-reported outcome measures used in patient-centered outcomes and comparative effectiveness research. Qual Life Res. 2013 doi: 10.1007/s11136-012-0344-y. [DOI] [PubMed] [Google Scholar]
- 17.Cook KF, Teal CR, Bjorner JB, Cella D, Chang CH, Crane PK, et al. IRT health outcomes data analysis project: an overview and summary. Qual Life Res. 2007;16(Suppl 1):121–132. doi: 10.1007/s11136-007-9177-5. [DOI] [PubMed] [Google Scholar]
- 18.Hays RD, Liu H, Spritzer K, Cella D. Item response theory analyses of physical functioning items in the medical outcomes study. Med Care. 2007;45(5 Suppl 1):S32–38. doi: 10.1097/01.mlr.0000246649.43232.82. [DOI] [PubMed] [Google Scholar]
- 19.Reeve BB, Hays RD, Bjorner JB, Cook KF, Crane PK, Teresi JA, et al. Psychometric evaluation and calibration of health-related quality of life item banks: plans for the Patient-Reported Outcomes Measurement Information System (PROMIS) Med Care. 2007;45(5 Suppl 1):S22–31. doi: 10.1097/01.mlr.0000250483.85507.04. [DOI] [PubMed] [Google Scholar]
- 20.Hambleton RK. Emergence of item response modeling in instrument development and data analysis. Med Care. 2000;38(9 Suppl):II60–65. doi: 10.1097/00005650-200009002-00009. [DOI] [PubMed] [Google Scholar]
- 21.Smith EV, Smith RM. Introduction to Rasch measurement: Theory, models, and applications. Maple Grove, MN: JAM Press; 2004. [Google Scholar]
- 22.Andrich D. A rating formulation for ordered response categories. Psychometrika. 1978;43:561–573. [Google Scholar]
- 23.Edelen MO, Reeve BB. Applying item response theory (IRT) modeling to questionnaire development, evaluation, and refinement. Qual Life Res. 2007;16(Suppl 1):5–18. doi: 10.1007/s11136-007-9198-0. [DOI] [PubMed] [Google Scholar]
- 24.Llovet JM, Bru C, Bruix J. Prognosis of hepatocellular carcinoma: the BCLC staging classification. [Research Support, Non-U.S. Gov’t] Seminars in liver disease. 1999;19(3):329–338. doi: 10.1055/s-2007-1007122. [DOI] [PubMed] [Google Scholar]
- 25.Bruix J, Sherman M. Management of hepatocellular carcinoma: an update. Hepatology. 2011;53(3):1020–1022. doi: 10.1002/hep.24199. [DOI] [PMC free article] [PubMed] [Google Scholar]
- 26.Lang L. FDA approves sorafenib for patients with inoperable liver cancer. Gastroenterology. 2008;134(2):379. doi: 10.1053/j.gastro.2007.12.037. [DOI] [PubMed] [Google Scholar]
- 27.Llovet JM, Di Bisceglie AM, Bruix J, Kramer BS, Lencioni R, Zhu AX, et al. Design and endpoints of clinical trials in hepatocellular carcinoma. J Natl Cancer Inst. 2008;100(10):698–711. doi: 10.1093/jnci/djn134. [DOI] [PubMed] [Google Scholar]


