

Summary
Mammalian karyotypes (number and structure of chromosomes) can vary dramatically over short evolutionary time frames [1–3]. There are examples of massive karyotype conversion, from mostly telocentric (centromere terminal) to mostly metacentric (centromere internal), in 102–105 years [4, 5]. These changes typically reflect rapid fixation of Robertsonian (Rb) fusions, a common chromosomal rearrangement that joins two telocentric chromosomes at their centromeres to create one metacentric [5]. Fixation of Rb fusions can be explained by meiotic drive: biased chromosome segregation during female meiosis in violation of Mendel’s First Law [3, 6, 7]. However, there is no mechanistic explanation of why fusions would preferentially segregate to the egg in some populations, leading to fixation and karyotype change, while other populations preferentially eliminate the fusions and maintain a telocentric karyotype. Here we show, using both laboratory models and wild mice, that differences in centromere strength predict the direction of drive. Stronger centromeres, manifested by increased kinetochore protein levels and altered interactions with spindle microtubules, are preferentially retained in the egg. We find that fusions preferentially segregate to the polar body in laboratory mouse strains when the fusion centromeres are weaker than those of telocentrics. Conversely, fusion centromeres are stronger relative to telocentrics in natural house mouse populations that have changed karyotype by accumulating metacentric fusions. Our findings suggest that natural variation in centromere strength explains how the direction of drive can switch between populations. They also provide a cell biological basis of centromere drive and karyotype evolution.
Results and Discussion
When new Rb fusions arise and are present in the heterozygous state, the direction of chromosome segregation during female meiosis I (MI) (Figure 1A) determines whether the metacentric fusions are transmitted to the offspring. Metacentrics that segregate to the polar body are lost, because the homologous telocentrics are retained in the egg. In contrast, preferential segregation of metacentrics to the egg favors their fixation and, involving multiple different metacentrics in a population, eventual conversion of a telocentric karyotype to a metacentric karyotype. This biased segregation, a form of meiotic drive, can explain karyotype change in numerous mammalian species that have accumulated Rb fusions [5, 6, 8–10]. The western house mouse (Mus musculus domesticus) is the best characterized example of recently divergent telocentric and metacentric karyotypes [11]. The typical mouse karyotype is completely telocentric, with a diploid chromosome number of 2n=40, but numerous natural populations have fixed multiple different metacentrics and show dramatically reduced chromosome numbers (e.g., 2n=22) [11, 12]. According to the meiotic drive hypothesis, Rb fusions segregate preferentially to the egg in these populations and preferentially to the polar body in other populations that have remained telocentric. It is not known what determines the direction of drive and how that direction can differ between populations, so that some retain the fusions and change karyotype while others do not.
Figure 1. Metacentrics that preferentially segregate to the polar body have weak centromeres relative to telocentrics.

(A) Two possible outcomes of balanced trivalent segregation when a metacentric pairs with its homologous telocentric chromosomes in MI: the metacentric segregates to the polar body and the telocentrics stay in the egg (i), or vice versa (ii). (B) DNA and centromere (CREST) staining in Rb(6.16) x CF-1 MII eggs treated with kinesin-5 inhibitor to disperse the chromosomes; insets: telocentric (left) or metacentric (right) chromosomes. The metacentric preferentially segregates to the polar body (60%, n=168, P=0.009). (C) HEC1 staining in Rb(6.16) x CF-1 MI oocytes (n=91) was quantified for the metacentric (inset, yellow asterisk) and homologous telocentrics in the trivalent, and for other telocentrics. (D) CENP-A staining, shown with synaptonemal complex protein SYCP2, was quantified for the metacentric (inset 1) and telocentrics (inset 2) in Rb(6.16) spermatocytes (n=305). Black asterisks: P<0.05; scale bars: 5 μm; AU: arbitrary units.
To establish a system exhibiting meiotic drive of Rb fusion metacentrics in mouse oocytes, we crossed a standard laboratory strain (CF-1), with all telocentric chromosomes (2n=40), to a strain homozygous for a single metacentric fusion between chromosomes 6 and 16 (2n=38). This fusion originated in a natural population that accumulated multiple metacentrics [13] and was subsequently crossed into a lab strain (C57BL/6) to generate a strain homozygous for a single metacentric. In the offspring from this cross, Rb(6.16) x CF-1, the metacentric pairs with the homologous telocentric chromosomes in MI oocytes to form a trivalent structure. There are two possible outcomes of balanced trivalent segregation in anaphase I (Figure 1A), and any difference between their frequencies indicates meiotic drive. Based on both centromere counting and morphological detection of the metacentric chromosome, we found that 40% of MII eggs contained the metacentric, indicating significantly biased segregation to the polar body (Figure 1B). This result demonstrates meiotic drive and is consistent with previous reports for more than thirty different Rb fusion metacentrics that are singly heterozygous in a laboratory mouse background, although in some cases the reported transmission ratio distortion could be due to post-zygotic selection (e.g., embryonic lethality) [6].
The direction of segregation of the metacentric and homologous telocentrics depends on interactions between centromeres of the trivalent and microtubules of the MI spindle. To determine whether functional differences between centromeres might contribute to biased segregation, we stained Rb(6.16) x CF-1 MI oocytes for HEC1 (also known as NDC80), a major microtubule binding protein at kinetochores [14]. We find 40% less HEC1 at centromeres of metacentrics compared to telocentrics (Figure 1C), and we obtained similar results for two other Rb fusion metacentrics (Figure S1) that also exhibit biased segregation [6]. We also investigated staining of CENP-A, the histone H3 variant that defines the centromere, using spermatocytes because of technical difficulties with CENP-A staining in oocytes. We find 16% less CENP-A protein at centromeres of metacentrics relative to telocentrics (Figure 1D). These results indicate that centromeres of metacentric chromosomes are weaker relative to centromeres of telocentrics, based on levels of two key kinetochore proteins, in a system where the metacentrics are preferentially lost in MI.
In contrast to our Rb(6.16) x CF-1 system, metacentrics likely exhibited drive in the opposite direction in wild populations that have accumulated Rb fusion metacentrics and changed karyotype (metacentric races). Using commercially available mice from one of these metacentric races, CHPO (2n=26), which is homozygous for seven metacentrics and six telocentrics [11, 15], we assessed centromere strength by HEC1 staining in MI oocytes, with CF-1 for comparison. We found ~50% less HEC1 at each CHPO centromere, on average, compared to CF-1 centromeres (Figure 2A). To determine whether this difference reflects an intrinsic property of centromeres rather than different HEC1 expression levels, we stained HEC1 in oocytes from a CF-1 x CHPO cross. For this analysis we focused on the six telocentric bivalents formed from the six CHPO telocentrics paired with homologous CF-1 telocentrics. We found unequal HEC1 staining across each bivalent, with an average difference of 40% (Figure 2B), which we interpret as the brighter and dimmer centromeres originating from CF-1 and CHPO, respectively. We did not see such HEC1 asymmetry across bivalents from either of the parental strains, CF-1 or CHPO (Figure 2B). If the observed differences in centromere strength, as measured by HEC1 staining, have functional consequences for microtubule interactions, we predict that CF-1 x CHPO bivalents would be positioned off-center at metaphase I due to unbalanced microtubule pulling forces on either side of each bivalent. Consistent with this prediction, we find that CF-1 x CHPO bivalents are frequently off-center on the spindle, towards the pole facing the stronger centromere (i.e., more HEC1) (Figure 2C–E). In contrast, bivalents in the CF-1 parental line were well aligned in the center of the spindle. These results indicate that differences in centromere strength, as measured by HEC1 staining, are intrinsic to centromeres and lead to functional differences in microtubule interactions.
Figure 2. Differential centromere strength within telocentric bivalents affects their position at metaphase I.

(A) HEC1 staining per centromere was quantified in CF-1 (n=28) and CHPO (n=15) MI oocytes, AU: arbitrary units, error bars: SEM. (B) HEC1 staining in CF-1 x CHPO oocytes (n=28). Graph shows the binned distribution of HEC1 intensity ratios (dimmer/brighter kinetochore) calculated for each telocentric bivalent in CF-1 x CHPO oocytes (green, n=28), CF-1 oocytes (red, n=32) or CHPO oocytes (blue, n=30). (C) Images show AURKA, HEC1, and DNA staining in CF-1 x CHPO oocytes (n=64) at metaphase I: a maximal intensity z-projection including all chromosomes (1) and optical sections showing each telocentric bivalent individually (2–7). Schematic shows bivalent positions as equidistant between the two poles (middle), or off-center towards the stronger kinetochore (upper panel) or weaker kinetochore (lower panel). The proportion of bivalents in each group is plotted. (D and E) Schematic shows bivalent position measured as distance (d) from the spindle midzone. Positions of CF-1 and CF-1 x CHPO bivalents at metaphase I are plotted. Each point represents one bivalent; mean shown as red bar. Insets: HEC1 in individual bivalents; scale bars: 5 μm; asterisks: P<0.001.
In the Rb(6.16) x CF-1 system, centromeres of metacentrics are weaker relative to telocentrics and preferentially lost in the polar body during MI (Figure 1). We tested whether this centromere strength relationship is reversed in CHPO, which represents a natural population that accumulated Rb fusions. To measure centromere strength of metacentrics relative to telocentrics in CHPO, we first examined oocytes from the CF-1 x CHPO cross. These oocytes contain seven trivalents, in which CHPO metacentric fusions pair with homologous CF-1 telocentrics (Figure 3A), and the CHPO metacentrics can be unambiguously identified based on the trivalent morphology. Additionally, the CHPO telocentrics can be identified in the same oocytes as the dimmer centromeres in telocentric bivalents. Based on this analysis, we find that centromeres of CHPO metacentrics contain 14% more HEC1 on average than centromeres of CHPO telocentrics (Figure 3B). Second, we analyzed CENP-A staining intensity in chromosome spreads from CHPO spermatocytes, in which the metacentrics and telocentrics can easily be identified. Consistent with the HEC1 result, centromeres of CHPO metacentrics have ~25% more CENP-A relative to CHPO telocentrics (Figure 3C). These results show that centromeres of metacentrics are stronger relative to telocentrics in animals in which the metacentrics were presumably preferentially retained during MI.
Figure 3. Metacentrics have stronger centromeres relative to telocentrics in mice that have accumulated multiple metacentrics.
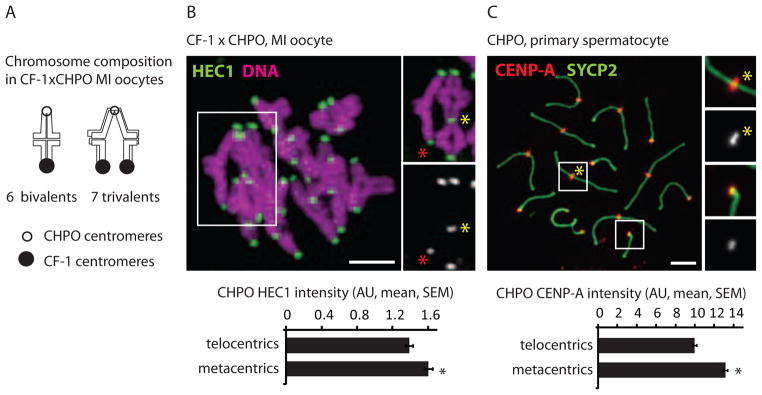
(A and B) Chromosome composition and HEC1 staining in CF-1 x CHPO MI oocytes (n=28). Staining was quantified at centromeres from CHPO telocentrics (identified as the dimmer kinetochores in bivalents, red asterisk) and from CHPO metacentrics in trivalents (yellow asterisk). (C) CENP-A staining in CHPO primary spermatocytes (n=67) was quantified for metacentrics (inset 1) and telocentrics (inset 2). Black asterisks: P<0.05; scale bars: 5 μm; AU: arbitrary units.
Based on our results with lab strains (CF-1, CHPO), we propose that relative centromere strength of metacentric fusions vs. homologous telocentrics determines the direction of meiotic drive, with stronger centromeres preferentially remaining in the egg. Thus, if an Rb fusion metacentric arises or is introduced into a strain with strong centromeres, such that the fusion centromere is weaker than the homologous telocentrics, it preferentially segregates to the polar body (Figure 1B). Conversely, Rb fusions originating on a weak centromere background may be strong relative to the telocentrics and segregate preferentially to the egg. If there is natural variation in centromere strength such that some mouse populations have weak centromeres, consistent with rapid centromere evolution [16], our hypothesis can explain why these populations would accumulate Rb fusions. We observed such variation in centromere strength based on HEC1 staining in oocytes from evolutionarily and geographically diverse mouse species, subspecies and strains (Figure 4A and 4C). Although factors like population size and geographical isolation also likely contribute to chromosomal fixation [17], there are two predictions of our model for the formation of natural metacentric races that can be tested by analyzing centromere strength in wild mouse populations. First, metacentric races should have weak centromeres overall, as seen with CHPO (Figure 2A and 4C), so that a newly arising Rb fusion would appear relatively stronger. Second, if we compare centromeres within a single cell from a metacentric population, centromeres of metacentric chromosomes should be stronger than those of telocentrics (e.g., CHPO, Figure 3).
Figure 4. Relative centromere strength predicts meiotic drive in natural mouse populations with metacentrics.

(A and B) HEC1 staining in MI oocytes from commercially available mouse species, subspecies and strains (A) and from natural metacentric populations in Barcelona and Greece and a telocentric population in Greece, together with a standard laboratory strain for comparison (B). (C) HEC1 staining was quantified relative to laboratory mouse strains and normalized to CF-1. Numbers of oocytes in each group are indicated; gray bars: telocentric populations, black bars: metacentric populations; asterisks: statistically different from lab strains (P<0.05). (D and E) CENP-A staining was quantified in spermatocytes from CHPO, Rb(6.16), and natural metacentric populations. A representative image of a metacentric karyotype (D) is shown (PSAN, 2n=22); insets: telocentric (1) and metacentric (2) chromosomes. The ratio of CENP-A staining in metacentrics/telocentrics was calculated for each group (E). Asterisks: metacentrics statistically different from telocentrics (P<0.05). Scale bars: 5 μm; AU: arbitrary units. (F) Listing of the karyotypes of the natural metacentric populations used in this study. (G) Model for meiotic drive of Rb fusions. In populations with strong centromeres, fusions that arise spontaneously (red chromosomes) tend to have weaker centromeres than the homologous telocentrics and therefore preferentially segregate to the polar body. In populations with weak centromeres, fusions tend to be relatively strong and are preferentially retained in the egg.
To test these predictions, we collected mice from natural metacentric-containing populations in Barcelona [18], Madeira Island [4] and Greece [19] (Figure 4F), and confirmed their karyotype (Figure S2). The metacentrics are fixed or almost entirely fixed in the Madeira and Greece populations (i.e., metacentric races), but the Barcelona population includes individuals that are heterozygous for some fusions and homozygous for others, and none of the fusions are fixed (i.e., the population is polymorphic) [18]. To compare centromere strength between populations, we stained HEC1 in MI oocytes from these animals (Figure 4B and 4C), using a standard telocentric laboratory strain (C57BL/6 or BALB/c) for comparison. We find that mice from the metacentric population in Greece (GROL) have ~ 60% less HEC1 per centromere relative to lab mice, consistent with our results from CHPO and with our prediction that a metacentric population should have relatively weak centromeres. The Barcelona mice (EBAR) showed variability in HEC1 among individual animals (Figure S3), suggesting that metacentrics are not fixed in this population because they are not consistently driving against weak centromeres. We also detected weak centromeres in a telocentric population in Greece (2n=40), which suggests that different geographical populations of house mouse can vary in centromere strength, consistent with our results with commercially available animals. We were not able to obtain a standard lab strain on Madeira for comparison and therefore did not include these animals in our analysis.
To compare centromeres within single cells, we stained CENP-A in spermatocytes and compared the metacentrics and telocentrics. Results from all three localities sampled in Madeira (PSAN 2n=22, PEDC 2n=24, PPOD 2n=27–28) and from Greece (GROL 2n=24) showed 10–15% stronger CENP-A signal at centromeres of metacentrics relative to telocentrics (Figure 4D and 4E). Metacentrics and telocentrics were not statistically different in CENP-A staining in the EBAR mice (Figure 4E and S4), which suggests that meiotic drive is not strong enough to fix metacentrics in this population. In summary, comparisons both between and within metacentric-containing populations support our model in which relative centromere strength determines the direction of meiotic drive acting on metacentrics.
Conclusions
Overall our results show natural variation in centromere strength and that these differences are functionally relevant as they affect interactions with spindle microtubules. Rb fusion metacentrics that preferentially segregate to the polar body in laboratory animals have weaker centromeres relative to the homologous telocentrics. In contrast, centromeres of Rb fusions are relatively stronger than telocentrics in metacentric populations where the fusions were preferentially retained. Our findings provide the first experimental evidence for the idea that stronger centromeres, with increased levels of centromere proteins, preferentially segregate to the egg, which was previously proposed based on theoretical considerations [20]. Our results also explain how Rb fusions can drive in either direction, based on relative centromere strength. We propose that fusions arising on a strong centromere background tend to have weaker centromeres than the homologous telocentrics, preferentially segregate to the polar body, and are lost from the population. In contrast, metacentrics emerging on weak centromere backgrounds are stronger than the telocentrics, are preferentially retained, and therefore accumulate in the population (Figure 4G). This karyotype evolution can lead to speciation because hybrids between different karyotypes exhibit meiotic abnormalities contributing to reproductive isolation [21, 22]. Our findings motivate future studies to determine the molecular basis for differences in centromere strength.
Supplementary Material
Highlights.
Differences in centromere strength predict the direction of meiotic drive.
Centromere strength influences interactions with spindle microtubules.
Natural variation in centromere strength explains karyotype change.
Acknowledgments
We thank C. Sapienza for comments and insights, R. Benezra for the HEC1 antibody, J. Wang for the SYCP2 antibody, N. Medarde for assistance with karyotyping in Barcelona, R. Monarca for helping with the field work in Madeira, M. Mathias for support of that field work, A. Moreno for support with the lab work in Barcelona, and T. Kapoor and P. Sniegowski for comments on the manuscript. The research was supported by National Institutes of Health Grant GM107086 (M.A.L. and R.M.S.) and by project CGL2010-15243 of the Spanish ‘Ministerio de Economía y Competitividad’ (J.V.).
Footnotes
Publisher's Disclaimer: This is a PDF file of an unedited manuscript that has been accepted for publication. As a service to our customers we are providing this early version of the manuscript. The manuscript will undergo copyediting, typesetting, and review of the resulting proof before it is published in its final citable form. Please note that during the production process errors may be discovered which could affect the content, and all legal disclaimers that apply to the journal pertain.
References
- 1.Rieseberg LH. Chromosomal rearrangements and speciation. Trends Ecol Evol. 2001;16:351–358. doi: 10.1016/s0169-5347(01)02187-5. [DOI] [PubMed] [Google Scholar]
- 2.Faria R, Navarro A. Chromosomal speciation revisited: rearranging theory with pieces of evidence. Trends Ecol Evol. 2010;25:660–9. doi: 10.1016/j.tree.2010.07.008. [DOI] [PubMed] [Google Scholar]
- 3.Brown JD, O’Neill RJ. Chromosomes, conflict, and epigenetics: chromosomal speciation revisited. Annu Rev Genomics Hum Genet. 2010;11:291–316. doi: 10.1146/annurev-genom-082509-141554. [DOI] [PubMed] [Google Scholar]
- 4.Britton-Davidian J, Catalan J, Ramalhinho MG, Ganem G, Auffray JC, Capela R, Biscoito M, Searle JB, Mathias ML. Rapid chromosomal evolution in island mice. Nature. 2000;403:158. doi: 10.1038/35003116. [DOI] [PubMed] [Google Scholar]
- 5.White TA, Bordewich M, Searle JB. A network approach to study karyotypic evolution: the chromosomal races of the common shrew (Sorex araneus) and house mouse (Mus musculus) as model systems. Syst Biol. 2010;59:262–76. doi: 10.1093/sysbio/syq004. [DOI] [PubMed] [Google Scholar]
- 6.Pardo-Manuel de Villena F, Sapienza C. Female meiosis drives karyotypic evolution in mammals. Genetics. 2001;159:1179–89. doi: 10.1093/genetics/159.3.1179. [DOI] [PMC free article] [PubMed] [Google Scholar]
- 7.Rice WR. Nothing in genetics makes sense except in light of genomic conflict. Annu Rev Ecol Evol Syst. 2013;44:217–237. [Google Scholar]
- 8.Buckland RA, Evans HJ. Cytogenetic aspects of phylogeny in the Bovidae. I G-banding Cytogenet Cell Genet. 1978;21:42–63. doi: 10.1159/000130877. [DOI] [PubMed] [Google Scholar]
- 9.Mao X, Nie W, Wang J, Su W, Feng Q, Wang Y, Dobigny G, Yang F. Comparative cytogenetics of bats (Chiroptera): the prevalence of Robertsonian translocations limits the power of chromosomal characters in resolving interfamily phylogenetic relationships. Chromosome Res. 2008;16:155–70. doi: 10.1007/s10577-007-1206-2. [DOI] [PubMed] [Google Scholar]
- 10.Aniskin VM, Benazzou T, Biltueva L, Dobigny G, Granjon L, Volobouev V. Unusually extensive karyotype reorganization in four congeneric Gerbillus species (Muridae: Gerbillinae) Cytogenet Genome Res. 2006;112:131–40. doi: 10.1159/000087525. [DOI] [PubMed] [Google Scholar]
- 11.Piálek J, Hauffe HC, Searle JB. Chromosomal variation in the house mouse. Biol J Linn Soc. 2005;84:535–563. [Google Scholar]
- 12.Garagna S, Page J, Fernandez-Donoso R, Zuccotti M, Searle JB. The Robertsonian phenomenon in the house mouse: mutation, meiosis and speciation. Chromosoma. 2014 doi: 10.1007/s00412-014-0477-6. [DOI] [PubMed] [Google Scholar]
- 13.Gropp A, Noack G, Kolbus U, Winking H. Robertsonian fusion metacentrics. Mouse News Lett. 1977;57:26–28. [Google Scholar]
- 14.Cheeseman IM, Desai A. Molecular architecture of the kinetochore-microtubule interface. Nat Rev Mol Cell Biol. 2008;9:33–46. doi: 10.1038/nrm2310. [DOI] [PubMed] [Google Scholar]
- 15.Gropp A, Tettenborn U, von Lehmann E. Chromosome studies in the tobacco mouse (M. poschiavinus) and in tobacco mouse hybrids. Experientia. 1969;25:875–6. doi: 10.1007/BF01897931. [DOI] [PubMed] [Google Scholar]
- 16.Malik HS. The centromere-drive hypothesis: a simple basis for centromere complexity. Prog Mol Subcell Biol. 2009;48:33–52. doi: 10.1007/978-3-642-00182-6_2. [DOI] [PubMed] [Google Scholar]
- 17.Walsh JB. Rate of accumulation of reproductive isolation by chromosome rearrangements. Am Nat. 1982;120:510–532. [Google Scholar]
- 18.Medarde N, López-Fuster MJ, Muñoz-Muñoz F, Ventura J. Spatio-temporal variation in the structure of a chromosomal polymorphism zone in the house mouse. Heredity (Edinb) 2012;109:78–89. doi: 10.1038/hdy.2012.16. [DOI] [PMC free article] [PubMed] [Google Scholar]
- 19.Mitsainas GP, Giagia-Athanasopoulou EB. Studies on the Robertsonian chromosomal variation of Mus musculus domesticus (Rodentia, Muridae) in Greece. Biol J Linn Soc. 2005;84:503–513. [Google Scholar]
- 20.Henikoff S, Ahmad K, Malik HS. The centromere paradox: stable inheritance with rapidly evolving DNA. Science. 2001;293:1098–102. doi: 10.1126/science.1062939. [DOI] [PubMed] [Google Scholar]
- 21.Shurtliff QR. Mammalian hybrid zones: a review. Mamm Rev. 2013;43:1–21. [Google Scholar]
- 22.Hauffe HC, Giménez MD, Searle JB. Evolution of the House Mouse. Cambridge University Press; 2012. Chromosomal hybrid zones in the house mouse; pp. 407–430. [Google Scholar]
Associated Data
This section collects any data citations, data availability statements, or supplementary materials included in this article.