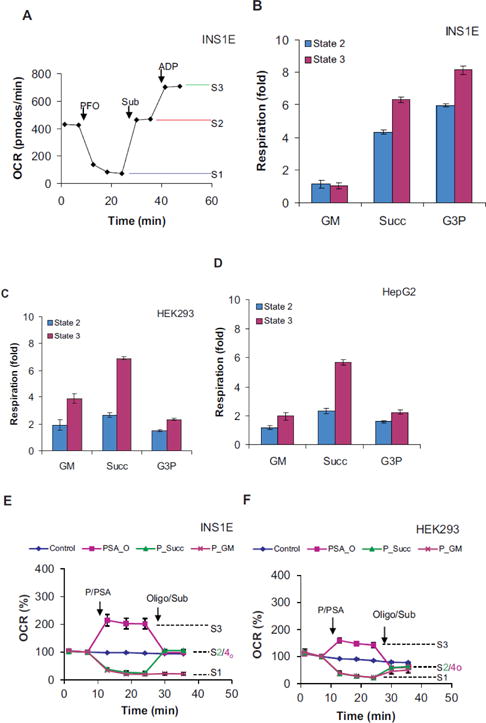
Figure 2.

Respiratory coupling test on different substrates: ADP-stimulated respiration of INS1E (A, B, E), HEK293 (C, F) and HepG2 (D) cells were measured in Ca2+-free LKB containing 16.7 mM glucose. A) A typical trace showing State 1 (S1), 2 (S2) and 3 (S3) respiration in permeabilized cells. Injection- PFO: 1 nM nPFO; Sub: indicated substrates (GM: glutamate+malate, Succ: succinate; G3P: glycerol-3-phospahte); ADP: 1 mM ADP. B–D) State 2 vs. 3 respirations in INS1E (B), HEK293 (C) and HepG2 (D) cells. Fold stimulation over State 1 are shown. E, F) Respiratory trances showing State 2 vs. 4o. Oligomycin insensitive respiration in the presence of a substrate (e.g. succinate) and ADP in permeabilized cells was taken as State 4o. Injections- P/PSA: buffer (control) or 1 nM PFO (all groups but control) or 10 mM succinate with 1 mM ADP (PSA_O); Oligo/Sub: 10 mM succinate (P_Succ), glutamate with malate (10 mM, P_GM), 2μg/ml oligomycin (PSA_O). P, S, A and Sub denote PFO, succinate, ADP and substrate(s) respectively. Data mean ± SD (n= at least 3 wells/group) from one representative experiment for each cell type are shown. Average of averages from 3 independent replicates were used to determine statistical significance by student’s t tests for the differences in INS1E State 3/2 and State 2/4 ratio vs. HEK293 or HepG3 cells on each substrate as described in text.
