

Abstract
Defatted peanut flour is rich source of protein and popularly use for fortification of different food products. Pasta was prepared using semolina, whereas defatted peanut flour and carrot powder were added for fortification. Response surface methodology was used to analyze the effect of peanut flour, semolina and carrot fiber on overall acceptability, percent expansion, hardness, solid loss and bulk density of pasta product. A rotatable central composite design was used to develop models for the responses. It was found out that an increase in semolina to peanut flour and carrot powder ratio increased the percent solid loss and decreased the hardness of uncooked pasta. Individual contour plots of the different responses were superimposed and regions meeting the maximum overall acceptability (7.81) and hardness (26.984 kg) as well as minimum solid loss (11.47 %) and bulk density below 260 kg/m3 however percent expansion was found below 190 %. The product was acceptable at ingredient composition of 205.59 g semolina, 16.70 g peanut flour and 10 g carrot powder.
Keywords: Semolina ratio, Peanut flour ratio, Overall acceptability, Hardness, Solid loss, Bulk density
Introduction
Peanut (Arachis hypogaea) is an important legume crop. It is rich both in oil and protein content. World produces 34.05 Million Metric Ton (MMT) peanut in the year 2010. The peanut oil production is 4.91 MMT (34.81 %) of total shelled peanut seed production (Zhao et al. 2011). Around 13 % is used for seed purpose, 48.19 % is obtained as cake utilized for feed, 2 % goes as waste and remaining only 2 % available for the direct or indirect food consumption (FAO 2012).
Oil is extracted from oilseed either mechanical or solvent extraction in a batch or continuous process. The high temperature in most of the efficient mechanical extractors damage the edible quality of obtained defatted materials and found not suitable for human consumption. The problem of this nature is not associated with solvent extraction. By-products derived from the harvested peanut and peanut oil extractions are peanut cake or meal, peanut skin, peanut hull and peanut vine (Zhao et al. 2011). Moreover the peanut cake or meal was used as nutritional source for the manufacture of bakery products (Ory and Conkerton 1983) like cookies (Tate et al. 1990), breads (Jan et al. 2003) and chapattis (Bhat 1977), breakfast cereals (Coccodrilli et al. 1979), peanut butter (Lima et al. 2000) and popular drinks (Holsinger et al. 1978). Pasta can be made fortified by combination of soy (Lamacchia et al. 2010), sweet potato and soy (Limroongreungrat and Huang 2007), edible Japanese seaweed and wakame (Prabhasankar et al. 2009) and marine foods (Kadam and Prabhasankar 2010) with semolina.
Dietary fiber is a healthy food ingredient (Dhingra et al. 2012) which contents nonstarch polysaccharide substances including cellulose, hemi-cellulose, pectins, mucilage and gums that are resistant to digestion by alimentary enzyme in human and most animals. Carrot is one of the important root vegetables rich in bioactive compounds like carotenoids and dietary fibers with appreciable levels of several other functional components having significant health-promoting properties (Sharma et al. 2012). Carrot juice yield reported to be only 60–70 % and one third of the raw material remain as pomace which is mainly disposed as feed or fertilizer which contains large amount of valuable compounds such as carotenes and dietary fiber. Therefore carrot residue can be utilized for repairing bread (Ohsawa et al. 1994), cake, dressing and pickles (Ohsawa et al. 1995), and for the production of functional drinks (Henn and Kunz 1996).
Response surface methodology (RSM) is an effective statistical technique for the investigation of complex processes. The main advantage of RSM is the reduced number of experimental runs needed to provide sufficient information for statistically acceptable result (Giovanni 1983). It is a faster and less expensive method for gathering research result than the classical method. RSM has successfully been applied for the development and optimization of the cereal products (Thakur and Saxena 2000; Singh et al. 2004; Chakraborty et al. 2011; Vijayakumar and Boopathy 2012).
The nutritional value of pasta is not very high as it is rich in starch, significantly low concentration of protein, devoid of dietary fiber. Incorporation of protein rich and high fiber material enhance the nutritional and functional quality of pasta (Chalamaiah et al. 2011; Kaur et al. 2011; Sudha and Leelavathi 2011). The defatted peanut meal if utilized for the food purpose may prove in solving the existing problem of protein calorie malnutrition (PEM). Considering the above facts the present study was undertaken to prepare the peanut base fiber rich pasta.
Materials and methods
Materials
Semolina, carrot, salt and fat were procured from local market of Sangrur, Punjab. Juice of fresh carrot was extracted using juicer (Ajanta, India) and residue was dehydrated in cabinet dryer at 70 °C for 6 h. Particle size of dehydrated residue was reduced for use in pasta preparation. Punjab-1 peanut verity was procured from Ludhiana market. It was powdered and defatted using hexane as solvent. The residual hexane of defatted peanuts flour was removed using vacuum oven. The vacuum of 720 mmHg and temperature 70 °C up to 8 h was used. A pasta making machine (Extruder, model: Dolly; La Monforrina, Asti, Italy) was used in the present study.
Processing of pasta
Pasta was prepared by mixing semolina, defatted peanut flour and carrot fiber along with constant proportions of salt and fat, 3 % and 5 % respectively (Table 2). Water was added to the raw ingredients to make the mixture of about 30 % moisture content. Mixing and kneading the mass for 15 min was done to produce stiff, plastic, homogeneous dough. The dough was then passed through an extruder at specified pressure and a series of die orifice. The extruded product (tubular shape with a ribbed surface of 0.92 mm thickness, 5.3 mm external diameter and 32.0 mm length) were cut into pieces of uniform size with a knife moving over the outer die surface. Extruded samples were dried in cabinet drier at 60 °C for 30 min and packed in commercially available low density pouches (Singh et al. 2004).
Table 2.
Central composite rotatable design (CCRD) for the preparation of pasta and their responses
| Expt. No | Coded levels | Composition (g) | Responses | |||||||
|---|---|---|---|---|---|---|---|---|---|---|
| X1 | X2 | A | B | C | Y1 | Y2 | Y3 | Y4 | Y5 | |
| 1 | −1 | −1 | 134 | 10 | 10 | 17.5 ± 2.50 | 170.0 ± 5.00 | 18.9 ± 7.57 | 7.2 ± 0.29 | 282.2 ± 10.12 |
| 2 | 1 | −1 | 154 | 10 | 10 | 10.3 ± 0.58 | 175.0 ± 5.00 | 17.8 ± 6.74 | 7.2 ± 0.29 | 271.4 ± 10.01 |
| 3 | −1 | 1 | 201 | 20 | 10 | 7.5 ± 2.50 | 145.0 ± 5.00 | 24.2 ± 4.11 | 7.7 ± 0.29 | 263.2 ± 10.42 |
| 4 | 1 | 1 | 231 | 20 | 10 | 9.7 ± 0.58 | 121.7 ± 2.89 | 34.7 ± 9.89 | 8.7 ± 0.29 | 310.1 ± 07.21 |
| 5 | −1.414 | 0 | 162.32 | 15 | 10 | 7.7 ± 0.29 | 206.7 ± 7.64 | 34.6 ± 16.15 | 8.0 ± 0.29 | 321.3 ± 08.56 |
| 6 | 1.414 | 0 | 197.68 | 15 | 10 | 10.0 ± 2.50 | 162.2 ± 6.31 | 33.2 ± 14.71 | 8.0 ± 0.00 | 312.2 ± 06.01 |
| 7 | 0 | −1.414 | 129.09 | 7.93 | 10 | 14.5 ± 0.50 | 203.3 ± 5.77 | 13.3 ± 3.49 | 7.3 ± 0.29 | 282.3 ± 10.31 |
| 8 | 0 | 1.414 | 230.91 | 22.07 | 10 | 13.7 ± 1.25 | 203.7 ± 3.31 | 25.3 ± 12.76 | 7.9 ± 0.29 | 302.3 ± 06.32 |
| 9 | 0 | 0 | 180 | 15 | 10 | 13.7 ± 1.25 | 205.0 ± 5.00 | 14.9 ± 1.89 | 7.6 ± 0.29 | 260.4 ± 10.52 |
| 10 | 0 | 0 | 180 | 15 | 10 | 13.7 ± 1.25 | 205.0 ± 5.00 | 24.4 ± 7.26 | 7.7 ± 0.29 | 241.6 ± 10.12 |
| 11 | 0 | 0 | 180 | 15 | 10 | 13.5 ± 0.50 | 205.0 ± 5.00 | 19.5 ± 12.53 | 7.7 ± 0.58 | 252.3 ± 08.02 |
| 12 | 0 | 0 | 180 | 15 | 10 | 13.3 ± 1.53 | 175.0 ± 5.00 | 21.6 ± 3.82 | 7.7 ± 0.29 | 256.2 ± 07.01 |
| 13 | 0 | 0 | 180 | 15 | 10 | 13.8 ± 1.04 | 206.7 ± 7.64 | 10.1 ± 8.69 | 7.7 ± 0.29 | 265.2 ± 10.13 |
(n = 3), Y1- Solid loss(%), Y2- Expansion after cooking(%), Y3- Hardness(kg), Y4-Overall acceptability, Y5-Bulk density(kg/m3)
Quality characteristics of pasta
The prepared pasta was tested to establish the maximum sensory score, percent expansion, hardness and minimum solid loss. The values are average of triplicate determination.
Percent expansion (after cooking)
Ten gm of pasta was taken in measuring cylinder which content 50 ml of oil. The amount of oil layer displace gave the volume of uncooked sample (V1). The sample was cooked at boiling water for 5 min. Cooked sample was transferred in to measuring cylinder containing oil and volume of cooked sample was noted (V2). Percent expansion after cooking was calculated as below (Bayram et al. 2004).
 |
Solid loss
Ten gram of pasta was weighed and cooked it in 200 ml boiling water for 5 min. The cooked sample was taken out from water and cooking water was drained into 250 ml volumetric flask and volume was made up to 250 ml. 10 ml of cooking water was evaporated in an hot air oven at 100 °C to determine the weight of residue (Singh et al. 2004; Bruneel et al. 2010; Petitot et al. 2010).
 |
Where, A = weight of residue, B = Volume of cooking water (250 ml), C = Initial sample weight (10 g), D = Volume of sample taken for residual estimation (10 ml).
Hardness
The hardness of the uncooked pasta was carried out using Kramer Shear Cell of a texture analyzer (model TA-XT2; Stable Micro Systems, Haslemere, UK) under the fallowing conditions and values of hardness were obtained using the developed macro in the software Texture Expert version 1.22. Load cell- 25 kg (force in compression), Pre test speed- 2 mm/s, Test speed- 2 mm/s, Post test speed- 10 mm/s, Distance - 5 mm, Trigger- 5 g, Data Acquisition Rate- 200pps, Probe Type- 5-Bladed Kramer Shear Cell (HDP/KS5) using 50 kg load cell (Carini et al. 2009; Carini et al. 2010; Petitot et al. 2010).
Sensory evaluation
Sensory analyses of cooked pasta were carried out using nine point hedonic scales (Ranganna 1986) by semi trained panel of 15 members. Various parameters like color, appearance, texture and taste were taken for analysis and average of these parameters was considered as overall acceptability.
Bulk density
Twenty gram of uncooked pasta was weighed and put in 100 ml measuring cylinder. Volume occupied by pasta was measured and bulk density was calculated as follows.
 |
Experimental design and statistical analysis
The experiments were designed, considering that overall acceptability, percent expansion, hardness and solid loss of the product were functionally related to specific composition, and attempt were made to fit multiple regression equation describing responses to quality composition.
Ingredients were formulated using varying ratio of semolina, peanut flour and carrot fiber whereas salt and fat percents were kept constant. The ingredients compositions at design center point were taken as semolina (A) 180 g, peanut flour (B) 15 g and carrot fiber (C) 10 g.
Ingredients were converted to ratios which were varied independently to fit in multiple factor analysis (Singh et al. 2004; Thakur and Saxena 2000). The ratios selected for this experiment were given as follows.
 |
The design depends upon the symmetric selection of variation increments about the center composition. The levels of variations were chosen to be within the increments, since interpretation of the result was valid only within the experimental limits. The increments of variation for each variable, spaced around the center point ratio are presented in Table 1.
Table 1.
Experimental increment values of coded levels for preparing pasta
| Symbol | Levels | |||||
|---|---|---|---|---|---|---|
| Coded | Uncoded | −1.414 | −1 | 0 | 1 | 1.414 |
| X1 | x1(Semolina Ratio) | 6.49 | 6.70 | 7.20 | 7.70 | 7.91 |
| X2 | x2(Peanut Flour Ratio) | 0.79 | 1.00 | 1.50 | 2.00 | 2.21 |
All the experiments were carried out in triplicate. A central composite rotatable design (CCRD) was used to evaluate the combined effect of different variables on its product quality (Table 2). The design matrix is a 22 factorial design combined with 5 central points and 4 axial points where one variable is set at an extreme level (±1.414) while other variables are set at their central points (Montgomery 1996).
Response surface methodology (RSM) was used to determine the effect of variables on product quality. A second degree polynomial equation (Eqn.1) was fitted in each response to study the effect of variables and to describe the process mathematically.
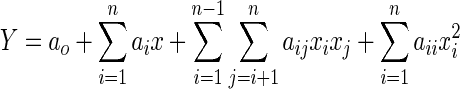 |
1 |
Where, ao, ai, aii and aij are the regression coefficients and xi, xj are the coded levels of independent variables i and j.
Data were processed using statistical software, Design-Expert 6.0 program including ANOVA to obtain the interaction between the process variables and the responses. Model adequacy was evaluated using F ratio and coefficient of determination (R2) represented at 1, 5 and 10 % level of significance accordingly.
Results and discussion
Validation of the fitted model
Responses for all the experimental design are given in Table 2. The linear, quadratic and interaction effects were calculated for each model. The regression coefficients and correlation coefficients for each model are shown in Table 3. The correlation coefficients for the responses solid loss, hardness, overall acceptability and bulk density are quite high for response surfaces and indicate that fitted quadratic model accounted for more than 80 % of the variance in the experiment data which were found to be highly significant. However ingredient formulation doesn’t have significant effect on percent expansion after cooking. Based on t-statistics, the only regression coefficient significant at 95 and 99 % levels were selected for developing the model as follows:
 |
Table 3.
Coefficients for different responses for preparing pasta
| Factors | Estimated Coefficients | ||||
|---|---|---|---|---|---|
| Y1 | Y2 | Y3 | Y4 | Y5 | |
| X0 | 13.63 | 199.33 | 18.12 | 7.60 | 250 |
| X1 | −0.21 | −10.15 | 0.921 | 0.12 | 3.232 |
| X 2 | −1.47* | −9.72 | 4.87* | 0.33** | 6.036 |
| X21 | −2.46** | −17.71 | 7.21** | 0.14 | 260** |
| X22 | 0.19 | −8.17 | −0.063 | −0.059 | 130 |
| X12 | 2.34* | −7.08 | 2.876 | 0.26* | 150 |
| R 2 | 0.800 | 0.449 | 0.828 | 0.851 | 0.819 |
** Significant at p ≤ 0.01, * Significant at p ≤ 0.05
With an increase in semolina ratio, solid loss was slightly increased and then subsequently decreased with further increase in semolina ratio as well as hardness and bulk density were decreased till design center point and then increased with increase in semolina ratio. This might be due to high percent of wheat protein in the mixture which help for better binding of pasta. With an increase in peanut flour ratio, solid loss was found more prominent as well as hardness and overall acceptability was found to be increased. This may be due to substitution of semolina by peanut flour attributed to the structural changes in the protein network, which reflected on the solid loss. Increase in solid loss by substitution of semolina with defatted corn, cassava, and cowpea were also reported by Granito et al. (2002) and with germinated pigeon pea flour by Torres et al. (2007) in pasta products. However peanut flour ratio had a quadratic positive effect on bulk density. An increase in semolina ratio combined with an increasing peanut flour ratio was found to increase hardness and overall acceptability of pasta. Although with an increase in peanut flour ratio combined with a decreasing semolina ratio was found to increase solid loss during cooking of pasta. Zhao et al. (2005) reported that with an incorporation of legume flours for spaghetti, cooking loss and firmness increased with an increase in legume flour addition.
Analysis of variance
An analysis of variance was calculated for selected model to assess how well the model fitted to the data. An analysis of variance for all the responses is presented in Table 4. The F-value for solid loss, hardness, overall acceptability and bulk density (5.71, 5.24, 6.89, and 5.22) were significant at 95 % probability level. On this basis it can be concluded that the selected models adequately represent the data for solid loss, hardness, overall acceptability and bulk density. There was no outlier in the regression model.
Table 4.
Analysis variance for different models
| Responses | Sources of | d. f. | Sum of | Mean | F-value |
|---|---|---|---|---|---|
| Variation | squares | square | |||
| Y1 | Regression | 5 | 83.14 | 16.63 | 5.71* |
| Residual | 7 | 20.40 | 2.91 | ||
| Total | 12 | 103.54 | |||
| Y3 | Regression | 5 | 600.57 | 120.11 | 5.24* |
| Residual | 7 | 160.47 | 22.92 | ||
| Total | 12 | 761.04 | |||
| Y4 | Regression | 5 | 1.43 | 0.29 | 6.89* |
| Residual | 7 | 0.29 | 0.041 | ||
| Total | 12 | 1.72 | |||
| Y5 | Regression | 5 | 6233.58 | 1246.72 | 5.22* |
| Residual | 7 | 1673.42 | 239.06 | ||
| Total | 12 | 7079.00 |
* p ≤ 0.05, d.f. Degree of freedom
Conditions for optimum responses
The criteria of maximum overall acceptability (OAA), minimum percent solid loss and other variables in the range were taken for the optimization of ingredient formulation for preparing pasta. The optimized condition found was X1 at 1 and X2 at 0.34 coded levels. At the optimum point ingredients composition found was 205.59 g semolina, 16.70 g peanut flour and 10 g carrot powder.
The response surfaces were obtained by plotting graph between two variables which gives the optimum response in the equations of Y1, Y3, Y4 and Y5. The effect of semolina and peanut flour ratio on solid loss of cooked pasta, hardness of uncooked pasta, overall acceptability of cooked pasta and bulk density of uncooked pasta are presented in Figure 1. The percent solid loss was found maximum with high percent of peanut flour in the semolina (Figure 1A). The hardness was found decreased because of increased semolina to peanut flour ratio (Figure 1B). The high overall acceptability might be because of higher semolina to peanut flour and carrot powder ratio (Figure 1C). The bulk density of uncooked pasta found to be increased with increased in semolina to peanut and carrot powder ratio (Figure 1D).
Fig. 1.

Effect of semolina and peanut flour ratio on a Solid loss of cooked pasta, b Hardness of uncooked pasta, c Overall acceptability of pasta and d Bulk density of uncooked pasta
Optimization by graphical methods
Optimum area was found out by superimposing contour graph for all the responses, using ingredient level that established limits of acceptable quality for each factor as shown in Fig. 2. Since the optimum processing variables for each response did not fall exactly in the same region in the two dimensional space formed by the ingredient levels, constraints were selected so that all responses met their optimum acceptable region with the same ingredient level. It was assumed that a score of OAA from 7.58 to 8.00, solid loss from 12.62 % to 14.25 %, hardness from 18.53 kg to 24.38 kg, bulk density below 260 kg/m3 and percent expansion found below 190 % were acceptable. Superimposing the individual contour plots for the response variables resulted in the identification of a region (Shown by the middle dark area) which satisfy all the constraints as shown in Fig. 2. At this superimposition, the predicted values of OAA, solid loss and hardness were 7.81, 11.47 % and 26.984 kg respectively. However it may not be advisable to set the experimental conditions very rigid and therefore a tolerance level has been given to each process variable and response. Hence, the final optimum conditions are given in Table 5. The product of optimized level was prepared and found 11.51 ± 1.65 moisture, 4.57 ± 0.54 fat, 18.68 ± 1.98protein, 1.93 ± 0.08 ash and 4.53 ± 0.67 crude fiber content.
Fig. 2.

Superimposed contour plots for all the responses affected by the ingredient level for pasta
Table 5.
Values for optimum responses
| Variables | Coded Values (ratio) | Actual Values |
|---|---|---|
| Semolina | −0.66 to 0.65 | 158.47 to 199.80 g |
| Peanut flour | −0.56 to 0.66 | 12.20 to 18.30 g |
| Carrot powder | – | 10 g |
The coded values were first decoded into actual ratios as per the equation in Table 1 and these ratios (x1 and x2) were transformed into actual variables (A and B) by solving the algebraic equation as describe in the experimental section.
Conclusion
The peanut base fiber rich pasta was prepared effectively by optimizing the ingredient levels using RSM with a minimum number of experiments. During this study it was observed that peanut flour and carrot powder significantly affected the pasta quality and increase in semolina to peanut flour and carrot powder ratio increased the percent solid loss and decreased the hardness of uncooked pasta. This pasta will solve the problem of protein calorie malnutrition (PEM) of people who are habitual to eat pasta in their daily life and provide the dietary fiber for solving the problem of constipation due to junk food.
References
- Bayram M, Oner MD, Eren S. Effect of cooking time and temperature on the dimensions and crease of the wheat kernel during bulgur production. J Food Engg. 2004;64:43–51. doi: 10.1016/j.jfoodeng.2003.09.011. [DOI] [Google Scholar]
- Bhat CM. Effect of incorporation of soy flour, peanut flour and cottonseed flour on the acceptability and protein quality of chapattis. Diss Abstr Int. 1977;38(2):615. [Google Scholar]
- Bruneel C, Pareyt B, Brijs K, Delcour JA. The impact of the protein network on the pasting and cooking properties of dry pasta products. Food Chem. 2010;120:371–378. doi: 10.1016/j.foodchem.2009.09.069. [DOI] [Google Scholar]
- Carini E, Vittadini E, Curti E, Antoniazzi F, Viazzani P. Effect of different mixers on physicochemical properties and water status of extruded and laminated fresh pasta. Food Chem. 2010;122:462–469. doi: 10.1016/j.foodchem.2009.05.031. [DOI] [Google Scholar]
- Carini E, Vittadini E, Curti E, Antoniazzi F, Viazzani P. Effects of different shaping modes on physico-chemical properties and water status of fresh pasta. J Food Engg. 2009;93:400–406. doi: 10.1016/j.jfoodeng.2009.02.002. [DOI] [Google Scholar]
- Chakraborty SK, Kumbhar BK, Chakraborty S, Yadav P. Influence of processing parameters on textural characteristics and overall acceptability of millet enriched biscuits using response surface methodology. J Food Sci Technol. 2011;48(2):167–174. doi: 10.1007/s13197-010-0164-4. [DOI] [PMC free article] [PubMed] [Google Scholar]
- Chalamaiah M, Balaswamy K, Rao NG, Rao PGP, Jyothirmayi T (2011) Chemical composition and functional properties of mrigal (Cirrhinus mrigala) egg protein concentrates and their application in pasta. J Food Sci Technol. doi:10.1007/s13197-011-0357-5 [DOI] [PMC free article] [PubMed]
- Coccodrilli G, Shah N, Sommer S, Ali R. Bioavailability of zinc from ready-to-eat breakfast cereals, wheat bran, and defatted peanut flour. Fed Proc. 1979;38(3):558. [Google Scholar]
- Dhingra D, Michael M, Rajput H, Patil RT. Dietary fibre in foods: a review. J Food Sci Technol. 2012;49(3):255–266. doi: 10.1007/s13197-011-0365-5. [DOI] [PMC free article] [PubMed] [Google Scholar]
- FAO (2012) Oilseeds, oils and meals. Food and Agriculture Organization of United Nations. http://www.fao.org/docrep/011/ai482e/ai482e06. Accessed 20 February 2012
- Giovanni M. Response surface methodology and product optimisation. Food Technol. 1983;37:41–45. [Google Scholar]
- Granito M, Frías J, Doblado R, Guerra M, Champ M, Vivdal-Valverde C. Nutritional improvement of beans (Phaseolus Vulgaris) by natural fermentation. Eur Food Res Technol. 2002;214:226–231. doi: 10.1007/s00217-001-0450-5. [DOI] [Google Scholar]
- Henn T, Kunz B. Use of plant pomace for manufacture of functional drinks. Fluessiges Obst. 1996;63(12):715–719. [Google Scholar]
- Holsinger VH, Sutton CS, Vettel HE, Allen C, Talley FB, Woychik JH. A Beverage base from cheese whey and peanut flour. Peanut Sci. 1978;5(2):97–101. doi: 10.3146/i0095-3679-5-2-10. [DOI] [Google Scholar]
- Jan M, Mahmood F, Zeb A, Chaudry MA. Nutritional and technological evaluation of wheat bread supplemented with peanut and soybean flours. Pak J Sci Ind Res. 2003;46(1):68–69. [Google Scholar]
- Kadam SU, Prabhasankar P. Marine foods as functional ingredients in bakery and pasta products. Food Res Int. 2010;43:1975–1980. doi: 10.1016/j.foodres.2010.06.007. [DOI] [Google Scholar]
- Kaur G, Sharma S, Nagi HPS, Ranote PS (2011) Enrichment of pasta with different plant proteins. J Food Sci Technol. doi:10.1007/s13197-011-0404-2 [DOI] [PMC free article] [PubMed]
- Lamacchia C, Baiano A, Lamparelli S, Padalino L, Notte EL, Luccia AD. Study on the interactions between soy and semolina proteins during pasta making. Food Res Int. 2010;43(4):1049–1056. doi: 10.1016/j.foodres.2010.01.016. [DOI] [Google Scholar]
- Lima IM, Guraya HS, Champagne ET. Improved peanut flour for a reduced fat peanut butter product. J Food Sci. 2000;65(5):854–861. doi: 10.1111/j.1365-2621.2000.tb13600.x. [DOI] [Google Scholar]
- Limroongreungrat K, Huang Y. Pasta products made from sweetpotato fortified with soy protein. Lebensmittel Wissenschaft and Technologies. 2007;40:200–206. doi: 10.1016/j.lwt.2005.09.012. [DOI] [Google Scholar]
- Montgomery DC. Introduction to statistical quality control. 3. New York: Wiley; 1997. [Google Scholar]
- Ohsawa K, Chinen C, Takanami S, Kuribayashi T, Kurokouchi K (1994) Studies on effective utilization of carrot pomace. I. Effective utilization to bread. Res Rep Nagano State Lab Food Technol 22:24–28
- Ohsawa K, Chinen C, Takanami S, Kuribayashi T, Kurokouchi K (1995) Studies on effective utilisation of carrot pomace. II. Effective utilisation to cake, dressing and pickles. Res Rep Nagano State Lab Food Technol 23:15–18
- Ory RL, Conkerton EJ. Supplementation of bakery items with high protein peanut flour. J Am Oil Chem Soc. 1983;60(5):986–989. doi: 10.1007/BF02660213. [DOI] [Google Scholar]
- Petitot M, Boyer L, Minier C, Micard V. Fortification of pasta with split pea and faba bean flours: Pasta processing and quality evaluation. Food Res Int. 2010;43:634–641. doi: 10.1016/j.foodres.2009.07.020. [DOI] [Google Scholar]
- Prabhasankar P, Ganesan P, Bhaskar N, Hirose A, Stephen N, Gowda LR, Hosokawa M, Miyashita K. Edible Japanese seaweed, wakame (Undaria pinnatifida) as an ingredient in pasta: Chemical, functional and structural evaluation. Food Chem. 2009;115:501–508. doi: 10.1016/j.foodchem.2008.12.047. [DOI] [Google Scholar]
- Ranganna S (1986) Proximate Constituents. In: Handbook of analysis and quality control for fruits and vegetable products. Tata Mc Graw Hill Publishing Co. Ltd. New Delhi, pp 1–30
- Singh S, Raina CS, Bawa AS, Saxena DC. Sweet potato based pasta product: optimization of ingredient levels using RSM. Int J Food Sci Tech. 2004;39:191–200. doi: 10.1046/j.0950-5423.2003.00764.x. [DOI] [Google Scholar]
- Sharma KD, Karki S, Thakur NS, Attri S. Chemical composition, functional properties and processing of carrot- a review. J Food Sci Technol. 2012;49(1):22–32. doi: 10.1007/s13197-011-0310-7. [DOI] [PMC free article] [PubMed] [Google Scholar]
- Sudha ML, Leelavathi K (2011) Effect of blends of dehydrated green pea flour and amaranth seed flour on the rheological, microstructure and pasta making quality. J Food Sci Technol. doi:10.1007/s13197-010-0213-z [DOI] [PMC free article] [PubMed]
- Tate PV, Chavan JK, Patil PB, Kadam SS. Processing of commercial peanut cake into food-grade meal and its utilization in preparation of cookies. Plant Food for Hum Nutr. 1990;40(2):115–121. doi: 10.1007/BF02193768. [DOI] [PubMed] [Google Scholar]
- Thakur S, Saxena DC. Formulation of extracted snack food (gum based cereal-pulse blend): Optimization of ingredient level using RSM. LWT Food Sci Tech. 2000;33:354–361. doi: 10.1006/fstl.2000.0668. [DOI] [Google Scholar]
- Torres A, Frias J, Granito M, Vidal-Valverde C. Germinated Cajanus cajan seeds as ingredients in pasta products: chemical, biological and sensory evaluation. Food Chem. 2007;101:202–211. doi: 10.1016/j.foodchem.2006.01.018. [DOI] [Google Scholar]
- Vijayakumar TP, Boopathy P (2012) Optimization of ingredients for noodle preparation using response surface methodology. J Food Sci Technol. doi:10.1007/s13197-012-0641-z [DOI] [PMC free article] [PubMed]
- Zhao YH, Manthey FA, Chang SKC, Home JH, Yuan SH. Quality characteristics of spaghetti as affected by green and yellow pea, lentil and chickpea flours. J Food Sci. 2005;70:371–376. doi: 10.1111/j.1365-2621.2005.tb11458.x. [DOI] [Google Scholar]
- Zhao X, Chen J, Du F (2011) Potential use of peanut by-products in food processing: a review. J Food Sci Technol. doi:10.1007/s13197-011-0449-2 [DOI] [PMC free article] [PubMed]