

Abstract
Non-wheat pasta was prepared with pearl millet supplemented with 10–30 % barley flour, 5–15 % whey protein concentrate, 2.5–4 % carboxy methyl cellulose and 27–33 % water using response surface methodology (RSM) following central composite rotatable design (CCRD). Results showed that barley flour and whey protein concentrate (WPC) had significant (p ≤ 0.05) positive effect on lightness and negative effect on stickiness of pasta, thus improved the overall acceptability (OAA). Carboxymethyl cellulose (CMC) improved the textural attributes i.e. increased firmness and decreased stickiness significantly (P ≤ 0.05) and caused a significant (P ≤ 0.05) reduction in solids losses in gruel. Based upon the experiments, the optimized level of ingredients were barley flour 13.80 g 100 g−1 pearl millet flour (PMF), WPC 12.27 g 100 g−1 PMF, CMC 3.45 g 100 g−1 PMF and water 27.6 mL 100 g−1 ingredients premix with 88 % desirability. The developed pasta had protein 16.47 g, calcium 98.53 mg, iron 5.43 mg, phosphorus 315.5 mg and β-glucan 0.33 g 100 g−1 pasta (db).
Keywords: Pasta, Pearl millet, Barley, Whey protein concentrate, Response surface methodology
Introduction
Pearl millet (Pennisetum typhoides) is an important cereal of tropical and subtropical regions of the world because of its ability to produce good yield under unfavorable conditions. India leads the world in millet production with 8.59 million tonnes (FAO 2009). Pearl millet has been used in traditional foods and is the staple crop of many regions of Asia and Africa. However, its vast potential as raw material for special purpose foods is yet to be fully exploited. Ready to eat/cook products in the form of novel foods, convenience mixes have been successfully developed from pearl millet (Balasubramanian et al. 2011, 2012); finger millet, sorghum etc., but are still to appear in the market. Pasta is a popular cereal food that comprises spaghetti, noodles, vermicelli etc. It is mostly made from durum wheat, because it maintains a desirable firm texture during cooking and had natural amber colour that is associated with good quality pasta. Various unconventional ingredients such as buckwheat, amaranth and lupin flours (Rayas-Duarte et al. 1996), finger millet flour (Devaraju et al. 2008; Shukla and Srivastava 2011) have been used to increase nutritional and functional quality of pasta and noodles. Shanthi et al. (2005) prepared composite pasta using refined wheat flour, whole wheat flour, soya flour and finger millet in different proportions and observed that nutritional quality of pasta could be enhanced using composite flour mixtures.
Few studies on non-wheat pasta products have also been carried out. Rathi et al. (2004) prepared non-wheat pasta from de-pigmented pearl millet with improved colour but observed fragile and stiff texture with lower acceptability. Singh et al. (2004) prepared sweet potato based non-wheat pasta with fragile texture and recommended consumer’s testing to validate the acceptability of sweet potato for pasta products. Huang et al. (2001) also reported that higher levels of gums with modified starch can produce non-gluten pasta similar to wheat based pasta. In general gums and thickeners such as carboxymethyl cellulose and guar gum aid in gelling, thickening, water retention and texture improvement (Gallagher et al. 2004) and can be utilized for the development of non-wheat pasta products. Sozer (2009) studied the rheological properties of rice pasta dough supplemented with proteins and gums and observed that gums are an essential part of the formulations of non-wheat pasta. Similarly, several dairy ingredients have also been used in cereal products for nutritional and functional benefits in addition to flavor and texture enhancement. Prabhasankar et al. (2007) made vermicelli from durum wheat using whey protein concentrate, ascorbic acid and glycerol mono stearate and observed that product had higher protein, improved colour and texture.
Keeping in view above findings of researchers, it was thought that probably steamed and pearled pearl millet flour incorporated with other ingredients and stabilizers may yield acceptable non-wheat pasta. Therefore, the present study was planned with an objective to optimize non-wheat pasta formulation of high nutritive value comprising pearl millet flour, barley flour and whey protein concentrate.
Materials and methods
Pearl millet (Pennisetum typhoides, var. PHB-2168) and barley (Hordeum vulgare, var. PL-807) grains were obtained from Punjab Agricultural University, Ludhiana, Punjab, India grown in the season of 2010. Grains were destoned using Destoner (Model 6276; Indosaw, Ambala, India) and stored in gunny bags at 10 °C. Whey protein concentrate (WPC, protein 70 %) was obtained from National Dairy Research Institute, Karnal, India. Laboratory grade carboxy methyl cellulose was obtained from Central Drug House, New Delhi, India. All the chemicals used for chemical analysis were of analytical grade and obtained from Central Drug House, New Delhi.
Preparation of pearl millet flour
Whole pearl millet grains were soaked in water at ambient temperature (20–35 °C) till moisture 30 ± 2 % w.b., thereafter water was drained and grains were steamed at 1.05 kg/cm2 for 15 min in order to minimize anti-nutritional factors (Shobhana and Malleshi 2007). Steamed grains were dried to 14 ± 1 % moisture level at 60 ± 2 °C in circulatory hot air tray drier. Subsequently, it was pearled in millet pearler (Mathesis Engineers, Hyderabad, India) with 80 % pearling efficiency and thereafter, milled to flour using pulverizer (Lakshmi Industries, Ludhiana, India). Flour obtained was sieved through 100 BSS (0.157 mm) sieve and used for pasta making. Pearl millet flour had moisture 9.8 %, protein 11.3 %, fat 4.12 %, ash 1.15 % and carbohydrates 73.03 %.
Preparation of barley flour
Whole barley grains were conditioned to 14 % moisture by adding calculated amount of water for 2 h and pearled in millet pearler (Mathesis Engineers, Hyderabad, India) with 75 % pearling efficiency, milled and sieved through 100 BSS (0.157 mm) sieve. Barley flour had moisture 10.2 %, protein 11.05 %, fat 1.15 %, ash 1.12 % and carbohydrates 74.88 %.
Experimental design
Response surface methodology was used to optimize the level of barley flour, WPC, carboxy methyl cellulose and water for pearl millet based non-wheat pasta. After preliminary trials, upper and lower levels for these variables were established. Central composite rotatable design (CCRD) was prepared to select variables level (pearl millet flour weight basis) i.e. barley flour 10–30 %, WPC 5–15 %, CMC 2.5–3.5 % and water 27–33 mL 100 g−1 ingredient premix in each experiment. The levels of these variables along with the experimental plan have been presented in Table 1. For the analysis of experimental design, it was assumed that n-mathematical functions, fk (k = 1, 2….. n), Yk in terms of m independent processing factors Xi (i = 1, 2, …., m) existed for each response variable.
Table 1.
Central composite design arrangement and response values
| Exp Nr | Variables | Responses | |||||||
|---|---|---|---|---|---|---|---|---|---|
| Barley flour, g 100 g−1 PMF | WPC, g 100 g−1 PMF | CMC, g 100 g−1 PMF | Water,mL 100 g−1 ingredient premix | Lightness | Firmness, N | Stickiness, N | Gruel loss, % | OAA | |
| 1. | 10.0 | 5.0 | 2.5 | 27.0 | 39.50 | 26.57 | 3.00 | 8.92 | 6.3 |
| 2. | 30.0 | 5.0 | 2.5 | 27.0 | 42.31 | 30.44 | 2.20 | 9.37 | 7.0 |
| 3. | 10.0 | 15.0 | 2.5 | 27.0 | 41.50 | 26.50 | 3.66 | 9.23 | 6.4 |
| 4. | 30.0 | 15.0 | 2.5 | 27.0 | 44.65 | 29.63 | 2.85 | 9.33 | 7.0 |
| 5. | 10.0 | 5.0 | 3.5 | 27.0 | 39.40 | 28.65 | 2.70 | 8.52 | 6.6 |
| 6. | 30.0 | 5.0 | 3.5 | 27.0 | 42.38 | 32.75 | 1.90 | 9.04 | 7.0 |
| 7. | 10.0 | 15.0 | 3.5 | 27.0 | 41.80 | 28.60 | 3.56 | 8.46 | 6.3 |
| 8. | 30.0 | 15.0 | 3.5 | 27.0 | 44.70 | 35.50 | 2.65 | 8.04 | 6.9 |
| 9. | 10.0 | 5.0 | 2.5 | 33.0 | 39.45 | 26.20 | 3.10 | 9.14 | 6.2 |
| 10. | 30.0 | 5.0 | 2.5 | 33.0 | 42.35 | 30.32 | 2.30 | 8.82 | 6.9 |
| 11. | 10.0 | 15.0 | 2.5 | 33.0 | 41.42 | 26.40 | 3.72 | 9.36 | 6.4 |
| 12. | 30.0 | 15.0 | 2.5 | 33.0 | 44.68 | 29.32 | 2.88 | 8.68 | 6.8 |
| 13. | 10.0 | 5.0 | 3.5 | 33.0 | 39.41 | 28.29 | 2.75 | 8.31 | 6.7 |
| 14. | 30.0 | 5.0 | 3.5 | 33.0 | 42.40 | 32.40 | 1.93 | 8.17 | 6.8 |
| 15. | 10.0 | 15.0 | 3.5 | 33.0 | 41.60 | 28.45 | 3.52 | 7.82 | 6.5 |
| 16. | 30.0 | 15.0 | 3.5 | 33.0 | 44.70 | 32.35 | 2.60 | 7.67 | 7.0 |
| 17. | 0 | 10.0 | 3.0 | 30.0 | 39.25a | 24.51a | 4.12b | 8.83 | 5.5a |
| 18. | 40.0 | 10.0 | 3.0 | 30.0 | 45.78b | 34.38 | 1.72a | 8.52 | 7.1 |
| 19. | 20.0 | 0 | 3.0 | 30.0 | 40.52 | 29.19 | 2.75 | 8.67 | 6.5 |
| 20. | 20.0 | 20.0 | 3.0 | 30.0 | 44.68 | 28.90 | 3.93 | 8.73 | 6.3 |
| 21. | 20.0 | 10.0 | 2.0 | 30.0 | 42.10 | 27.50 | 3.01 | 9.54b | 6.5 |
| 22. | 20.0 | 10.0 | 4.0 | 30.0 | 42.59 | 32.30 | 2.28 | 7.10a | 6.8 |
| 23. | 20.0 | 10.0 | 3.0 | 24.0 | 41.86 | 35.72b | 2.92 | 7.93 | 7.2 |
| 24. | 20.0 | 10.0 | 3.0 | 36.0 | 41.93 | 28.12 | 2.95 | 8.15 | 6.5 |
| 25. | 20.0 | 10.0 | 3.0 | 30.0 | 42.82 | 28.65 | 2.90 | 7.81 | 7.5 |
| 26. | 20.0 | 10.0 | 3.0 | 30.0 | 42.88 | 29.13 | 2.88 | 7.62 | 7.6 |
| 27. | 20.0 | 10.0 | 3.0 | 30.0 | 42.84 | 28.92 | 2.89 | 7.73 | 7.7 |
| 28. | 20.0 | 10.0 | 3.0 | 30.0 | 42.81 | 29.04 | 2.95 | 7.53 | 7.6 |
| 29. | 20.0 | 10.0 | 3.0 | 30.0 | 42.89 | 29.12 | 2.85 | 7.67 | 7.5 |
| 30. | 20.0 | 10.0 | 3.0 | 30.0 | 42.86 | 28.72 | 2.81 | 7.81 | 7.5 |
| 31. | 20.0 | 10.0 | 3.0 | 30.0 | 42.86 | 28.96 | 2.84 | 7.87 | 7.6 |
| 32. | 20.0 | 10.0 | 3.0 | 30.0 | 41.83 | 29.11 | 2.88 | 7.97 | 7.7b |
aMinimum
bMaximum
PMF pearl millet flour, WPC whey protein concentrate, CMC carboxy methyl cellulose, OAA overall acceptability
Full second-order equation was fitted in each response to describe it mathematically and to study the effect of variables. The equation was as follows:
 |
1 |
where, Yk = response variable, β0 is the value of the fitted response at the centre point of the design i.e. (0,0) and βi, βij, βii are the linear, quadratic and interactive regression coefficients, respectively. Xi and Xj are the coded independent variables. The magnitude of the coefficients in second order polynomials showed the effect of concerned variable on the responses.
Preparation of pasta
Weighed amount of flour and other ingredients (Table 1, exp 1–32) were put into pasta-mixer-extruder (Model Dolly; La Monferina, Asti, Italy). Measured amount of water (Table 1) was slowly added, mixed and kneaded into stiff, plastic and homogenous dough. The dough was extruded through the die into rotini (spiral) shape and cut into 4 cm length using a cutter attached to the pasta extruder. The extruded pasta was dried in tray drier with air circulation at 60 ± 2 °C for 60–65 min to moisture content of 8–9 %, cooled and stored under ambient conditions (20–35 °C) in air tight plastic containers.
Cooking of pasta
Pasta sample (25 g) was cooked in 250 mL of boiling water until the centre core disappeared (checked by pressing between two glass slides). It took 4 min and 30 s to cook the pasta completely. The pasta was subsequently drained using a stainless steel sieve.
Assessment of cooked pasta quality
Colour
Colour of cooked pasta was measured using hunter lab colorimeter (MiniScan XE Plus; Hunter Associates Laboratory, Reston, VA, USA.). Before testing the samples, the instrument was calibrated with standard black and white tiles supplied with the instrument. Colour readings were expressed in terms of Hunter L (lightness) value ranging from black to white (0–100). Triplicate readings were taken for each sample.
Texture analysis
Texture of the cooked pasta samples was measured using Texture Analyzer (TA-HDi; Stable Micro Systems Ltd., Surrey, UK) using settings viz. 5 kg load cell, pre test speed 2.0 mm/s, test speed 10.0 mm s−1, post test speed 2.0 mm s−1, distance 110 % in compression mode (return to start) with 5-bladed shear probe. Hundred grams of cooked pasta was placed in Kramer shear cell for texture analysis. The maximum force in force-time graph was taken as firmness and the negative force was noted as stickiness. Ten measurements were taken for each sample.
Gruel loss
Twenty five grams of the sample was cooked in pan containing 250 mL of boiling water for 4 min and 30 s. The cooking water was drained into beaker and 10 mL of the cooking water was pipetted out and evaporated to dryness in hot air oven at 100 °C to determine the solids loss in the gruel and expressed as % gruel loss using AACC method 16–50 (AACC 2000).
Overall acceptability
Marketed wheat pasta was purchased, cooked in laboratory and served as control for sensory evaluation studies. A panel of 30 untrained panelists evaluated the pasta samples in terms of overall acceptability using nine point hedonic scale (Larmond 1977) from liked extremely (9) to disliked extremely (1). Four samples including control were presented at a time to the judges in plates containing 50 g sample.
Chemical analysis
Approved AACC (2000) methods were used to determine protein (46-0.01) and ash (08-01). Moisture, fat, calcium, iron and phosphorus were determined using AOAC (1995) methods. β-glucan was determined using β-glucanase method of McCleary and Glennie-Holmes (1985). Carbohydrate was calculated by subtracting the sum of moisture, protein, fat and ash from 100 (Merrill and Watt 1973).
Statistical analysis
Response surface methodology (RSM) was adopted in experimental design and analysis (Khuri and Cornell 1987). Multiple regression analysis was used to fit the model, represented by an equation, to the experimental data. Maximization and minimization of the polynomials thus fitted was done by numeric techniques, using the numerical optimization technique given in the software package (Design expert (r) software version 8.0.4.1, 2010; Minneapolis, MN, USA). A weight was assigned to each goal to adjust the shape of its particular desirability function. The goals are combined into an overall desirability function. The response surfaces for the models were plotted as a function of the two variables while keeping the other one at optimum level.
Results and discussion
Diagnostic checking of the fitted models
All the main linear, quadratic and interactive effects were calculated for each model. The estimated regression coefficients of the fitted quadratic equation as well as the correlation coefficients for each model are given in Table 2. The models were considered adequate when the multiple coefficient of correlation (R2) was more than 80 % and the lack of fit test was insignificant (Henika 1982). The (R2) values for the responses i.e. lightness, firmness, stickiness, gruel loss and overall acceptability (OAA) were 98.2, 90.5, 96.8, 90.6 and 94.5, respectively. The calculated F-values were more than the table value (2.4) for the responses indicated adequacy of the models at 5 % level of significance. Thus, all the five responses were considered adequate to describe the effect of variables on the quality of pasta samples.
Table 2.
Estimated coefficients of the fitted quadratic equation for different response
| Estimated coefficients | |||||
|---|---|---|---|---|---|
| Factors | Lightness | Firmness | Stickiness | Gruel loss | OAA |
| β 0 | 5.1521 | 83.7179 | 0.5583 | 22.8296 | −17.9958 |
| β 1 | 0.1681* | 0.1979* | 0.0294* | 0.0182 | 0.2154* |
| β 2 | 0.2587* | 0.0215 | 0.0090* | 0.0008 | 0.2058 |
| β 3 | 3.7233 | 0.6783* | −1.8833* | −3.2875* | 4.8417 |
| β 4 | 1.7469 | −3.9867* | −0.0981 | −0.5488 | 1.0014 |
| β 12 | 0.0009 | 0.0008 | 0.0003 | −0.0021 | 0.0003 |
| β 13 | −0.0020 | 0.0621 | 0.0025 | 0.0033 | −0.0100 |
| β 14 | 0.0009 | −0.0062 | 0.0001 | −0.0041 | −0.0013 |
| β 23 | 0.0143 | 0.1123 | −0.0135 | −0.0600* | −0.0150 |
| β 24 | −0.0011 | −0.1046 | 0.0012 | −0.0005 | 0.0017 |
| β 34 | −0.0046 | −0.1296 | 0.0125 | −0.0517 | 0.0250 |
| β 11 | −0.0011 | 0.0003 | 0.0001 | 0.0027* | −0.0030* |
| β 22 | −0.0034 | −0.0031 | −0.0038* | 0.0111* | −0.0110* |
| β 33 | −0.5942* | 0.5742 | 0.3150* | −0.7329* | −0.8542* |
| β 44 | −0.0290* | 0.0721* | 0.0007 | 0.0126* | 0.0182* |
| R 2, % | 98.2 | 90.5 | 96.8 | 90.6 | 94.5 |
*Significant at p ≤ 0.05, OAA Overall acceptability
Effect of variables on colour
Colour of the pasta is an important quality factor for consumers. Generally, pasta products made with refined wheat flour had higher desirability due to higher lightness value. The observed colour (L value) of the pasta with different combinations of the ingredients is presented in Table 1. It varied from 39.25 to 45.78 within the combination of variables studied. Table 2 revealed that barley flour had positive effect (p ≤ 0.05) on lightness of pasta samples at linear level. Kaur et al. (2011) also found increased brightness of wheat pasta incorporated with barley and oat bran. Figure 1(a) represented changes in lightness of pasta as function of barley flour and WPC. Both the variables had increasing effect, whereas a unit change in WPC brought higher increase in lightness as compared to barley flour. The increase in lightness value occurred due to lighter colour of barley flour and WPC as compared to pearl millet flour. Rathi et al. (2004) observed that L value of pasta prepared from de-pigmented pearl millet was higher than the pasta prepared from native pearl millet, which had grey discolouration. The dark colour in pearl millet is due to the polyphenolic pigments present in pericarp, aleurone and endosperm regions (McDonough and Rooney 1989). WPC also had positive effect (p ≤ 0.05) on lightness values. Prabhasankar et al. (2007) also observed an increased L value with addition of WPC in finger millet pasta. However, CMC and water had negative effect (p ≤ 0.05) on the lightness at quadratic level.
Fig. 1.
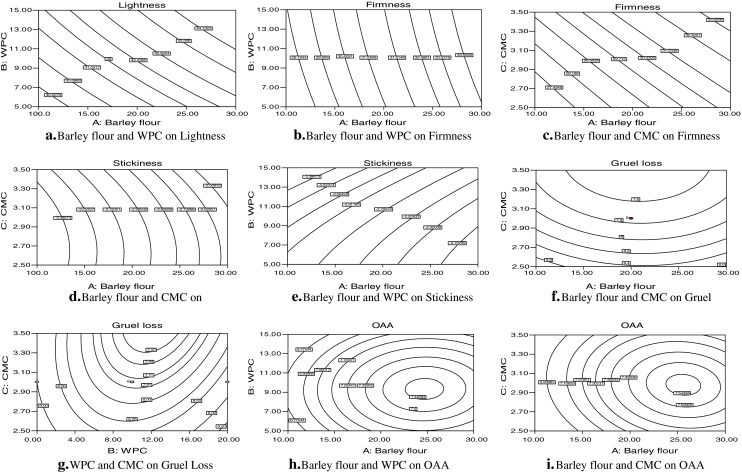
a–i Contour plots showing the effect of barley flour, whey protein concentrate (WPC), carboxymethyl cellulose (CMC) on various quality parameters of pasta
Effect of variables on texture
The observed firmness with different combinations of the ingredients varied from 24.51 N to 35.72 N within the combination of variables studied (Table 1). Regression coefficients (Table 2) showed that firmness was positively affected (p ≤ 0.05) by the barley flour at linear level. This may be partly due to the structural strength provided to pearl millet pasta by the prolamine protein present in barley flour. Similarly, CMC caused significant (p ≤ 0.05) linear increase in firmness of pasta. This occurred because, CMC acted as water binder and increased toughness and cook-resistance. A unit of 5 % increase in barley flour caused 1.2 N increase in firmness, while negligible effect of WPC was observed (Fig. 1b). It can also be observed from Fig. 1(c) that CMC had significant (p ≤ 0.05) positive effect and 0.2 % CMC increased 0.7 N firmness. It makes up for the lack of gluten in pearl millet flour that provides the strong protein network in conventional durum wheat pasta.
The observed stickiness values with different combinations of the ingredients are presented in Table 1. They varied from 1.72 N to 4.12 N within the combination of variables studied. CMC had negative effect (p ≤ 0.05) on stickiness (Table 2) at linear level. Figure 1(d) also represented that stickiness significantly (p ≤ 0.05) decreased with addition of CMC and barley flour. Chillo et al. (2007) also reported lower stickiness in pasta prepared from amaranthus using CMC. Similarly, Huang et al. (2001) reported that higher levels of xanthan gum and locust bean gum can be used to prepare non-gluten pasta with sensory properties and stickiness closest to wheat-based pasta. The regression coefficients (Table 2) showed increased stickiness due to WPC at linear level. When considering the contour graph of stickiness (Fig. 1e), it was clear that there was an increase in stickiness with increase in WPC level and decrease with barley flour. This is in agreement with the work of Prabhasankar et al. (2007) who reported increased stickiness in vermicelli pasta at high levels of whey protein concentrate (>7.5 %).
Effect of variables on gruel loss
The observed gruel loss with different combinations of the ingredients varied from 7.10 to 9.54 % within the combination of variables used (Table 1). Gruel loss decreased significantly (p ≤ 0.05) with increase in CMC level (Table 2). Figure 1(f) showed that 0.2 % increase in CMC brought 0.2 % reduction in gruel loss within the range, while barley flour also showed binding properties and brought reduction in gruel loss. These effects may be due to water absorption property of CMC and soluble barley fibres (β-glucan), which makes less available water to diffuse. Chillo et al. (2007) also observed that gruel loss in spaghetti was attributed to the binding property of CMC which slowed down the diffusion of amylose molecules from inner part to the surface. Significant (p ≤ 0.05) negative effect was observed on gruel loss due to interaction between WPC and CMC. The contour plot representing the interactive effect of WPC and CMC is shown in Fig. 1(g). It is depicted from the figure that WPC alone increased the gruel loss but when used in combination with CMC lead to decrease in gruel loss. This suggested that increase in gruel loss due to WPC can be compensated by increase in CMC level. At the quadratic level, gruel loss was positively affected (p ≤ 0.05) due to barley flour, WPC and water, whereas CMC negatively affected (p ≤ 0.05) gruel loss.
Effect of variables on overall acceptability
The observations for OAA score with different combinations of the ingredients are presented in Table 1. The experimental, minimum and maximum OAA score obtained was 5.5 and 7.7, respectively (Table 1). Barley flour had positive effect (p ≤ 0.05) on OAA of pasta (Table 2). This may be due to overall positive effect of barley flour on the lightness and firmness. Rathi et al. (2004) reported significant (p ≤ 0.05) improvement in overall acceptability with improvement in colour through de-pigmentation in pearl millet pasta. WPC and CMC also had overall positive effect (p ≤ 0.05) on OAA, which was attributed to improvement in textural attributes. Figure 1(h & i) showed changes in OAA score as function of barley flour, WPC and CMC. Figure 1(h) revealed that both WPC and barley flour increased the OAA score in the given range. Similar effect of barley flour and CMC can also be noted from Figure 1(i)
Analysis of variance
After selecting the model, analysis of variance was calculated to assess how well the responses represent the data. F-value for all the responses i.e. lightness, firmness, stickiness, gruel loss and OAA score was significant (p ≤ 0.05) (Table 3). Consequently, it can be derived that selected models adequately represented the responses.
Table 3.
Analysis of variance for different models
| Response | Sources of variance | d.f. | Sum of squares | Mean square | F-value |
|---|---|---|---|---|---|
| Lightness | Model | 14 | 88.96 | 6.35 | 64.52* |
| Residual | 17 | 1.67 | 0.01 | ||
| Cor.Total | 31 | 90.64 | – | ||
| Firmness | Model | 14 | 191.11 | 13.65 | 11.62* |
| Residual | 17 | 19.97 | 1.17 | ||
| Cor.Total | 31 | 211.08 | – | ||
| Stickiness | Model | 14 | 9.18 | 0.66 | 36.48* |
| Residual | 17 | 0.31 | 0.02 | ||
| Cor.Total | 31 | 9.49 | – | ||
| Gruel loss | Model | 14 | 11.90 | 0.85 | 11.69* |
| Residual | 17 | 1.24 | 0.07 | ||
| Cor.Total | 31 | 13.13 | – | ||
| OAA | Model | 14 | 8.32 | 0.59 | 20.66* |
| Residual | 17 | 0.49 | 0.03 | ||
| Cor.Total | 31 | 8.80 | – |
* Significant at p ≤ 0.05, OAA Overall acceptability
Optimization of level of independent variables
Optimization of level of variables was done by selecting the responses i.e. lightness, firmness, stickiness, gruel loss and OAA. Responses had direct effect on the quality and acceptability of the pasta as shown by their respective R2 values. Graphical as well as numerical optimization was done and the results were presented in Table 4. The importance level of three was assigned to each constraint and the optimized values (pearl millet flour weight basis) were barley flour 13.80 %, WPC 12.27 %, CMC 3.45 % and water 27.63 mL 100 g−1 ingredient pre-mix. Pasta was prepared using the recommended level of ingredients and the responses were measured. The developed pasta was also analyzed for its nutritional values such as protein, fat, ash and β-glucan; the corresponding values were 16.5, 2.9, 1.92, 0.33 g 100 g−1 pasta, respectively on dry weight basis. The pasta had 98.53 mg calcium, 5.43 mg iron and 315.52 mg phosphorus 100 g−1 on dry weight basis. The overlay contour plots of all responses against barley flour and WPC is shown in Fig. 2. According to the set conditions (Table 4), minimum of 13.8 g of barley flour and 12.27 g WPC 100 g−1 PMF is required to get the desired value of responses i.e. lightness ≥ 42.0, firmness ≥30.0, stickiness ≤ 3.16, gruel loss ≤ 7.7 and OAA score of ≥7.0. It is also clear that similar values can be obtained at higher (23 %) level of barley flour and lower (7 %) level of WPC. The measured responses had proximity to the predicted ones. The adequacy of the models was thus re-confirmed.
Table 4.
Constraints, criteria for optimization, solution along with predicted and actual response values
| Constraints | Goal | Lower limit | Upper limit | Predicted values | Actual response values |
|---|---|---|---|---|---|
| Barley flour, g 100 g−1 PMF | In range | 10 | 30 | 13.80 | – |
| WPC, g 100 g−1 PMF | In range | 5 | 15 | 12.27 | – |
| CMC, g 100 g−1 PMF | In range | 2.5 | 3.5 | 3.45 | – |
| Water, mL 100 g−1 ingredient premix | In range | 27 | 33 | 27.63 | – |
| Lightness | Target = 42 | 39.25 | 45.78 | 42.01 | 42.1 ± 0.51 |
| Firmness, N | Target = 30 | 24.51 | 35.72 | 30.00 | 30.1 ± 0.22 |
| Stickiness, N | Minimize | 4.12 | 1.72 | 3.17 | 3.1 ± 0.15 |
| Gruel loss, % | In range | 6.67 | 8 | 7.70 | 7.8 ± 0.20 |
| OAA | Target = 7 | 5.5 | 7.7 | 7.00 | 7.1 ± 0.15 |
PMF pearl millet flour, WPC whey protein concentrate, CMC carboxy methyl cellulose, OAA overall acceptability
Fig. 2.

Overlay plot showing the optimum level of ingredients and corresponding response values
Conclusion
Acceptable (≥7.0 OAA) non-wheat pasta can be obtained from pearl millet by incorporating barley flour (13.80 g 100 g−1 PMF), whey protein concentrate (12.27 g 100 g−1 PMF), CMC (3.45 g 100 g−1 PMF) and water (27.6 mL 100 g−1 ingredients premix) . In addition to being a diversified convenience food, such a product would be suitable for people suffering from wheat intolerance. Moreover, such value added product would be helpful in promoting utilization of pearl millet and barley with added advantage of having soluble β-glucan as well as nutritional benefits of whey protein. Developed pasta may have the advantage of being perceived by a section of the population as a pasta variety related to wellness. However, market survey is required as further studies.
References
- AACC . Approved methods of the AACC. 10. St. Paul: American Association of Cereal Chemists; 2000. [Google Scholar]
- AOAC . Official methods of analysis. 16. Arlington: Association of Official Analytical Chemists; 1995. [Google Scholar]
- Balasubramanian S, Kaur J, Singh D (2011) Optimization of weaning mix based on malted and extruded pearl millet and barley. J Food Sci Technol. doi:10.1007/s13197-011-0579-6 [DOI] [PMC free article] [PubMed]
- Balasubramanian S, Yadav DN, Kaur J, Anand T (2012) Development and shelf-life evaluation of pearl millet based upma dry mix. J Food Sci Technol. doi:10.1007/s13197-012-0616-0 [DOI] [PMC free article] [PubMed]
- Chillo S, Laverse J, Falcone PM, Del Nobile MA. Effect of carboxy methyl cellulose and pregelatinized corn starch on the quality of amaranthus spaghetti. J Food Eng. 2007;83:492–500. doi: 10.1016/j.jfoodeng.2007.03.037. [DOI] [Google Scholar]
- Devaraju B, Mushtari BJ, Begum S, Vidya K. Finger millet pasta fortified with plant and animal protein and their sensory qualities. J Dairy Foods Home Sci. 2008;27:193–195. [Google Scholar]
- FAO (2009) Production: crops. Food and Agricultural Organization of the United Nations. http://faostat.fao.org cited on 01.12.12
- Gallagher E, Gormley TR, Arendt EK. Recent advances in the formulation of gluten-free cereal-based products. Trends Food Sci Tech. 2004;15:143–152. doi: 10.1016/j.tifs.2003.09.012. [DOI] [Google Scholar]
- Henika RG. Use of response surface methodology in sensory evaluation. Food Technol. 1982;36(11):96–101. [Google Scholar]
- Huang J, Knight S, Goad C. Model prediction for sensory attributes of non-gluten pasta. J Food Qual. 2001;24:495–511. doi: 10.1111/j.1745-4557.2001.tb00626.x. [DOI] [Google Scholar]
- Kaur G, Sharma S, Nagi HPS, Dar BN (2011) Functional properties of pasta enriched with variable cereal brans. J Food Sci Technol. doi:10.1007/s13197-011-0294-3 [DOI] [PMC free article] [PubMed]
- Khuri AI, Cornell JA. Response Surfaces: design and analysis. New York: Marcel Dekker; 1987. pp. 127–145. [Google Scholar]
- Larmond E (1977) Laboratory methods for sensory evaluation of foods, Publication No. 1637, Department of Agriculture, Ottawa pp 17–22
- McCleary BV, Glennie-Holmes M. Enzymatic quantification of (1, 3), (1, 4)-β-D-glucan in barley and malt. J Inst Brewing. 1985;91:285–295. doi: 10.1002/j.2050-0416.1985.tb04345.x. [DOI] [Google Scholar]
- McDonough CM, Rooney LW. Structural characteristics of Pennisetum americanum (pearl millet) using scanning electron and florescence microscopy. Food Microstruct. 1989;81:137–149. [Google Scholar]
- Merrill AL, Watt BK (1973) Energy value of foods: basis and derivation. In: Agriculture Handbook No. 74, United States Department of Agriculture, Washington, pp 2–4
- Prabhasankar P, Rajiv J, Indrani D, Venkateswara Rao G. Influence of whey protein concentrate, additives, their combinations on the quality and microstructure of vermicelli made from Indian T durum wheat variety. J Food Eng. 2007;80:1239–1245. doi: 10.1016/j.jfoodeng.2006.09.013. [DOI] [Google Scholar]
- Rathi A, Kawatra A, Sehgal S. Influence of de-pigmentation of pearl millet (Pennisetum glaucum) on sensory attributes, nutrient composition, in vitro protein and starch digestibility of pasta. Food Chem. 2004;85:275–280. doi: 10.1016/j.foodchem.2003.06.021. [DOI] [Google Scholar]
- Rayas-Duarte P, Mock CM, Satterleei LD. Quality of spaghetti containing buckwheat, amaranth, and lupin flours. Cereal Chem. 1996;73:381–387. [Google Scholar]
- Shanthi P, Johnkennedy Z, Parvathi K, Malathi D, Thangavel K, Raghavan GSV. Studies on wheat based composite flour for pasta products. Indian J Nutr Diet. 2005;42:503–508. [Google Scholar]
- Shukla K, Srivastava S (2011) Evaluation of finger millet incorporated noodles for nutritive value and glycemic index. J Food Sci Technol. doi:10.1007/s13197-011-0530-x [DOI] [PMC free article] [PubMed]
- Singh S, Raina CS, Bawa AS, Saxena DC. Sweet potato based pasta product: optimization of ingredient levels using response surface methodology. Int J Food Sci Technol. 2004;39:191–200. doi: 10.1046/j.0950-5423.2003.00764.x. [DOI] [Google Scholar]
- Shobhana S, Malleshi NG. Preparation and functional properties of decorticated finger millet (Eleucine coracana) J Food Eng. 2007;79:529–538. doi: 10.1016/j.jfoodeng.2006.01.076. [DOI] [Google Scholar]
- Sozer N. Rheological properties of rice pasta dough supplemented with proteins and gums. Food Hydrocolloid. 2009;23:849–855. doi: 10.1016/j.foodhyd.2008.03.016. [DOI] [Google Scholar]