

Abstract
The four-stranded i-motif (iM) conformation of cytosine-rich DNA has importance to a wide variety of biochemical systems that range from their use in nanomaterials to potential roles in oncogene regulation. The iM structure is formed at slightly acidic pH, where hemiprotonation of cytosine results in a stable C-C+ basepair. Here, we performed fundamental studies to examine iM formation from a C-rich strand from the promoter of the human c-MYC gene. We used a number of biophysical techniques to characterize both the hydrodynamic properties and folding kinetics of a folded iM. Our hydrodynamic studies using fluorescence anisotropy decay and analytical ultracentrifugation show that the iM structure has a compact size in solution and displays the rigidity of a double strand. By studying the rates of circular dichroism spectral changes and quenching of fluorescent cytidine analogs, we also established a mechanism for the folding of a random coil oligo into the iM. In the course of determining this folding pathway, we established that the fluorescent dC analogs tC° and PdC can be used to monitor individual residues of an iM structure and to determine the pKa of an iM. We established that the C-C+ hydrogen bonding of certain bases initiates the folding of the iM structure. We also showed that substitutions in the loop regions of iMs give a distinctly different kinetic signature during folding compared with bases that are intercalated. Our data reveal that the iM passes through a distinct intermediate form between the unfolded and folded forms. Taken together, our results lay the foundation for using fluorescent dC analogs to follow structural changes during iM formation. Our technique may also be useful for examining folding and structural changes in more complex iMs.
Introduction
In addition to the well-known Watson-Crick DNA structure, there are a variety of other conformations of DNA, including G-quadruplexes (G4s) and i-motifs (iMs). G4s form from guanine-rich strands of DNA, whereas iMs form from cytosine-rich strands. Because of their topological variance from Watson-Crick DNA, their links to transcription and regulation (1–7), and their association with oncogene promoters (2,8–13), G4s and iMs have been studied as possible unique drug targets. G4s require a metal cation to stabilize the structure. Since potassium cations are readily available intracellularly, G4s are viable in vivo, and their existence in vivo was recently confirmed by Biffi et al. (14), who developed a structure-specific antibody that binds G4s in cells. However, because iMs require protonation of cytosines to form (Fig. 1), they have not been studied to the extent that G4s have, since the pH of the nucleus is not expected to be significantly lower than that of the cytosol (∼7.3). Recently, it was reported that iMs can be formed at neutral pH by addition of molecular crowding agents (15,16). This finding suggests that iM structures are also likely viable in vivo and deserve further study for comparison with the better-characterized G4 structures. In addition to their potential importance in vivo, iMs have been used for both therapeutic and diagnostic purposes. Biosensors and drug-delivery biomaterials have been made from iM structures to take advantage of the iMs’ pH-dependent formation, easy accessibility to intracellular spaces, biodegradability, biocompatibility, and nontoxicity (17,18). A review of these nanomaterials and their applications was recently published (19). These materials, as well as the biological applications of iMs, have increased the need to better understand the structure and formation of iMs to fully exploit their properties. One important aspect of iMs that dictates their final structure is their folding pathway. Kinetic studies of iM folding have been done using NMR (20–23), surface plasmon resonance (24), and fluorescence resonance energy transfer (25). Among these studies, only the NMR studies monitored folding by the basepairing of the cytosines; however, they used lower temperatures (0–15°C) and higher pH buffers (pH ∼6.0) to slow the kinetics of iM formation to monitor folding over much longer timescales (minutes to hours) (21,26). Very few studies have monitored C-C+ pairing on short timescales at room temperature (20–25°C). Chen et al. (27) performed one of the first studies on iM folding at room temperature using stopped-flow circular dichroism (CD) on a short (subsecond) timescale. Fluorescence spectroscopy, which can also probe short timescales, uses changes in signals from fluorescent base analogs to investigate iM folding; however, most fluorescence studies to date have focused on base substitutions in the loop and terminal regions of the iM (28,29). There is a lack of studies concerning the kinetic mechanism through which hydrogen-bonding bases stabilize the iM. By following the kinetics of quenching of fluorescence by the C-C+ pairing interactions, one can construct a folding mechanism for an iM. Such a folding mechanism would help us understand how to best control and utilize iM-based bio- and nanomaterials, and may also have biological implications for potential iM structures in gene promoters if unique folding intermediates are formed.
Figure 1.

iM structure of C-rich DNA. (A) A C-C+ hydrogen bond that forms the basis of the iM stability, with the shared proton highlighted in red. (B) An all-atom molecular model of an iM modified from PDB 1YBL (37). The bases are color coded for thymine (yellow), cytidine (red), adenine (blue), and the DNA phosphate backbone (purple).
The hydrodynamic properties of iM structures in solution have also not been fully characterized. Insights into their conformational dynamics, such as iM movement and shape in solution, could also aid in their utilization in nanodevices, since their hydrodynamic properties readily affect their diffusion in solution. Choi et al. (30) published one of the few papers that have detailed the hydrodynamics of iMs in solution. They found that the diffusion coefficient of the iM form was much greater than that of the unfolded form, showing that the hydrodynamic radius of the unfolded form was 1.6 times greater than that of the iM (30). However, they did not detail how the two forms compared to the duplex of the same strand or how rigid the structures were in solution, aside from what could be gleaned from the diffusion coefficients. Here, we used analytical ultracentrifugation (AUC) and fluorescence anisotropy decay data to gain insight into iM movement and rigidity in solution compared with other DNA structures.
In this study, we examined a variant of the C-rich strand of the NHEIII promoter (wild-type sequence: 5′-TTCCCCACCCTCCCCACCCTCCCCA-3′) from the human c-MYC gene, an oncogene that can promote tumor development (31). The wild-type sequence was well characterized by Dai et al. (32), who found that it forms a complex mixture of iM structures. However, a single C-to-T mutation at the sixth base and replacing the last four cytidines with an adenine resulted in an iM that was predominantly a single species (C20T sequence: 5′-TTCCCTACCCTCCCCACCCTAA-3′; Fig. 2) and retained the thermal stability of the unmodified sequence. In this work, we used the C20T mutant strand labeled at five positions with individual 1,3-diaza-2-oxophenoxazine (tCo) or pyrrolo-deoxycytosine (PdC) substitutions (four involved in hydrogen bonding and one in the loop; locations shown in Fig. 2). We have previously shown that inclusion of fluorescent dC base analogs on DNA does not significantly affect DNA structure (33,34). The tC° fluorescent base analog has the highest quantum yield of any known cytosine analog and is quenched in duplex DNA when basepaired to its complementary guanine (φf = 0.3 in single strand; φf = 0.2 in duplex) (35). Using these oligos, we detailed the hydrodynamics of the folded iM structure and mapped the mechanism of iM folding.
Figure 2.

Schematic of the slip structures of the C20T mutant of the NHEIII promoter iM from the c-MYC gene (32). The cytosines are shown in gray, adenines are in light gray, and thymines are in dark gray. The positions of the single fluorescent cytosine analog substitutions are numbered. The equilibrium lies far toward the right structure.
Materials and Methods
Oligos
All DNA oligos were synthesized through standard solid-phase chemistry by Midland Certified Reagent Company (Midland, TX). The oligos were stored in 10 mM Tris, 1 mM EDTA buffer (pH 8.0) until they were used. The C20T oligo sequence has a folded structure at pH < 6.0 that has been determined by NMR (32). Individual tC° and PdC substitutions were made at the 4th, 9th, 10th, 12th, and 15th positions, which correspond to the loop and bonded bases (Fig. 2). The unincorporated tC° nucleoside used as a control was obtained from Dr. Marcus Wilhelmsson (Chalmers University of Technology, Gothenburg, Sweden).
CD
In keeping with the literature on iMs, we define the pKa for iM formation as the pH at which 50% of the oligo is folded into the iM. To determine the pKa for iM folding, we made DNA solutions (4 μM) in 10 mM Tris buffers containing 10 mM KCl with pH ranging from 8.0 to 7.0, 10 mM phosphate buffers containing 10 mM KCl with pH ranging from 7.0 to 6.0, or 10 mM acetate buffers containing 10 mM KCl with pH ranging from 6.0 to 5.4. All reagents were spectroscopic grade and purchased from Fisher Scientific (Waltham, MA). To ensure that few or no intermolecular structures were formed, the solutions were heated to ∼80°C for 10 min and then cooled to room temperature. CD spectra of DNA solutions were collected on an Olis DSM 20 CD instrument (Olis, Bogart, GA) over a wavelength range of 220–350 nm at 20°C, with an integration time that adjusted with absorbance. The Δε values at 298 nm were then plotted against pH and fitted to Eq. 1. Thermal melts from 20°C to 60°C were monitored via CD to ensure that the fluorescent base analog substitutions did not induce a significant change in the iM structure or its thermal stability. Only a single transition was observed over this temperature range, and the measured Tm was independent of concentration, indicating a unimolecular species.
| (1) |
Steady-state fluorescence and fluorescence lifetime measurements
Steady-state fluorescence spectra were recorded on a K2 multifrequency cross-correlation phase and modulation fluorometer (ISS, Champaign, IL). Excitation scans were collected over a wavelength range of 220–400 nm, with the emission wavelength fixed at 450 nm. Emission spectra were taken over a wavelength range from 400 nm to 580 nm, with the excitation wavelength fixed at 350 nm. The fluorescence lifetimes of tC°-labeled and PdC-labeled DNAs were analyzed using a K2 fluorometer and a ChronosFD fluorometer (ISS). The lifetime data were collected via 40 data points taken in the frequency range of 10–250 MHz with an averaging time of 5 s per data point on the K2, and via 10 data points taken in the frequency range of 10–250 MHz with an averaging time of 1 s per data point on the ChronosFD. At least three replicates were taken for each solution. All fits included an additional lifetime for a very short-lived component (τ < 1.0 ns). In addition, anisotropy decay data were collected for the tC°-labeled DNA on the ChronosFD to measure the rotational correlation times and limiting anisotropies for the DNA under select solution conditions via 15 data points taken in the frequency range of 10–300 MHz. Rotational correlation times were found using Eq. 2 (where ri is the limiting anisotropy of component i, t is time, and θi is the rotational correlation time of component i):
| (2) |
For comparison, the longest rotational correlation times were computed by the SOMO (SOlution MOdeler) bead modeler within the UltraScan III program (36) using iM, unfolded, and duplex DNA structures. All DNA PDB files were introduced into the modeler without water or ions, allowing the program to solvate each DNA. All solvent-accessible surface area and SOMO parameters were left at their default settings. The software was also used to calculate the partial specific volume of each DNA. The folded iM structure was made by modifying the PDB 1YBL structure file (37) with Chimera to be the C20T sequence, followed by energy minimization. The unfolded and duplex DNAs were made using a Python program based on the B-DNA coordinates provided by Arnott and Hukins (38). GROMACS (39) molecular-dynamics calculations were utilized to find the various energetic minima of the unfolded DNA, which were used to sample the range of structures to which the unfolded DNA had access at room temperature (25°C). The DNA was solvated with ∼10,000 water molecules and neutralized with 19 sodium ions. Once the system containing the DNA was minimized, molecular dynamics were calculated using the MD integrator with a step size of 0.0005 ps and a total time of 10 ns, and with snapshots recorded every 1000 steps. Every 10th one of these 1000 snapshots was processed through UltraScan III (36) to calculate rotational correlation times for the single-strand DNA, which were then averaged to obtain the average rotational correlation time of the unfolded DNA at pH 8.0. These theoretical rotational correlation times are given in Table 3.
Table 3.
Fluorescence rotational correlation times (θ) of tC°-containing oligos at 25°C
| Oligo | pH 5.4 |
pH 8.0 |
Duplex |
|---|---|---|---|
| θ (ns) | θ (ns) | θ (ns) | |
| tC°4 | 1.9 ± 0.2 | 2.9 ± 0.2 | 8.3 ± 0.2 |
| tC°9 | 2.2 ± 0.1 | 3.1 ± 0.1 | 8.5 ± 0.1 |
| tC°10 | 2.6 ± 0.1 | 3.6 ± 0.1 | 9.3 ± 0.2 |
| tC°12 | 2.9 ± 0.2 | 3.7 ± 0.2 | 8.7 ± 0.1 |
| tC°15 | 2.7 ± 0.1 | 3.6 ± 0.4 | 8.9 ± 0.1 |
| Theoretical | 2.7 | 3.7 ± 0.1 | 8.8 |
AUC: experiment and data analysis
All sedimentation velocity (SV) experiments were performed using a Beckman XL-A analytical ultracentrifuge retrofitted to include a fluorescence detection system (AU-FDS; AVIV Biomedical, Lakewood, NJ). The temperature of the analytical ultracentrifuge was calibrated according to the method of Liu and Stafford (40). The 3 μM samples were loaded into centrifuge cells equipped with 1.2 cm SedVel60 centerpieces and sapphire windows. The centrifuge cells were placed into an An-60 rotor and temperature was equilibrated for ∼1 hr before the run was started. All runs were performed at 60K rpm (300,000 × g). Sedimentation was monitored by measuring one continuous scan of absorbance at 268 nm as a function of radial distance with a spacing of 0.002 cm.
We initially analyzed the SV data using a g(s∗) analysis, which is a direct boundary model that finds an apparent sedimentation coefficient distribution, via the software program DCDT2+ (41,42). The g(s∗) distribution obtained was corrected to the density and viscosity of water at 20°C (s20,W). We also analyzed the SV data via c(s) analysis, a model that uses the Lamm equation to find the sedimentation coefficient distribution, with the software program Sedfit (43). The meniscus position automatically chosen by DCDT2+ was also used in Sedfit for consistency. The s20,W obtained from the g(s∗) distribution was consistent with the s20,W obtained from the c(s) distribution. The weight average sedimentation coefficient from the g(s∗) distribution was plotted as a function of pH and fit to a sigmoidal curve using the software program Origin (OriginLab, Northampton, MA). The SV was then analyzed using direct boundary fitting with the software program Sedanal (44). For direct boundary fitting, the data sets covering the pH range were divided into three pH sections representing unfolded (pH 8.0, 7.5, and 7.0), partially folded (pH 6.5), and folded iM (pH 6.0, 5.6, 5.0, and 4.5) sequences. The high-pH data sets (pH 7.0–8.0) were globally fit to a single-species model to determine the sedimentation coefficient of the unfolded iM sequence. The low-pH (pH 4.5–6.0) data were then globally fit to a single-species model to determine the sedimentation coefficient of the folded iM sequence. The partially unfolded iM sequence was then fit to an isomerization model in which the sedimentation coefficients of the folded and unfolded conformations were fixed to the best-fit values from the low- and high-pH fits, respectively, and the equilibrium constant of the isomerization was allowed to vary until the best fit to the data was obtained. Using the sedimentation coefficients (s) thus found, the diffusion and frictional coefficients (D and ft) were obtained from Eqs. 3 and 4 (45,46), where ν is the partial specific volume of DNA (0.55 mL/g), M is molecular weight, NA is Avogadro’s number, ρsolvent is the density of the solvent (1 g/mL for dilute buffers), k is the Boltzmann constant (1.38 × 10⁻²³ J/K), and T is temperature (25°C):
| (3) |
| (4) |
Folding studies
An 8 μM solution of each oligo in pH 8.0 phosphate buffer was mixed into a cuvette with an equal amount of pH 2.4 phosphate buffer with the use of a RX-2000 Rapid Mixing Stopped-Flow Unit (Applied Photophysics, Leatherhead, Surrey, UK). The resulting pH 5.8 solution was monitored by CD at 298 nm or by fluorescence quenching. Fluorescence was collected using a 370 nm LED excitation and a 395 nm long-pass filter in the emission path. The resulting decays were analyzed and fitted using multiple models with the Berkeley Madonna modeling software (Robert Macey and George Oster, University of California, Berkeley, Berkeley, CA) to find the rate constants of folding. Steady-state fluorescence spectra and CD spectra were taken before and after mixing to ensure that folding occurred. In addition, a control oligo (5′-CCCTAACCCTAACCCTAACCC-3′) was used to ensure that our data agreed with previously published values for folding rates obtained by a similar experimental setup (27).
Results and Discussion
Analysis of thermal stability and pKa of iMs
Control experiments were performed to examine whether the tC° and PdC substitutions induced significant changes in the iM structure. Using each oligo, pH-dependent folding of the iM structure was monitored by CD. Fig. 3 A shows the CD spectra recorded for the tC°4 oligo in multiple pH solutions, which was essentially identical to the unsubstituted oligos. The other substituted oligos behaved similarly. The pKa (∼6.4; Fig. 3 B) for each oligo was found by plotting the CD signal at 298 nm at each pH and fitting the resultant graph with a sigmoidal function (Eq. 1). As shown in Table 1, the addition of tC° to the oligo had little effect on the pKa. Our pKa values agree with those determined using NMR data obtained by Dai et al. (32), who reported a pKa near 6.2. These pKa values suggest that tC° has little effect on iM formation in the C20T oligo at any location. The pKa values were also found using steady-state fluorescence quenching of tC° (Fig. 3, C and D). The pKa values obtained were identical within error to those found using CD (Table 1). In addition, AUC experiments (Fig. 4; Fig. S1 in the Supporting Material) gave a pKa value (∼6.6 at low salt (10 mM KCl); ∼6.2 at high salt (200 mM NaCl)) near those obtained from CD (∼6.4), showing that all methods are in agreement. The sedimentation coefficients obtained in these experiments also agree well with a previous AUC study performed on iM structures (47).
Figure 3.
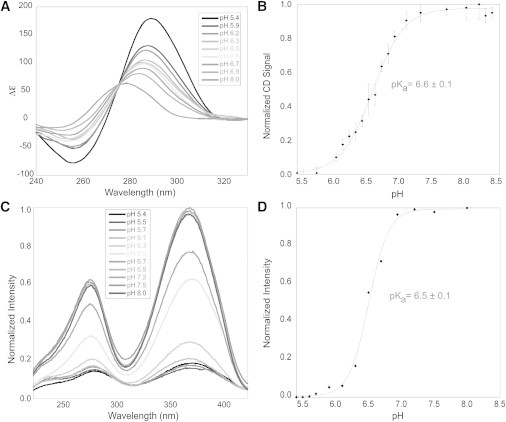
Formation of iM structures as a function of pH. (A) CD spectra of tC°4 recorded at each pH (for clarity, not all of the recorded CD spectra are shown). (B) The pKa of tC°4 was determined by monitoring the CD signal at 298 nm. (C) Fluorescence excitation spectra of tC°4 recorded at each pH. (D) The pKa of tC°4 was determined by monitoring the quenching of the fluorescence signal at 365 nm.
Table 1.
Tm and pKa values for wild-type and tC°-substituted DNA folded into the iM form
| Oligo | Tm (°C) | pKa (CD) | pKa (fluorescence) |
|---|---|---|---|
| C20T | 43 ± 2 | 6.4 ± 0.1 | N/A |
| tC°4 | 39 ± 1 | 6.6 ± 0.1 | 6.5 ± 0.1 |
| tC°9 | 39 ± 1 | 6.3 ± 0.1 | 6.4 ± 0.1 |
| tC°10 | 40 ± 3 | 6.6 ± 0.1 | 6.6 ± 0.1 |
| tC°12 | 42 ± 1 | 6.3 ± 0.1 | 6.3 ± 0.1 |
| tC°15 | 40 ± 2 | 6.3 ± 0.1 | 6.2 ± 0.1 |
Figure 4.

Sedimentation by AUC of C20T at different pH values. Inset: pKa determined from sedimentation coefficient (s20,w) values.
Thermal melts of the iMs were performed at pH 5.4 to ensure that the base substitutions did not also affect their thermal stability. As shown in Fig. S2 and Table 1, there was little change in the temperature at which 50% of the iM was melted (Tm) when compared with the wild-type C20T (∼40°C). The thermal melts and the Tm obtained match well with those reported by Dai et al. (32) for the same oligo (∼40°C). Taken together, our results indicate that the substitutions had little or no effect on the folded iM structure, its pKa, or its thermal stability.
Fluorescence lifetimes of substituted DNA bases
Fluorescence lifetime data were collected for each tC°-substituted oligo (Table S1) in three forms: folded iM (pH 5.4), unfolded single-strand (pH 8.0), and duplexed with the complementary strand (pH 8.0). The unfolded and duplexed DNA containing tC° showed only a single lifetime of ∼4.6 ns and ∼3.7 ns, respectively, independent of position. The folded iM at pH 5.4 also had a lifetime of ∼4.6 ns that accounted for ∼60% of the fluorescence, but exhibited a second shorter lifetime of ∼1.5 ns. This included position 15, which according to Dai et al. (32) should be unpaired in the folded form. To address this issue, we also examined folded PdC-substituted oligos because PdC shows a pronounced longer fluorescence lifetime when unpaired (34). Our lifetime results are presented in Table 2. Unlike tC°15, the PdC-15 lifetime is significantly longer than lifetime of the oligos substituted at other positions, suggesting that the 15th position is indeed in the loop of the iM (see also quenching data in Fig. 7). Hence, the fluorescence lifetimes of tC° can be used to monitor the global status (folded or unfolded) of the iM, but not whether a specific tC° is intercalated.
Table 2.
Fluorescence lifetimes of PdC oligos
| Oligo | pH 5.4 |
pH 8.0 (unfolded) |
|||
|---|---|---|---|---|---|
| τ (ns) | τ1 (ns) | f1 | τ2 (ns) | f2 | |
| PdC-4 | 2.2 ± 0.1 | 5.4 ± 0.1 | 0.69 ± 0.01 | 0.5 ± 0.1 | 0.31 ± 0.01 |
| PdC-9 | 2.1 ± 0.1 | 5.0 ± 0.1 | 0.52 ± 0.01 | 0.4 ± 0.1 | 0.48 ± 0.01 |
| PdC-10 | 2.6 ± 0.1 | 4.4 ± 0.3 | 0.57 ± 0.06 | 0.2 ± 0.1 | 0.43 ± 0.05 |
| PdC-12 | 2.8 ± 0.1 | 4.7 ± 0.1 | 0.64 ± 0.03 | 0.3 ± 0.1 | 0.36 ± 0.03 |
| PdC-15 | 3.5 ± 0.1 | 4.9 ± 0.1 | 0.64 ± 0.01 | 0.3 ± 0.1 | 0.36 ± 0.01 |
Figure 7.

(A) Fluorescence spectra of the tC°4 oligo recorded before (pH 8.0; red) and after (pH 5.8; dashed green) the pH jump. The fluorescence spectra of the tC° nucleoside alone before (pH 8.0; blue) and after (pH 5.8; dashed black) is shown for comparison. The free nucleoside’s fluorescence changed very little with pH compared with when it was incorporated into DNA. (B) The average fluorescence intensity decay for each tC°-substituted oligo with time after folding of the iM structure was induced by the pH change. The color code in (B) is the same as that shown in Fig. 6 (green for tC°4, red for tC°9, orange for tC°10, pink for tC°12, and navy for tC°15).
Hydrodynamics of DNA forms
Because many DNA-based nanodevices are being developed for use in aqueous environments, we determined the hydrodynamic properties of the C20T iM to better understand its size, shape, and rigidity in solution compared with its unfolded and duplexed counterparts. To determine its size and rigidity in solution, we collected fluorescence anisotropy decays of tC° for each oligo in the duplex, unfolded single-strand, and iM forms, and fitted them using Eq. 2 to find the rotational correlation times (θ). We observed shorter rotational correlation times (0.4–0.6 ns) when fitting the data for all forms of DNA, regardless of position. We attribute these to local motions of the tC°. The duplex rotational correlation times (Table 3) are consistent with a very rigid structure in solution. The unfolded single-strand DNAs at pH 8.0 have much faster rotational correlation times than the duplex form (Table 3), indicating a more compact size due to the increased flexibility of the single strand. In the iM form, the relatively short rotational correlation times indicate a more compact structure. The tC°4 and tC°9 oligos have a slightly shorter rotational correlation time compared with the other three oligos. We suggest that this arises from the position of tC°4 and tC°9, since the rotational correlation times are consistently shorter in the unfolded and duplex forms as well. The values obtained for all three forms of DNA are similar to those predicted from the molecular model of each DNA structure using Ultrascan III (theoretical value in Table 3). These values did not significantly change when the ionic strength was increased by adding 150 mM KCl (Table S2).
Additionally, AUC studies were performed to analyze the hydrodynamics of the unfolded strand and folded iM in solution. The sedimentation, frictional, and diffusion coefficients (s, ft, and D, respectively) obtained all suggest a change in structure from the spherical iM to the larger, freely moving random coil as pH is increased. This change is in good agreement with the rotational correlation times observed, indicating that the theoretical models of the DNA for all three structures accurately predict their behavior in solution.
Taken together, our hydrodynamics data characterize the iM form of DNA as being similar to the duplex form in terms of rigidity, but more compact. It may be possible to design better nanomaterials and drug-delivery vehicles by taking advantage of these features. For example, one could develop a pH-dependent nanomaterial based on single-strand DNA iMs that is smaller than its duplex counterpart but retains its structural integrity.
Kinetic mechanism of iM folding
To elucidate the folding rate of the iM, we monitored CD signal traces at 298 nm with time as the pH of the DNA solution rapidly changed from 8.0 to 5.8. Typical data are shown in Fig. 5. Spectra were taken before and after the pH change (Fig. 5 A) to ensure that folding occurred. As CD monitors the overall DNA strand folding, we consider the rate constants obtained from analyses of these data to be global. Since the signal changes were not fitted well by a single exponential function, we tested multiple models, including double-exponential, sequential, and equilibrium mechanisms. The single-strand → intermediate → folded sequential model was found to best fit the folding observed (i.e., with the lowest root mean-squared deviation values; Fig. 5 B).
Figure 5.
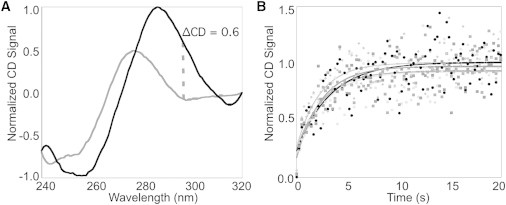
Global folding of the iM as monitored by CD. (A) Example normalized CD spectra of tC°4 recorded before (pH 8.0; gray) and after (pH 5.8; black) the pH jump. (B) Five kinetic traces for tC°4 were determined by monitoring the CD signal at 298 nm with time after the pH jump to induce folding. The solid lines show fits to the data using a three-state sequential model.
As shown in Table 4, all of the substituted oligos showed global folding that was (within error) similar to that observed for the wild-type (C20T), with two folding rate constants of ∼0.60 s−1 and ∼0.01 s−1, suggesting that tC° substitution does not affect the folding pathway of the structure. These rate constants did not change significantly when the concentration of oligo was doubled or tripled (Table S3). The fractional signal amplitude (∼0.90) associated with the faster rate constant suggests that the intermediate state is very close in structure to the final state. Consecutive mechanisms can be fitted identically in the order fast-to-slow or slow-to-fast, depending on the signal arising from the intermediate structure. Since the intermediate and final forms of the iM are so similar in CD signal, we interpret this to indicate that the faster folding step is first, followed by slower bond rearrangement. The amplitude change of the fast process supports a folding mechanism similar to that shown in Fig. 6, where the mostly folded intermediate structure is rapidly formed, followed by a slower rearrangement to yield the final iM conformation. However, the hydrogen-bonding pattern of the intermediate structure (Fig. 6 B) cannot be discerned by CD, and thus the explicit hydrogen-bonding pattern is not shown in Fig. 6 B. The global rate constants obtained for our C20T oligos are on the same timescale as those obtained from our control experiments using the iM oligo of Liu et al. (30), which has a rate constant of 0.15 s−1 for pH-dependent folding.
Table 4.
Rate constants of folding found from CD
| C20T | tC°4 | tC°9 | tC°10 | tC°12 | tC°15 | |
|---|---|---|---|---|---|---|
| Fast CD folding rate constant (s−1) | 0.61 ± 0.09 | 0.68 ± 0.11 | 0.59 ± 0.13 | 2.88 ± 0.68 | 0.59 ± 0.20 | 0.51 ± 0.07 |
| (A to B) | ||||||
| Fractional ΔCDa (A to B) | 0.89 ± 0.07 | 0.87 ± 0.07 | 0.87 ± 0.06 | 0.93 ± 0.06 | 0.88 ± 0.05 | 0.78 ± 0.10 |
| Slow CD folding rate constant (s−1) | 0.03 ± 0.02 | 0.05 ± 0.02 | 0.06 ± 0.02 | 0.03 ± 0.04 | 0.07 ± 0.02 | 0.05 ± 0.02 |
| (B to C) | ||||||
| Fractional ΔCDa (B to C) | 0.11 ± 0.04 | 0.13 ± 0.04 | 0.13 ± 0.05 | 0.07 ± 0.10 | 0.12 ± 0.02 | 0.22 ± 0.05 |
The total ΔCD signal amplitude was normalized from 0.0 (initial) to 1.0 (final). Data were fit to the mechanism in Fig. 6 (A → B → C), where the first rate is faster than the second rate.
Figure 6.
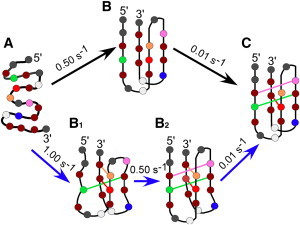
Folding mechanism for the C20T iM based on CD (top, black arrows) and fluorescence quenching data (bottom, blue arrows) where the transition from unfolded DNA (A) to intermediate structures (B1 and B2) to the final folded iM (C) is shown. Average rate constants for each step in the mechanism are given above the arrows. The color coding of residues and their hydrogen bonds is as follows: green for tC°4, red for tC°9, orange for tC°10, pink for tC°12, and navy for tC°15. The hydrogen bonds in B are not shown since they are not observable by CD; however, the pattern in B is likely similar to B2 observed in the fluorescence quenching mechanism. Overall, both CD and fluorescence can be interpreted with the same folding mechanism that progresses through intermediate structures.
To examine in detail the base-by-base mechanism of iM folding, we obtained traces of the quenching of each individual tC°. Rapid quenching of tC° was observed when the iM formed. Kinetic data were collected by monitoring fluorescence after a pH jump from 8.0 to 5.8. Typical initial and final fluorescence spectra collected in this experiment are shown in Fig. 7 A. The average fluorescence decays for each base substitution are shown in Fig. 7 B, where time zero is the initial fluorescence at pH 8.0 before mixing. We consider these fluorescence changes to reflect the local conditions of the individual dC residues during folding, which include stacking and C-C+ bond formation. The decays were fitted to the sequential model of unprotonated single-strand → protonated single-strand → intermediate → folded because this gave the lowest root mean-squared values and was consistent with the global folding mechanism. As shown in Fig. 7 B, all fluorescence quenches nearly instantaneously (within the first 0.2 s of mixing) to at least half of its initial pH 8.0 signal (corrected for dilution). We attribute this initial quenching to an effect of protonation of nearby cytosines in the single strand, as it occurs immediately after mixing and before the iM has folded, and is independent of position. To confirm that the initial quenching is due to protonation of neighboring cytidines, we tested a cropped tC°4 sequence (5′-TTC-tC°-CTA -3′) that does not form an iM as determined by CD (Fig. S3). The cropped sequence showed a 40% decrease in fluorescence immediately upon mixing (Fig. S3). We attribute the slower, additional quenching of tC°4 oligos to iM formation. Like its related fluorescent base, tC, tC° has a very low pKa (∼1.0) (48), and unincorporated tC° nucleoside does not exhibit such pH-dependent quenching (Fig. 7 A). The differences between pH effects on the free nucleoside and the tC° incorporated into the DNA strand strongly suggest that quenching arises from nearest-neighbor interactions within the single-strand oligo, in agreement with studies of the electronic coupling interactions among hemiprotonated dC residues in iMs (49).
As shown in Table 5, following the initial quench, three of the substituted oligos (tC°4, tC°9, and tC°10) show very similar rate constants for basepairing. These three positions pair with a rate constant of ∼1 s−1, which is slightly faster than the fastest rate constant for global folding via CD (∼0.5 s−1). As quenching is influenced by both hydrogen bonding and stacking interactions (Fig. 7), we infer from our data that pairing of tC°4, tC°9, and tC°10 occurs before the structure in Fig. 6 B is formed. We denote this stage of folding as B1 (Fig. 6). tC°12 and tC°15 have a fast rate constant of ∼0.4 s−1, which is similar to the fast global rate constant of ∼0.5 s−1 determined from CD data. We interpret this to mean that the 12th and 15th positions move into the intermediate state (Fig. 6 B2) simultaneously with the global folding of the iM as observed by CD (Fig. 6 B), suggesting that the base stacking occurs at the same rate as the hydrogen-bond formation. All positions exhibit a second, consistently slower rate constant of ∼0.01 s−1, which is also observed in the global folding obtained from CD spectra. We interpret this as the transition from the structure in Fig. 6 B2, to the final structure (Fig. 6 C). Both fluorescence and CD can be interpreted with the same mechanism; however, fluorescence gives insight into structural details that are invisible to CD (Fig. 6 B1 and B2).
Table 5.
Rate constants of folding for five different positions in the iM structure found from fluorescence quenching
| tC°4 | tC°9 | tC°10 | tC°12 | tC°15 | |
|---|---|---|---|---|---|
| Fraction of pH 8 signal remaining after initial quenching | 0.28 ± 0.01 | 0.36 ± 0.01 | 0.41 ± 0.01 | 0.31 ± 0.01 | 0.47 ± 0.02 |
| Fast fluorescence rate constant (s−1) | 1.150 ± 0.060 | 0.920 ± 0.060 | 1.460 ± 0.310 | 0.410 ± 0.070 | 0.412 ± 0.020 |
| (A to B1/B2) | |||||
| Fractional ΔF/Foa (A to B1/B2) | −0.07 ± 0.01 | −0.07 ± 0.01 | −0.06 ± 0.01 | −0.04 ± 0.01 | 0.15 ± 0.01 |
| Slow fluorescence rate constant (s−1) | 0.018 ± 0.003 | 0.012 ± 0.004 | 0.038 ± 0.036 | 0.010 ± 0.001 | 0.012 ± 0.003 |
| (B1/B2 to C) | |||||
| Fractional ΔF/Foa (B1/B2 to C) | −0.01 ± 0.01 | −0.01 ± 0.01 | −0.02 ± 0.01 | 0.02 ± 0.01 | −0.13 ± 0.01 |
| Final fraction of pH 8 signal remaining after folding | 0.20 ± 0.01 | 0.28 ± 0.01 | 0.33 ± 0.01 | 0.29 ± 0.01 | 0.49 ± 0.01 |
The total ΔF/Fo signal amplitudes were normalized from 0.0 (initial) to 1.0 (final). Data were fit to the mechanism in Fig. 6.
It is noteworthy that in Fig. 7 B, the final observed fluorescence intensity for tC° is very position dependent. We interpret these final intensities in Fig. 7 B by using Fig. 6 C. When equilibrium has been achieved, tC°4 is located in the middle of a cytosine run, with base stacking above and below it. Hence, the electronic coupling of tC° with surrounding dC residues would explain why it has the lowest fluorescence compared with other basepaired positions. In Fig. 6 C, both tC°9 and tC°12 are at the ends of the C-C+ stack and equivalent effects on their fluorescence are observed. Finally, the tC°10 hydrogen bond is broken in the predominant equilibrium form of the iM (Fig. 6 C), which would reduce the effect of pairing on fluorescence. The tC°10 has the highest final fluorescence of any of the intercalated tC° residues.
In contrast to the intercalated tC° residues, following the initial pH-induced quench, the fluorescence intensity of the tC°15 increases to 60% of its pH 8 fluorescence, followed by a slower decrease to a final intensity that is 50% of the pH 8 signal (Fig. 7 B). The shape of the fluorescence trace for tC°15 is consistent with an intermediate structure in which tC°15 is unpaired and unstacked. The high final fluorescence intensity observed with tC°15 is in agreement with the lifetime data from the PdC-15 substitution, both of which are consistent with the 15th position being in a loop in the fully folded iM. Our interpretation of the tC°15 data is that the 15th position is initially stacked in the single strand (Fig. 6 A), but during the folding process it becomes less stacked with the neighboring dC at the 14th position (Fig. 6 B1). The subsequent restacking of tC°15 in Fig. 6 C is responsible for the slow decrease in its fluorescence.
Conclusions
Given the consistency of all the data described above, we suggest that the lower folding pathway outlined in Fig. 6 is correct for the formation of the iM structure from the C20T sequence. In the course of determining this folding pathway, we established that fluorescent dC analogs can be used to monitor individual residues of an iM structure. We demonstrated that the fluorescence properties of tC° and PdC, including lifetime measurements, anisotropy decay, pH-dependent intensity, and time-dependent intensities following a pH jump, can be used to track iM formation and structure. We established that the C-C+ hydrogen bonding of certain bases (in the case of C20T, the 4–13, 9–18, and 10–19 bonds) initiate the folding of the iM structure. We also showed that substitutions in the loop regions of iMs, as shown by tC°15, give a distinctly different kinetic signature compared with bases that are intercalated. Taken together, our results lay the foundation for using fluorescent dC analogs as general tools for following structural changes during iM formation.
Our work benefited from the previous establishment of the equilibrium structure of C20T by Dai et al. (32), which enabled us to correlate our combined data with a known molecular iM structure. Based on our studies using AUC, molecular modeling, CD, and the fluorescent dC analogs described in this work, this analytical scheme can also be used to determine the folding and final structure of more complex iMs that are known to exist, such as those found in the promoters of human bcl-2 and VEGF genes. Overall, this work expands our knowledge about iMs and their formation, and thus may help to improve bio- and nanomaterial applications that utilize iMs, as well as to elucidate iM formation under in vivo conditions.
Acknowledgments
The authors thank Dr. Marcus Wilhelmsson (Chalmers University of Technology) for the donation of the tC° nucleoside, Dr. Tracy Brooks for her support and access to the Olis CD instrument, and the University of Mississippi Medical Center’s Analytical Ultracentrifugation Facility.
This work was supported by National Institutes of Health grant R15 CA173667-01A1 (Tracy Brooks, PI; R.M.W., co-PI) and the National Science Foundation under Mississippi EPSCoR grant No. NSF EPS-0903787.
Supporting Material
References
- 1.Landt S.G., Ramirez A., Frankel A.D. A simple motif for protein recognition in DNA secondary structures. J. Mol. Biol. 2005;351:982–994. doi: 10.1016/j.jmb.2005.07.001. [DOI] [PubMed] [Google Scholar]
- 2.Brooks T.A., Hurley L.H. The role of supercoiling in transcriptional control of MYC and its importance in molecular therapeutics. Nat. Rev. Cancer. 2009;9:849–861. doi: 10.1038/nrc2733. [DOI] [PubMed] [Google Scholar]
- 3.Wadkins R.M. Targeting DNA secondary structures. Curr. Med. Chem. 2000;7:1–15. doi: 10.2174/0929867003375461. [DOI] [PubMed] [Google Scholar]
- 4.Tomonaga T., Levens D. Activating transcription from single stranded DNA. Proc. Natl. Acad. Sci. USA. 1996;93:5830–5835. doi: 10.1073/pnas.93.12.5830. [DOI] [PMC free article] [PubMed] [Google Scholar]
- 5.Frank-Kamenetskii M.D., Mirkin S.M. Triplex DNA structures. Annu. Rev. Biochem. 1995;64:65–95. doi: 10.1146/annurev.bi.64.070195.000433. [DOI] [PubMed] [Google Scholar]
- 6.McMurray C.T. DNA secondary structure: a common and causative factor for expansion in human disease. Proc. Natl. Acad. Sci. USA. 1999;96:1823–1825. doi: 10.1073/pnas.96.5.1823. [DOI] [PMC free article] [PubMed] [Google Scholar]
- 7.Xu Y., Sugiyama H. Formation of the G-quadruplex and i-motif structures in retinoblastoma susceptibility genes (Rb) Nucleic Acids Res. 2006;34:949–954. doi: 10.1093/nar/gkj485. [DOI] [PMC free article] [PubMed] [Google Scholar]
- 8.Brooks T.A., Kendrick S., Hurley L. Making sense of G-quadruplex and i-motif functions in oncogene promoters. FEBS J. 2010;277:3459–3469. doi: 10.1111/j.1742-4658.2010.07759.x. [DOI] [PMC free article] [PubMed] [Google Scholar]
- 9.Burge S., Parkinson G.N., Neidle S. Quadruplex DNA: sequence, topology and structure. Nucleic Acids Res. 2006;34:5402–5415. doi: 10.1093/nar/gkl655. [DOI] [PMC free article] [PubMed] [Google Scholar]
- 10.Nambiar M., Goldsmith G., Raghavan S.C. Formation of a G-quadruplex at the BCL2 major breakpoint region of the t(14;18) translocation in follicular lymphoma. Nucleic Acids Res. 2011;39:936–948. doi: 10.1093/nar/gkq824. [DOI] [PMC free article] [PubMed] [Google Scholar]
- 11.Guo K., Gokhale V., Sun D. Intramolecularly folded G-quadruplex and i-motif structures in the proximal promoter of the vascular endothelial growth factor gene. Nucleic Acids Res. 2008;36:4598–4608. doi: 10.1093/nar/gkn380. [DOI] [PMC free article] [PubMed] [Google Scholar]
- 12.Guo K., Pourpak A., Hurley L.H. Formation of pseudosymmetrical G-quadruplex and i-motif structures in the proximal promoter region of the RET oncogene. J. Am. Chem. Soc. 2007;129:10220–10228. doi: 10.1021/ja072185g. [DOI] [PMC free article] [PubMed] [Google Scholar]
- 13.Kendrick S., Akiyama Y., Hurley L.H. The i-motif in the bcl-2 P1 promoter forms an unexpectedly stable structure with a unique 8:5:7 loop folding pattern. J. Am. Chem. Soc. 2009;131:17667–17676. doi: 10.1021/ja9076292. [DOI] [PMC free article] [PubMed] [Google Scholar]
- 14.Biffi G., Tannahill D., Balasubramanian S. Quantitative visualization of DNA G-quadruplex structures in human cells. Nat. Chem. 2013;5:182–186. doi: 10.1038/nchem.1548. [DOI] [PMC free article] [PubMed] [Google Scholar]
- 15.Rajendran A., Nakano S., Sugimoto N. Molecular crowding of the cosolutes induces an intramolecular i-motif structure of triplet repeat DNA oligomers at neutral pH. Chem. Commun. (Camb.) 2010;46:1299–1301. doi: 10.1039/b922050j. [DOI] [PubMed] [Google Scholar]
- 16.Cui J., Waltman P., Lewis E.A. The effect of molecular crowding on the stability of human c-MYC promoter sequence I-motif at neutral pH. Molecules. 2013;18:12751–12767. doi: 10.3390/molecules181012751. [DOI] [PMC free article] [PubMed] [Google Scholar]
- 17.Keum J.W., Bermudez H. DNA-based delivery vehicles: pH-controlled disassembly and cargo release. Chem. Commun. (Camb.) 2012;48:12118–12120. doi: 10.1039/c2cc37471d. [DOI] [PMC free article] [PubMed] [Google Scholar]
- 18.Li W., Feng L., Qu X. Visual detection of glucose using conformational switch of i-Motif DNA and non-crosslinking gold nanoparticles. Chemistry. 2012;18:12637–12642. doi: 10.1002/chem.201201914. [DOI] [PubMed] [Google Scholar]
- 19.Bhavsar-Jog Y.P., Reilly S.M., Wadkins R.M. DNA G-quadruplexes and I-motifs in therapeutics and diagnostics. In: Erdmann V.A., Markiewicz W.T., Barciszewski J., editors. Chemical Biology of Nucleic Acids. Springer; Heidelberg: 2014. pp. 441–458. [Google Scholar]
- 20.Leroy J.L., Guéron M., Hélène C. Intramolecular folding of a fragment of the cytosine-rich strand of telomeric DNA into an i-motif. Nucleic Acids Res. 1994;22:1600–1606. doi: 10.1093/nar/22.9.1600. [DOI] [PMC free article] [PubMed] [Google Scholar]
- 21.Leroy J.L. The formation pathway of i-motif tetramers. Nucleic Acids Res. 2009;37:4127–4134. doi: 10.1093/nar/gkp340. [DOI] [PMC free article] [PubMed] [Google Scholar]
- 22.Phan A.T., Mergny J.L. Human telomeric DNA: G-quadruplex, i-motif and Watson-Crick double helix. Nucleic Acids Res. 2002;30:4618–4625. doi: 10.1093/nar/gkf597. [DOI] [PMC free article] [PubMed] [Google Scholar]
- 23.Canalia M., Leroy J.L. Structure, internal motions and association-dissociation kinetics of the i-motif dimer of d(5mCCTCACTCC) Nucleic Acids Res. 2005;33:5471–5481. doi: 10.1093/nar/gki843. [DOI] [PMC free article] [PubMed] [Google Scholar]
- 24.Zhao Y., Zeng Z.X., Tan Z. The folding and unfolding kinetics of the i-motif structure formed by the C-rich strand of human telomere DNA. ChemBioChem. 2005;6:1957–1960. doi: 10.1002/cbic.200500175. [DOI] [PubMed] [Google Scholar]
- 25.Mergny J.L. Fluorescence energy transfer as a probe for tetraplex formation: the i-motif. Biochemistry. 1999;38:1573–1581. doi: 10.1021/bi982208r. [DOI] [PubMed] [Google Scholar]
- 26.Lieblein A.L., Buck J., Schwalbe H. Time-resolved NMR spectroscopic studies of DNA i-motif folding reveal kinetic partitioning. Angew. Chem. Int. Ed. Engl. 2012;51:250–253. doi: 10.1002/anie.201104938. [DOI] [PubMed] [Google Scholar]
- 27.Chen C., Li M., Liu D. Study of pH-induced folding and unfolding kinetics of the DNA i-motif by stopped-flow circular dichroism. Langmuir. 2012;28:17743–17748. doi: 10.1021/la303851a. [DOI] [PubMed] [Google Scholar]
- 28.Lee I.J., Park M., Kim B.H. Using fluorescence changes of F1U units at terminal and mid-loop positions to probe i-motif structures. Mol. Biosyst. 2012;8:486–490. doi: 10.1039/c1mb05343d. [DOI] [PubMed] [Google Scholar]
- 29.Lee I.J., Kim B.H. Monitoring i-motif transitions through the exciplex emission of a fluorescent probe incorporating two (Py)A units. Chem. Commun. (Camb.) 2012;48:2074–2076. doi: 10.1039/c1cc16497j. [DOI] [PubMed] [Google Scholar]
- 30.Choi J., Kim S., Majima T. pH-induced intramolecular folding dynamics of i-motif DNA. J. Am. Chem. Soc. 2011;133:16146–16153. doi: 10.1021/ja2061984. [DOI] [PubMed] [Google Scholar]
- 31.Mathur V., Verma A., Chowdhury S. Thermodynamics of i-tetraplex formation in the nuclease hypersensitive element of human c-myc promoter. Biochem. Biophys. Res. Commun. 2004;320:1220–1227. doi: 10.1016/j.bbrc.2004.06.074. [DOI] [PubMed] [Google Scholar]
- 32.Dai J., Hatzakis E., Yang D. I-motif structures formed in the human c-MYC promoter are highly dynamic—insights into sequence redundancy and I-motif stability. PLoS ONE. 2010;5:e11647. doi: 10.1371/journal.pone.0011647. [DOI] [PMC free article] [PubMed] [Google Scholar]
- 33.Bhavsar Y.P., Reilly S.M., Wadkins R.M. Evaluation of fluorescent analogs of deoxycytidine for monitoring DNA transitions from duplex to functional structures. J. Nucleic Acids. 2011;2011:986820. doi: 10.4061/2011/986820. [DOI] [PMC free article] [PubMed] [Google Scholar]
- 34.Zhang X., Wadkins R.M. DNA hairpins containing the cytidine analog pyrrolo-dC: structural, thermodynamic, and spectroscopic studies. Biophys. J. 2009;96:1884–1891. doi: 10.1016/j.bpj.2008.12.3890. [DOI] [PMC free article] [PubMed] [Google Scholar]
- 35.Sandin P., Börjesson K., Albinsson B. Characterization and use of an unprecedentedly bright and structurally non-perturbing fluorescent DNA base analogue. Nucleic Acids Res. 2008;36:157–167. doi: 10.1093/nar/gkm1006. [DOI] [PMC free article] [PubMed] [Google Scholar]
- 36.Demeler B. UltraScan: a comprehensive data analysis software package for analytical ultracentrifugation experiments. In: Scott D.J., Harding S.E., Rowe A.J., editors. Modern Analytical Ultracentrifugation: Techniques and Methods. Royal Society of Chemistry; Cambridge, UK: 2005. pp. 210–229. [Google Scholar]
- 37.Esmaili N., Leroy J.L. i-motif solution structure and dynamics of the d(AACCCC) and d(CCCCAA) tetrahymena telomeric repeats. Nucleic Acids Res. 2005;33:213–224. doi: 10.1093/nar/gki160. [DOI] [PMC free article] [PubMed] [Google Scholar]
- 38.Arnott S., Hukins D.W. Optimised parameters for A-DNA and B-DNA. Biochem. Biophys. Res. Commun. 1972;47:1504–1509. doi: 10.1016/0006-291X(72)90243-4. [DOI] [PubMed] [Google Scholar]
- 39.Berendsen H.J., van der Spoel D., van Drunen R. GROMACS: a message-passing parallel molecular dynamics implementation. Comput. Phys. Commun. 1995;91:43–56. [Google Scholar]
- 40.Liu S., Stafford W.F., 3rd An optical thermometer for direct measurement of cell temperature in the Beckman instruments XL-A analytical ultracentrifuge. Anal. Biochem. 1995;224:199–202. doi: 10.1006/abio.1995.1030. [DOI] [PubMed] [Google Scholar]
- 41.Philo J.S. Improved methods for fitting sedimentation coefficient distributions derived by time-derivative techniques. Anal. Biochem. 2006;354:238–246. doi: 10.1016/j.ab.2006.04.053. [DOI] [PubMed] [Google Scholar]
- 42.Stafford W.F., 3rd Boundary analysis in sedimentation transport experiments: a procedure for obtaining sedimentation coefficient distributions using the time derivative of the concentration profile. Anal. Biochem. 1992;203:295–301. doi: 10.1016/0003-2697(92)90316-y. [DOI] [PubMed] [Google Scholar]
- 43.Schuck P. Sedimentation analysis of noninteracting and self-associating solutes using numerical solutions to the Lamm equation. Biophys. J. 1998;75:1503–1512. doi: 10.1016/S0006-3495(98)74069-X. [DOI] [PMC free article] [PubMed] [Google Scholar]
- 44.Stafford W.F., Sherwood P.J. Analysis of heterologous interacting systems by sedimentation velocity: curve fitting algorithms for estimation of sedimentation coefficients, equilibrium and kinetic constants. Biophys. Chem. 2004;108:231–243. doi: 10.1016/j.bpc.2003.10.028. [DOI] [PubMed] [Google Scholar]
- 45.Scott D.J., Harding S.E., Rowe A.J. Royal Society of Chemistry; Cambridge, UK: 2005. Analytical Ultracentrifugation: Techniques and Methods; p. 236. [Google Scholar]
- 46.Lakowicz J.R. Advanced anisotropy concepts. In: Lakowicz J.R., editor. Principles of Fluorescence Spectroscopy. 3rd ed. Springer; New York: 2009. pp. 413–441. [Google Scholar]
- 47.Wu S., Wang X., Zhang G. pH-Induced conformational change and dimerization of DNA chains investigated by analytical ultracentrifugation. J. Phys. Chem. B. 2013;117:11541–11547. doi: 10.1021/jp405561f. [DOI] [PubMed] [Google Scholar]
- 48.Wilhelmsson L.M., Sandin P., Nordén B. Photophysical characterization of fluorescent DNA base analogue, tC. J. Phys. Chem. B. 2003;107:9094–9101. [Google Scholar]
- 49.Holm A.I., Nielsen L.M., Brøndsted Nielsen S. Electronic coupling between cytosine bases in DNA single strands and i-motifs revealed from synchrotron radiation circular dichroism experiments. Phys. Chem. Chem. Phys. 2010;12:3426–3430. doi: 10.1039/b924076d. [DOI] [PubMed] [Google Scholar]
Associated Data
This section collects any data citations, data availability statements, or supplementary materials included in this article.