

Abstract
To study the impact of neural activity on cellular physiology, one would like to combine precise control of firing patterns with highly sensitive probes of cellular physiology. Light-gated ion channels, e.g., Channelrhodopsin-2, enable precise control of firing patterns; green fluorescent protein-based reporters, e.g., the GCaMP6f Ca2+ reporter, enable highly sensitive probing of cellular physiology. However, for most actuator-reporter combinations, spectral overlap prevents straightforward combination within a single cell. Here we explore multiwavelength control of channelrhodopsins to circumvent this limitation. The “stoplight” technique described in this article uses channelrhodopsin variants that are opened by blue light and closed by orange light. Cells are illuminated with constant blue light to excite fluorescence of a green fluorescent protein-based reporter. Modulated illumination with orange light negatively regulates activation of the channelrhodopsin. We performed detailed photophysical characterization and kinetic modeling of four candidate stoplight channelrhodopsins. The variant with the highest contrast, sdChR(C138S,E154A), enabled all-optical measurements of activity-induced calcium transients in cultured rat hippocampal neurons, although cell-to-cell variation in expression levels presents a challenge for quantification.
Introduction
Combining optogenetic stimulation and fluorescence imaging
Activity-dependent changes in physiology are a hallmark of neural metabolism and information processing. Action potential generation and neurotransmitter release constitute significant metabolic loads, and maintenance of homeostasis in the presence of changing energy demands engages multiple metabolic pathways (1). Activity-dependent changes in neurons are integral in learning and memory, and contribute to the pathophysiology of diseases ranging from epilepsy to schizophrenia. Despite the fundamental importance of activity-dependent changes in neuronal physiology, we still do not fully understand many of the underlying pathways. A method to perturb neuronal activity with high spatiotemporal resolution while monitoring real-time cellular responses would be a valuable tool in this effort (2).
Optical tools for perturbing neural activity include photo-uncaged glutamate (3,4), light-activated agonists of endogenous ion channels (5,6), azobenzene-derivatized glutamate receptors (7), and heterologously expressed microbial rhodopsins (8). Of these, the rhodopsins have been particularly effective because they can be genetically targeted to specific subclasses of cells; are readily activated with modest doses of visible light; and typically do not require an exogenous cofactor (the retinal chromophore is present at sufficient levels in most vertebrate tissues). Channelrhodopsin-2 (ChR2), a light-gated cation channel from Chlamydomonas reinhardtii, allows optical control of neural activity in species ranging from worms to monkeys (9). New channelrhodopsins are frequently added to the optogenetic toolkit, distinguished by kinetic or spectroscopic features optimized for particular classes of experiments (10–14).
Protein-based fluorescent sensors have been developed for real-time measurements of membrane voltage, pH, calcium, ATP, NADH, cAMP, glutamate, reactive oxygen species, several redox potentials, activity of kinases and phosphatases, and many other modalities (15–18). Targeting of these reporters to subcellular domains in genetically specified subpopulations of neurons enables detailed studies of calcium fluxes, metabolic state, vesicle cycling, and signaling pathways. Although fluorescent proteins have been developed with excitation maxima throughout the visible spectrum (19), the vast majority of single-wavelength or FRET-based reporters contain a derivative of green fluorescent protein (GFP) (excitation, 488 nm; emission, 509 nm).
To achieve simultaneous optical perturbation and readout within the same cell, one must minimize the degree of optical crosstalk: the light used to trigger the actuator should not perturb the fluorescence of the reporter; and the light used to excite the reporter should not trigger the actuator (Fig. 1 a). Several approaches have been developed to achieve these goals. One- and two-photon glutamate uncaging is compatible with imaging of GFP-based reporters (20). Channelrhodopsin actuation can be paired with red-shifted voltage- or calcium-sensitive organic dyes (21,22) or proteins (13,23–25), although the number of reporters sufficiently red-shifted is limited.
Figure 1.

Spectral overlap limits combination of GFP-based reporters and channelrhodopsin-based actuators. (a) (Top) Continuous blue illumination is used to monitor GFP-based reporters of dynamic physiological quantities. (Bottom) Pulsed blue illumination is used for optogenetic stimulation. These two modalities cannot be combined in a single cell without optical crosstalk. (b) (Top) Fluorescence excitation spectrum of GCaMP6f, a sensor of Ca2+ (data from Chen et al. (31)). Other GFP-based reporters have a similar excitation spectrum. (Bottom) Action spectra of a panel of channelrhodopsins (data from Klapoetke et al. (10)). All channelrhodopsins are activated to some extent by the blue light used to excite a GFP-based reporter. To see this figure in color, go online.
Efforts to produce red-excited channelrhodopsins have shifted the excitation peaks as far as 590 nm, allowing independent optical control of distinct neural populations (10,26). However, these proteins retain 20–30% activation at the blue wavelengths used for excitation of GFP and thus experience spurious activation under fluorescence imaging conditions. Fig. 1 b shows the spectral overlap of GCaMP6f, a popular Ca2+ reporter, with a panel of channelrhodopsin actuators. Spectral overlap has remained a significant barrier to paired optical actuation and sensing in single neurons.
The complex photocycles of microbial rhodopsins open the possibility of sophisticated optical control (27). These proteins sample different states—each with its own function and absorption spectrum—with interstate transitions driven by illumination, membrane voltage, and thermal energy. Evolution has made use of these conformational and spectral gymnastics. For example, in Halobacterium salinarum a single photoreceptor, sensory rhodopsin I, mediates phototaxis both toward red light and away from ultraviolet (UV)/violet light. Red or orange light inhibits kinase activity in sensory rhodopsin I, while UV or near-UV light activates kinase activity, with opposite effects on cell motility (28). In the lab, one can use spectrally and temporally tuned pulses of light to interact with photocycle intermediates, thereby driving the population into states or distributions of states inaccessible under steady-state illumination. We previously applied this strategy to record stable photochemical imprints of membrane voltage (29) and to encode absolute values of membrane voltage into nonequilibrium dynamics of photocycle intermediates (30). Here we apply this strategy to modulate channelrhodopsin photocurrents in the presence of continuous blue illumination, thereby enabling simultaneous optogenetic stimulation and fluorescence imaging of a GCaMP Ca2+ indicator (31).
Repurposing step-function opsins as stoplight channelrhodopsins
Step-function opsins (SFO) are channelrhodopsin variants that are opened by blue light and closed by orange or red light (32). The full SFO photocycle (33) is quite complex; Fig. 2 a shows a dramatically simplified version of this photocycle, which captures the features essential for the present discussion, but is not appropriate for a quantitative determination of rate constants. We reasoned that under continuous blue illumination, one could modulate the population in the open state by modulating the intensity of simultaneously applied orange light (Fig. 2 b). By collecting reporter fluorescence at wavelengths bracketed between the blue and orange illumination wavelengths, one could image the reporter with negligible crosstalk from the modulated orange beam. The challenge, then, was to identify an SFO and illumination conditions (intensities, wavelengths, times) that would facilitate robust crosstalk-free fluorescence imaging with simultaneous optogenetic stimulation of neurons. We call our proposed scheme the “stoplight” technique because the SFO photocurrent is stopped by red (or orange) light.
Figure 2.
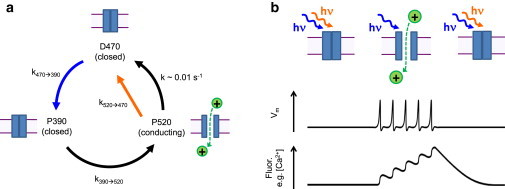
Stoplight optical control of a step-function opsin. (a) Simplified photocycle of a step-function opsin adapted from Berndt et al. (32), comprising a blue-absorbing ground state (D470), and an orange-absorbing open state (P520). The P390 intermediate limits the maximum rate at which the protein can go from the ground state to the open state. The spectra of the states are broad and overlapping, with maxima at the indicated wavelengths. (b) Proposed stoplight illumination protocol. (Cartoon) Anticipated data. Simultaneous application of weak (∼1 W/cm2) blue and strong (∼300 W/cm2) orange illumination leaves most channels closed. Removal of the 3orange light opens the channels. In a neuron, this conductance could induce a train of action potentials and induce a fluorescence response in a GFP-based reporter, here represented by a Ca2+ indicator. Reapplication of orange light closes the channels and suppresses firing. To see this figure in color, go online.
Due to the countervailing effects of blue and orange light on the open-state population, the orange intensity required to close the channel depends on the blue intensity. The blue intensity is set by the attributes of the fluorescent reporter and the demands for spatial and temporal resolution in the imaging. For instance, single-molecule or high-magnification experiments require much higher intensity than population-average measurements; voltage imaging at a 1 kHz frame rate to detect neuronal action potentials requires higher illumination intensity than imaging at a 50 Hz frame rate to detect Ca2+ transients. To image a GFP-based reporter expressed in neurons under a strong constitutive promoter, e.g., CaMKIIa or hSynapsin, with ∼1-μm spatial resolution and ∼10-ms temporal resolution requires blue illumination (488 nm) at an intensity of 0.1–10 W/cm2. We thus measured photocurrents with blue illumination in this range, and with a simultaneously applied second beam of variable intensity and wavelength.
Methods
Molecular biology
We made point mutants of ChR2, CoChR, and sdChR in a lentiviral vector (22217; Addgene, Cambridge, MA) under the CaMKIIa promoter. To make these point mutants, we modified the two-sided splicing by overlap extension technique of Horton et al. (34). Each gene was PCR-amplified in two fragments: fragment A, upstream of the mutation site; and fragment B, downstream of the mutation site. The mutation was introduced into both the reverse PCR primer used to amplify fragment A and the forward PCR primer used to amplify fragment B. We used Gibson Assembly (New England Biolabs, Ipswich, MA) to insert fragments A and B into the lentiviral vector (Addgene plasmid 22217 digested with the restriction enzymes BamHI and EcoRI). We produced: ChR2(C128S)-eGFP, sdChR(C138S)-TS-eGFP-ER, sdChR(C138S,E154A)-TS-eGFP-ER, CoChR(C108S)-eGFP, sdChR(C138S,E154A)-TS-GCaMP6f-ER, and sdChR(C138S,E154A)-TS. The trafficking sequence (TS) used in Gradinaru et al. (35) was added to the C-terminus of sdChR to improve its membrane trafficking. The FCYENEV endoplasmic reticulum (ER) export motif of Gradinaru et al. (35) was also added to the C-terminus of GFP or GCaMP6f in these constructs to improve trafficking. The TS sequence did not improve membrane trafficking of ChR2(C128S). CoChR showed excellent membrane trafficking in HEK cells and neurons, so we did not add trafficking sequences to CoChR.
For expression in HEK cells, ChR2(C128S) was expressed under an ubiquitin promoter (using the plasmid backbone from Addgene 22051).
Fusions between stoplight rhodopsins and GCaMP6f were made by inserting a linker with the sequence AAPVVAVSKAAAKSRITSEGEYIPLDQIDINV, where the bold residues correspond to the TS. Extensive experience with this linker has shown independent function of the upstream rhodopsin and the downstream fluorescent reporter.
To generate a vector for expression of mitochondrial GCaMP5G in neurons, we added one copy of the Cox8 localization sequence (MSVLTPLLLRGLTGSARRLPVPRAKIHSLGDPPV, from Addgene 23348 (36)) to the N-terminus of GCaMP5G in a lentiviral expression vector under the CaMKII promoter.
All constructs were verified by sequencing.
Cell culture
HEK-293T cell culture and DNA transfection were performed as in MacLaurin et al. (37). Briefly, HEK293T cells were grown in DMEM supplemented with 10% FBS and penicillin/streptomycin in a 37°C incubator under 5% CO2. Forty-eight hours before measurement, cells were transfected using Transit-293 (Mirus) with the opsin of interest (see Molecular Biology above). These cells were replated at a density of ∼5000–10,000 cells/cm2 on Matrigel-coated (Corning Life Sciences, Tewksbury, MA) cover-glass bottom dishes (P35G-1.5-14-C; MatTek, Ashland, MA) 24 h before measurement. All-trans retinal (5 μM) was added to each dish 1–2 h before imaging.
All experimental protocols involving use of animals were approved by the Harvard Institutional Animal Care and Use Committee. Primary neuronal cell culture was performed as in Venkatachalam et al. (29). Postnatal day 0 (P0) pups were euthanized and hippocampi were dissected following the procedure in Goslin (38). Briefly, isolated hippocampi were digested with papain and homogenized in Hank’s Balanced Salt Solution containing MgCl2 and kyneurinic acid to prevent excitotoxicity. Cells were plated on glass-bottomed dishes (P35G-1.5-14-C; MatTek) coated with 20 μg/mL poly-D-lysine, and cultured in plating medium consisting of MEM (Life Technologies, Norwalk, CT) containing 10% fetal bovine serum, 0.5% glucose, 10 mM HEPES, 2 mM Glutamax (Life Technologies), 100 mg/L transferrin, insulin, and B27. After 60 h, the medium was replaced with NbActiv4 (Nb4-500; BrainBits, Springfield, IL). At 4 days in vitro, 2 μM AraC was added to suppress further glial growth. At 7 days in vitro, neurons were transfected using calcium phosphate (Cat. No. 631312; Clontech, Mountain View, CA). Each 3.5 cm dish was transfected with 200 ng of opsin DNA diluted in 1800 ng of nonexpressing pUC19 plasmid.
Patch-clamp electrophysiology and fluorescence imaging
The combined epifluorescence microscope and patch-clamp apparatus is described in Hou et al. (30). We imaged GFP-based fluorophores using excitation at 488 nm. Fluorescence was separated from scattered laser light by a 525/30 emission filter. Images were acquired at a 20-Hz frame rate on a scientific complementary metal-oxide semiconductor (CMOS) camera (Orca 4 Flash; Hamamatsu Photonics, Hamamatsu City, Japan).
All whole cell patch-clamp experiments in HEK cells were performed in voltage-clamp mode, while experiments in neurons were performed in current-clamp mode using a patch-clamp amplifier (model 2400; A-M Systems, Sequim, WA) and a micromanipulator (MP-285; Sutter Instrument, Novato, CA). Micropipettes were pulled from filamented borosilicate glass capillary tubes (1.5 mm OD, 0.84 mm ID; World Precision Instruments, Sarasota, FL) using a glass micropipette puller (P-1000; Sutter Instruments) to a tip resistance of 5–10 MΩ and filled with intracellular buffer (125 mM potassium gluconate, 8 mM NaCl, 0.6 mM MgCl2, 0.1 mM CaCl2, 1 mM EGTA, 10 mM HEPES, 4 mM Mg-ATP, and 0.4 mM Na-GTP at pH 7.3; adjusted to 295 mOsm with sucrose). The extracellular solution for all recordings was retinal-free Tyrode’s buffer (125 mM NaCl, 2 mM KCl, 3 mM CaCl2, 1 mM MgCl2, 10 mM HEPES, and 30 mM glucose at pH 7.3; adjusted to 305–310 mOsm with sucrose). For experiments in HEK cells we added 50 μM 2-APB to block electrical gap junctions. For experiments in neurons, we added 10 μM NBQX, 20 μM Gabazine, 25 μM AP-V to block synaptic transmission. All experiments were performed at 24°C.
Electrophysiology recordings were low-pass filtered at 5 kHz using the internal filter and then digitized using a data acquisition card (PCIe-6343; National Instruments, Austin, TX), at 10 kHz. Custom software routines written in MATLAB (The MathWorks, Natick, MA) and LABVIEW (National Instruments) were used to deliver illumination light of different wavelengths and intensities with submillisecond temporal precision.
Results
Measurements were performed on a homemade system for simultaneous patch-clamp electrophysiology and multiwavelength fluorescence illumination and imaging, described in detail in Venkatachalam et al. (29) and Hou et al. (30). In brief, lasers at wavelengths of 488, 532, 561, 594, and 640 nm were combined by dichroic mirrors and modulated via an acousto-optic tunable filter to select the time-dependent intensity for each wavelength at the sample. Fluorescence imaging was performed in an inverted epifluorescence microscope equipped with a high numerical-aperture objective and a scientific CMOS camera. Membrane electrical properties were measured via whole-cell patch-clamp in either constant-current or constant-voltage mode. Illumination, imaging, and electrophysiology were synchronized via custom LABVIEW software (National Instruments). All experiments were conducted at 24°C.
We first tested the previously described SFO, ChR2(C128S) (32). We expressed ChR2(C128S)-eGFP in HEK293T cells (see Methods) and applied the illumination sequence shown in Fig. 3 a. We simultaneously monitored membrane current via whole-cell patch-clamp, maintaining Vm = −70 mV. A pulse of red light (640 nm, 700 W/cm2, 300 ms) initialized the protein in the fully closed D470 state. A pulse of blue light of variable intensity (0.03–20 W/cm2, 1000 ms) opened the channels and induced an inward (negative) photocurrent. During the middle 500 ms of the blue pulse, a stoplight pulse of orange light (594 nm, 300 W/cm2) was added to the illumination and the photocurrent decreased in magnitude. The photocurrent traces in Fig. 3 a illustrate the countervailing influences of blue and orange light. For the weakest blue illumination, the orange light largely suppressed the photocurrent (98% fractional inhibition); however, this blue intensity was too low for fluorescence imaging, and only opened the channel slowly. For the strongest blue illumination, the orange light only partially closed the channel (23% fractional inhibition). In the absence of blue illumination, the orange light alone opened the channels to only 1.5% of maximum photocurrent, indicating minimal spurious channel activation by the stoplight.
Figure 3.

ChR2(C128S) can be closed under steady-state blue illumination by the addition of a stoplight. (a) A HEK-293T cell expressing ChR2(C128S) was illuminated with the indicated pulse sequence under whole-cell voltage clamp at −70 mV. The initial pulse of red illumination was responsible for closing channels left open by the previous illumination cycle. Open channelrhodopsin passed a negative current. Intense orange light (300 W/cm2, 594 nm) suppressed ∼95% of the photocurrent induced by moderate blue light (∼300 mW/cm2, 488 nm). (b) Results of a kinetic simulation of the photocycle model in Fig. 2a using estimated rates. Each trace shows the expected population of the P520-conducting state at a different 488-nm illumination intensity (as in panel a). To see this figure in color, go online.
To gain insight into the photocurrent dynamics of Fig. 3 a, we simulated the kinetic scheme of Fig. 2 a with time-varying illumination. By using this simplified model, we hoped to build intuition for the main qualitative features of the data. Due to the broad absorption spectrum of each state, we allowed each color of light to drive each optical transition with an efficiency proportional to the absorption coefficient of the source state. We neglected thermal isomerization from P520 to D470 because this rate is extremely slow, <0.01 s−1 (32). Under these assumptions, the rates are
where Iblue is the blue intensity, ISL is the stoplight intensity, m is the fractional absorption of D470 at λSL relative to λblue, and n is the fractional absorption of P520 at λSL relative to λblue. The governing equations are the following:
The calculated time-dependent population of the conducting state P520 recapitulated the main features of the photocurrent data (Fig. 3 b), with k1 = 0.5 cm2 W−1 ms−1, k2 = 15 ms−1, k3 = 0.2 cm2 W−1 ms−1, m = 0.001, and n = 0.05. These kinetic parameters only approximately describe the dynamics of a more complex underlying photocycle and thus should not be ascribed to well-defined molecular transitions.
The simulations explained two nonintuitive features of the data:
First, the steady-state photocurrent under blue-only illumination (e.g., from t = 1000–1250 ms) was a decreasing function of blue intensity. Solving the kinetic equations for steady state with ISL = 0 yields a population in the conducting P520 state,
where A = k2/k3, and B = k2/k1 + k2/k3. Thus [P520]ss is a decreasing function of Iblue.
Second, when the blue light was stopped (t = 2000 ms) the photocurrent increased in magnitude. Under steady-state blue illumination there was a finite population in the P390 intermediate. Upon cessation of blue illumination, the rate P520 → D470 became negligible (<0.01 s−1), while population thermally transferred from P390 → P520. Thus [P520], and the photocurrent, increased. This simple model thus provided a framework for interpreting photocurrent data with ChR2(C128S) and other step-function opsins.
Optimization of stoplight wavelength and intensity for ChR2(C128S)
We next varied the wavelength and intensity of the stoplight to identify the optimal parameters for fast and high-contrast photoswitching. The illumination protocol was the same as in Fig. 3. We measured steady-state photocurrents (iss) at Vm = −70 mV as a function of blue illumination intensity (Iblue) either in the absence of a stoplight or with stoplight wavelength selected from λSL = 532, 594, or 640 nm. In all cases, the stoplight intensity was ISL = 200 W/cm2 (Fig. 4 a).
Figure 4.
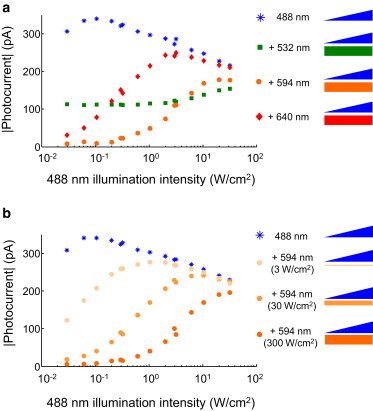
Optimization of illumination parameters for ChR2(C128S). (a) Steady-state photocurrents in the presence of blue illumination only (blue) and in the simultaneous presence of blue paired with green, orange, or red illumination (colored correspondingly). (b) Steady-state photocurrents in the presence of blue illumination only (blue) and with varying powers of orange stoplight. The aim is to maximize the blue-only photocurrent while minimizing the blue-plus-stoplight photocurrent. Data represents a single representative recording from n = 5 recordings. To see this figure in color, go online.
A good stoplight would minimize the photocurrent under all blue illumination intensities. The red (640 nm) stoplight effectively shut the channel at very low Iblue, but was overpowered by the blue beam for Iblue > 0.1 W/cm2. The red beam was too far off resonance with the P520 transition to drive rapidly P520 → D470. The green (532 nm) stoplight led to significant current at all values of Iblue. The green stoplight drove D470 → P390 in addition to P520 → D470, and thus was an ineffective stoplight. The orange (594 nm) stoplight achieved a balance between maximizing the rate of P520 → D470, while minimizing crosstalk to D470 → P390. For Iblue between 0.1 and 1 W/cm2, the orange stoplight suppressed photocurrent by 97–84%.
We next investigated the effect of stoplight intensity (Fig. 4 b). Ideally one would minimize the stoplight intensity to avoid risk of photodamage and to enable application over as wide a field of view as possible for a given illumination power. As expected, weaker stoplights were less effective at counteracting the blue photocurrent. At Iblue = 300 mW/cm2, the 300 W/cm2 stoplight inhibited 95% of the blue photocurrent, compared with 75% inhibition at 30 W/cm2, and 25% inhibition at 3 W/cm2. Thus for ChR2(C128S), the stoplight must be ∼1000-fold more intense than the blue light.
Characterization of stoplight protocol in novel SFOs
Our spectroscopic explorations of ChR2(C128S) elucidated the critical parameters for stoplight performance. The closed and open states should have minimal spectral overlap, and the protein should have high conductance in the blue-only state. This conductance is the product of the expression level, the efficiency of trafficking to the plasma membrane, and the unit conductance of the open channel. Visual inspection of eGFP fluorescence in neurons expressing ChR2(C128S)-eGFP showed poor membrane trafficking. In our experiments and in previous reports (32), this protein did not pass sufficient photocurrent to induce robust spiking in cultured neurons.
We thus introduced mutations homologous to C128S into other channelrhodopsin variants that showed superior trafficking and sensitivity. The mutant ChR2(H134R) passes larger photocurrents than wild-type ChR2 (39), so we made ChR2(C128S, H134R). However, this construct did not “traffic” well in HEK cells, so it was not pursued further. A recent screen for improved channelrhodopsins identified two with greatly enhanced photocurrents: one from Chloromonas oogama (CoChR) and one from Scherffelia dubia (sdChR) (10). We thus made CoChR(C108S) and sdChR(C138S). We previously found that the mutant sdChR(E154A), termed “CheRiff”, had minimal activation by red or orange light (13), so we also made sdChR(C138S, E154A).
We expressed each mutant in HEK cells and characterized its photocurrents and kinetics under blue illumination (488 nm, 300 mW/cm2) and simultaneously modulated orange illumination (594 nm, 300 W/cm2) (Fig. 5 a). The ideal stoplight channelrhodopsin would show large photocurrent with blue-only illumination, and large fractional inhibition by orange light (i.e., reside in the top-right region of Fig. 5 a). CoChR(C108S) had the highest blue-only photocurrents (748 ± 129 pA, n = 7 cells), while sdChR(C138S,E154A) yielded the greatest fractional inhibition by orange light (94.3 ± 1.8%, n = 5 cells). All statistics are mean ± SE.
Figure 5.
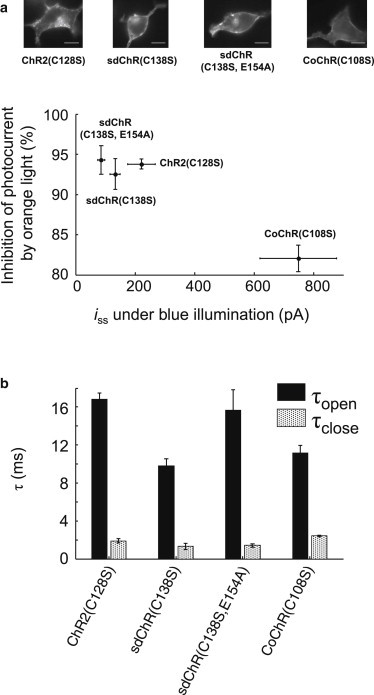
Gating properties of step-function opsin variants. (a) Photocurrents (at V = −70 mV) in HEK cells were recorded with steady-state blue illumination (488 nm, 300 mW/cm2) and with simultaneously applied orange illumination (594 nm, 300 W/cm2). Ideal stoplight behavior would yield a large photocurrent under blue-only illumination, and a large fractional inhibition by orange light. (Top) Images of HEK cells expressing the constructs, imaged via eGFP fluorescence in an opsin-eGFP fusion. (Scale bars) 10 μm. (b) Time constants of channel opening (τopen) and closing (τclose) under constant blue illumination and modulated orange illumination. (Error bars) Mean ± SE of n = 5–7 cells.
We characterized the channel opening time (τopen), corresponding to the orange light turning off, and the closing time (τclose), corresponding to the orange light turning on (Fig. 5 b). Photocurrent recordings were fit to a single exponential. All fits had r2 > 0.98. The mutant sdChR(C138S) had the fastest opening time constant of τopen = 9.8 ± 0.7 ms (n = 7 cells). All candidates had τclose < 3 ms. The rapid closing of the step-function opsins could be useful for inducing high-frequency trains of action potentials, and is much faster than the spontaneous closing of conventional channelrhodopsins.
Testing the stoplight technique in neurons
While no ChR mutant was optimal by all measures, for further characterization in neurons we selected sdChR(C138S, E154A) on account of its high (94%) suppression by orange light and its good membrane trafficking. We compared wild-type ChR2 and sdChR(C138S, E154A) in paired cultures of rat hippocampal neurons, using calcium phosphate transfection of the constructs in lentiviral vectors under the CaMKIIa promoter. Synaptic blockers were added to the imaging medium to ensure cell-autonomous dynamics. We used manual patch-clamp in whole-cell current-clamp mode to monitor the membrane voltage as we varied the blue and orange illumination (see Methods).
In a neuron expressing ChR2-eGFP, blue pulses (488 nm, 3 W/cm2, 10 ms) on a dark background robustly induced single action potentials (Fig. 6 a). However, introduction of a steady-state blue background of 300 mW/cm2, such as might be used for GFP imaging, depolarized the cell by 40 mV, leading to sodium channel inactivation, and suppression of firing. These results illustrate the need for a more sophisticated approach to simultaneous optical stimulation and imaging.
Figure 6.
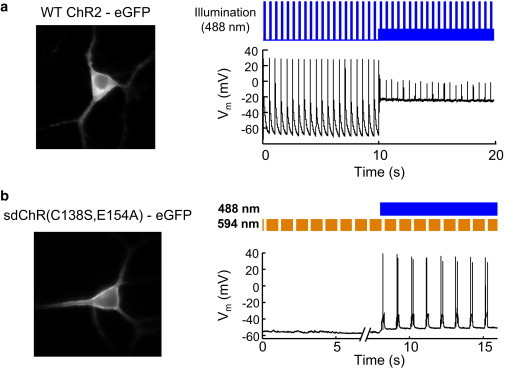
Comparison of conventional ChR2 versus stoplight protocol for simultaneous optogenetic stimulation and eGFP imaging. (a) Attempt to use wild-type ChR2 to optically induce action potentials in a cultured rat hippocampal neuron while simultaneously imaging eGFP. From t = 0 s to t = 10 s, baseline blue intensity was zero, and blue pulses (488 nm, 10 ms, 3 W/cm2) reliably induced action potentials. From t = 10 s to t = 20 s, baseline blue intensity was 300 mW/cm2, appropriate for eGFP imaging. This illumination depolarized the neuron by ∼40 mV. Blue pulses (10 ms, 3 W/cm2) failed to induce action potentials on this depolarizing background. (b) Optogenetic control of action potentials under continuous blue illumination using the stoplight technique with sdChR(C138S, E154A). Onset of orange illumination alone (594 nm, 300 W/cm2) depolarized the cell by <2 mV. Subsequent pulses of orange light did not detectably perturb membrane potential, with a measurement noise of 1 mV. Simultaneous blue (300 mW/cm2) and orange (300 W/cm2) illumination depolarized the cell by only 5 mV. Interruption of the orange stoplight (toff = 200 ms) reliably triggered action potentials. To see this figure in color, go online.
We expressed sdChR(C138S, E154A) fused to a TS, an eGFP, and an ER export motif (see Methods) in a neuron and monitored the membrane voltage in response to a stoplight illumination protocol (Fig. 6 b). At Iblue = 0, modulation of the orange stoplight (Istoplight = 300 W/cm2) had no effect on membrane voltage. Simultaneous application of blue light (Iblue = 300 mW/cm2) and orange light (Istoplight = 300 W/cm2) depolarized the resting voltage by only 5 mV. Modulation of the orange beam (ton = 800 ms, toff = 200 ms) in the presence of blue light robustly triggered action potentials. These results demonstrate that the stoplight technique can trigger neuronal firing under continuous blue illumination appropriate for imaging a GFP-based reporter. Phototoxicity is a concern because of the high intensity of the orange stoplight. We found that neurons could typically tolerate ∼2 min of stoplight illumination before they developed changes in action potential parameters such as were indicative of phototoxicity.
We then replaced the eGFP expression marker with GCaMP6f (31), a genetically encoded fluorescent reporter of Ca2+ (see Methods). We expressed sdChR(C138S,E154A)-TS-GCaMP6f-ER in cultured rat hippocampal neurons and applied the stoplight illumination protocol (Iblue = 300 mW/cm2, Istoplight = 300 W/cm2, Fig. 7). We simultaneously recorded membrane potential via manual patch-clamp and GCaMP6f fluorescence (excited by the blue beam).
Figure 7.
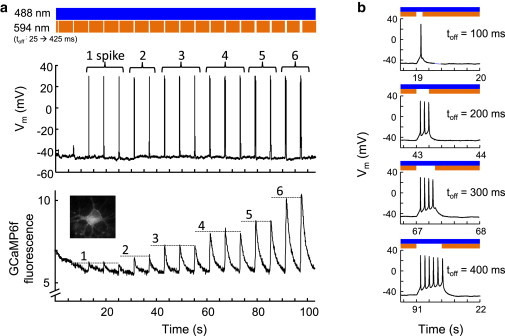
Crosstalk-free optical triggering of action potentials and optical monitoring of Ca2+ transients. (a) Calcium influx increased with the number of action potentials triggered by sdChR(C138S, E154A). (Top) Stoplight illumination scheme, with toff increasing from 25 to 425 ms. (Middle) Membrane voltage recorded in whole-cell current clamp. The number of action potentials induced in each off-period is labeled above the spike. (Bottom) Simultaneously recorded GCaMP6f fluorescence, showing spikes of discrete amplitude that grew with number of action potentials. (b) Closeups of the membrane voltage during the off-periods of increasing length. To see this figure in color, go online.
The 594-nm light was blocked every 6 s, with toff increasing from 25 to 425 ms. Blockage of the stoplight led to action potentials, with longer off-times leading to larger numbers of action potentials as recorded electrically. The GCaMP6f fluorescence showed positive-going transients associated with blockage of the stoplight. Although toff increased for each off-period, the amplitude of the Ca2+ transient grew in discrete steps, corresponding to the number of action potentials induced. This result demonstrates that the stoplight protocol can optically induce action potentials and simultaneously monitor action-potential-induced Ca2+ transients with single-spike resolution. The patch pipette in this experiment served only as a passive probe of membrane potential, and was not necessary for the optical experiment.
A key merit of the all-optical stoplight protocol is its ability to measure neuronal responses with higher throughput than is practical with patch-clamp electrophysiology. We applied the stoplight protocol without simultaneous patch-clamp recordings to n = 23 neurons. Of these, nine (39%) showed clearly resolved unitary Ca2+ transients similar to those shown in Fig. 7. In the cells that showed a clear Ca2+ response, the minimum toff to induce a single action potential varied between 10 and 400 ms (mean 123 ms, n = 9 cells). More frequently, we observed complex Ca2+ transients that did not clearly resemble single action potential responses. This cell-to-cell variability likely arose from two factors: 1), variations in resting potential, which caused variation in the amount of depolarization needed to reach the threshold voltage for action potential initiation; and 2), variations in opsin expression, which caused variations in opsin-mediated photocurrents. The small baseline depolarization under simultaneous blue and orange illumination was likely proportional to opsin expression level, and therefore also varied between cells. GCaMP6f shows a nonlinear response to Ca2+ concentration, with a Kd value of 375 nM (31). Thus, the amplitude of the fluorescence transients depended on the initial cytoplasmic Ca2+ concentration. These sources of variability, some biological and some technical, present a challenge for using the stoplight technique to deterministically induce defined numbers of action potentials.
Despite these limitations, we tested whether the stoplight technique could report associations between neural activity nd response of GFP-based sensors. To compare Ca2+ handling in the cytoplasm and the mitochondria, we made mitochondrially targeted Ca2+ sensor by fusing a mitochondrial targeting domain (36) to GCaMP5G (see Methods). We cotransfected neurons with sdChR(C138S,E154A) and either cytosolic GCaMP6f or mitochondrial GCaMP5G. The orange stoplight was blocked for 3 s intervals with a 10 s period, to induce episodes of sustained depolarization. The cytosolic Ca2+ response showed a clear rise and fall and returned to baseline after each stimulus (Fig. 8 and Movie S1 in the Supporting Material). The mitochondrial Ca2+ response was much slower, and did not return to baseline between stimuli (Fig. 8) (see Movie S2). The mitochondrial Ca2+ response also lagged stimulus onset or offset, reflecting the multistep process for Ca2+ to transfer between the mitochondrial matrix and the extracellular medium. The decay of Ca2+ in the mitochondria was much slower than the previously reported off-time for GCaMP5G (40), confirming that the difference in observed timing was not due to the difference between GCaMP5G and GCaMP6f.
Figure 8.
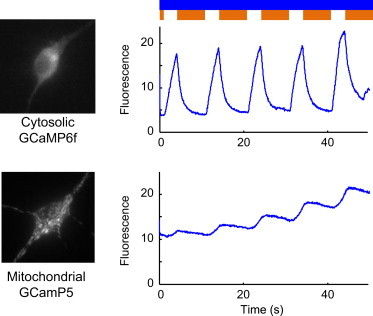
Stoplight protocol reveals activity-dependent physiological responses in neurons. Cultured rat hippocampal neurons were cotransfected with sdChR(C138S,E154A) and with a Ca2+ indicator targeted either to the cytosol (top) or the mitochondria (bottom). Fluorescence, corresponding to [Ca2+], was continuously monitored in response to optically induced activity. To see this figure in color, go online.
Discussion
Nonlinear control through interaction with photocycle intermediates provides a powerful means to steer opsin dynamics. This approach is readily implemented with moderate-intensity quasi-CW light sources and millisecond timescale modulation. The stoplight technique provides a means to control neuronal activation while simultaneously monitoring fluorescent reporters (either protein or small-molecule) spectrally similar to GFP. This technique relies on temporal modulation of an orange (594 nm) illumination source to control neuronal activity, resulting in minimal optical crosstalk between the light used for optogenetic actuation and the light used for imaging. The stoplight method also leads to faster bidirectional switching than is achieved with single-wavelength optogenetic control. Orange light closes step-function opsins in <2 ms, while thermally activated closing of channelrhodopsins occurs with a time constant of at least 15 ms (41,42). With a single gene, one can rapidly hyperpolarize or depolarize a cell relative to the membrane potential established in the photostationary state.
Several advances will be required for the stoplight technique to become generally applicable. To start, it is necessary to improve the dynamic range of the opsin photocurrent: to have a higher blue-only photocurrent, and a lower blue-plus-orange photocurrent. A high blue-only photocurrent is necessary to trigger action potentials in a robust manner. A low blue-plus-orange photocurrent is necessary to prevent baseline depolarization and sodium channel inactivation. Among the opsins we explored, there appeared to be a tradeoff between performance along these parameters (Fig. 5 a). We see no fundamental reason for this tradeoff. A broader search of opsin backbones or further mutation of the opsins presented here may identify variants that can reliably and precisely trigger single time-action potentials via the stoplight protocol, over a wide range of expression levels and natural neuronal variability. The CoChR variants show particular promise. We did not apply CoChR(C108S) in neurons due to the incomplete suppression of photocurrent (82%) by orange light. However, the exceptional membrane localization and high blue-only photocurrent (750 pA) of this mutant make it a promising candidate for further mutagenesis. Novel strategies for improving expression and membrane trafficking can dramatically increase photocurrents (42).
A related challenge is to decrease the minimum orange light intensity needed to suppress the photocurrent. The stoplight intensity we used, 300 W/cm2, borders on the photodamage threshold in neurons. This intensity can only be achieved with a high magnification objective and laser illumination focused to a region approximately the size of a single cell. Applications to studying neural circuit dynamics in vitro or in vivo will require photocurrent suppression at much lower stoplight intensity.
Acknowledgments
We thank Christopher Werley for design and construction of the microscope; we thank Christopher Werley, Peng Zou, and Daan Brinks for software development. Vaibhav Joshi and Niklas Smedemark-Margulies performed tissue culture. Vedhavalli Nathan, Jonathan Gootenberg, and Katherine Williams helped with cloning. Nathan Klapoetke and Ed Boyden provided genes for sdChR and CoChR and channelrhodopsin action spectra. Douglas Kim and Eric Schreiter provided the action spectrum of GCaMP6f.
This work was supported by the Howard Hughes Medical Institute; Office of Naval Research (ONR) Presidential Early Career Award for Scientists and Engineers award No. N00014-11-1-0549; the Harvard Center for Brain Science; National Institutes of Health (NIH) grant No. 1-R01-EB012498-01 and NIH New Innovator grant No. 1-DP2-OD007428; the Gordon and Betty Moore Foundation; a Herchel Smith Graduate Fellowship (to V.V.); and NIH MSTP grant No. T32GM07753-36 (to V.V.).
Conflict of interest: A.E.C. is a founder of Q-State Biosciences and a member of its scientific advisory board.
Supporting Material
References
- 1.Rangaraju V., Calloway N., Ryan T.A. Activity-driven local ATP synthesis is required for synaptic function. Cell. 2014;156:825–835. doi: 10.1016/j.cell.2013.12.042. [DOI] [PMC free article] [PubMed] [Google Scholar]
- 2.Cohen A.E., Venkatachalam V. Bringing bioelectricity to light. Annu. Rev. Biophys. 2014;43:11. doi: 10.1146/annurev-biophys-051013-022717. [DOI] [PubMed] [Google Scholar]
- 3.Nikolenko V., Poskanzer K.E., Yuste R. Two-photon photostimulation and imaging of neural circuits. Nat. Methods. 2007;4:943–950. doi: 10.1038/nmeth1105. [DOI] [PubMed] [Google Scholar]
- 4.Kwon H.B., Sabatini B.L. Glutamate induces de novo growth of functional spines in developing cortex. Nature. 2011;474:100–104. doi: 10.1038/nature09986. [DOI] [PMC free article] [PubMed] [Google Scholar]
- 5.Kokel D., Cheung C.Y.J., Peterson R.T. Photochemical activation of TRPA1 channels in neurons and animals. Nat. Chem. Biol. 2013;9:257–263. doi: 10.1038/nchembio.1183. [DOI] [PMC free article] [PubMed] [Google Scholar]
- 6.Kramer R.H., Mourot A., Adesnik H. Optogenetic pharmacology for control of native neuronal signaling proteins. Nat. Neurosci. 2013;16:816–823. doi: 10.1038/nn.3424. [DOI] [PMC free article] [PubMed] [Google Scholar]
- 7.Levitz J., Pantoja C., Isacoff E.Y. Optical control of metabotropic glutamate receptors. Nat. Neurosci. 2013;16:507–516. doi: 10.1038/nn.3346. [DOI] [PMC free article] [PubMed] [Google Scholar]
- 8.Packer A.M., Roska B., Häusser M. Targeting neurons and photons for optogenetics. Nat. Neurosci. 2013;16:805–815. doi: 10.1038/nn.3427. [DOI] [PMC free article] [PubMed] [Google Scholar]
- 9.Yizhar O., Fenno L.E., Deisseroth K. Optogenetics in neural systems. Neuron. 2011;71:9–34. doi: 10.1016/j.neuron.2011.06.004. [DOI] [PubMed] [Google Scholar]
- 10.Klapoetke N.C., Murata Y., Boyden E.S. Independent optical excitation of distinct neural populations. Nat. Methods. 2014;11:338–346. doi: 10.1038/nmeth.2836. [DOI] [PMC free article] [PubMed] [Google Scholar]
- 11.Wietek J., Wiegert J.S., Hegemann P. Conversion of channelrhodopsin into a light-gated chloride channel. Science. 2014;344:409–412. doi: 10.1126/science.1249375. [DOI] [PubMed] [Google Scholar]
- 12.Berndt A., Lee S.Y., Deisseroth K. Structure-guided transformation of channelrhodopsin into a light-activated chloride channel. Science. 2014;344:420–424. doi: 10.1126/science.1252367. [DOI] [PMC free article] [PubMed] [Google Scholar]
- 13.Hochbaum D.R., Zhao Y., Cohen A.E. All-optical electrophysiology in mammalian neurons using engineered microbial rhodopsins. Nat. Methods. 2014;11:825–833. doi: 10.1038/nmeth.3000. [DOI] [PMC free article] [PubMed] [Google Scholar]
- 14.Govorunova E.G., Sineshchekov O.A., Spudich J.L. Characterization of a highly efficient blue-shifted channelrhodopsin from the marine alga Platymonas subcordiformis. J. Biol. Chem. 2013;288:29911–29922. doi: 10.1074/jbc.M113.505495. [DOI] [PMC free article] [PubMed] [Google Scholar]
- 15.Depry C., Mehta S., Zhang J. Multiplexed visualization of dynamic signaling networks using genetically encoded fluorescent protein-based biosensors. Pflugers Arch. 2013;465:373–381. doi: 10.1007/s00424-012-1175-y. [DOI] [PMC free article] [PubMed] [Google Scholar]
- 16.Mehta S., Zhang J. Reporting from the field: genetically encoded fluorescent reporters uncover signaling dynamics in living biological systems. Annu. Rev. Biochem. 2011;80:375–401. doi: 10.1146/annurev-biochem-060409-093259. [DOI] [PMC free article] [PubMed] [Google Scholar]
- 17.Tantama M., Martínez-François J.R., Yellen G. Imaging energy status in live cells with a fluorescent biosensor of the intracellular ATP-to-ADP ratio. Nat. Commun. 2013;4:2550. doi: 10.1038/ncomms3550. [DOI] [PMC free article] [PubMed] [Google Scholar]
- 18.Hung Y.P., Albeck J.G., Yellen G. Imaging cytosolic NADH-NAD+ redox state with a genetically encoded fluorescent biosensor. Cell Metab. 2011;14:545–554. doi: 10.1016/j.cmet.2011.08.012. [DOI] [PMC free article] [PubMed] [Google Scholar]
- 19.Shaner N.C., Steinbach P.A., Tsien R.Y. A guide to choosing fluorescent proteins. Nat. Methods. 2005;2:905–909. doi: 10.1038/nmeth819. [DOI] [PubMed] [Google Scholar]
- 20.Vogt K.E., Gerharz S., Canepari M. Combining membrane potential imaging with L-glutamate or GABA photorelease. PLoS ONE. 2011;6:e24911. doi: 10.1371/journal.pone.0024911. [DOI] [PMC free article] [PubMed] [Google Scholar]
- 21.Tsuda S., Kee M.Z., Augustine G.J. Probing the function of neuronal populations: combining micromirror-based optogenetic photostimulation with voltage-sensitive dye imaging. Neurosci. Res. 2013;75:76–81. doi: 10.1016/j.neures.2012.11.006. [DOI] [PMC free article] [PubMed] [Google Scholar]
- 22.Lim D.H., Mohajerani M.H., Murphy T.H. In vivo large-scale cortical mapping using channelrhodopsin-2 stimulation in transgenic mice reveals asymmetric and reciprocal relationships between cortical areas. Front Neural Circuits. 2012;6:11. doi: 10.3389/fncir.2012.00011. [DOI] [PMC free article] [PubMed] [Google Scholar]
- 23.Wu J., Liu L., Campbell R.E. Improved orange and red Ca2+ indicators and photophysical considerations for optogenetic applications. ACS Chem. Neurosci. 2013;4:963–972. doi: 10.1021/cn400012b. [DOI] [PMC free article] [PubMed] [Google Scholar]
- 24.Zhao Y., Araki S., Campbell R.E. An expanded palette of genetically encoded Ca2+ indicators. Science. 2011;333:1888–1891. doi: 10.1126/science.1208592. [DOI] [PMC free article] [PubMed] [Google Scholar]
- 25.Canepari M., Zecevic D., De Waard M. Combining calcium imaging with other optical techniques. Cold Spring Harb Protoc. 2013;2013:1125–1131. doi: 10.1101/pdb.top066167. [DOI] [PMC free article] [PubMed] [Google Scholar]
- 26.Ogren J.I., Mamaev S., Rothschild K.J. Retinal chromophore structure and Schiff base interactions in the red-shifted channelrhodopsin-1 from Chlamydomonas augustae. Biochemistry (NY). 2014;53:3961–3970. doi: 10.1021/bi500445c. [DOI] [PMC free article] [PubMed] [Google Scholar]
- 27.Spudich J.L., Sineshchekov O.A., Govorunova E.G. Mechanism divergence in microbial rhodopsins. Biochim. Biophys. Acta. Bioenergetics. 2014;1837:546–552. doi: 10.1016/j.bbabio.2013.06.006. [DOI] [PMC free article] [PubMed] [Google Scholar]
- 28.Spudich J.L., Bogomolni R.A. Mechanism of color discrimination by a bacterial sensory rhodopsin. Nature. 1984;312:509–513. doi: 10.1038/312509a0. [DOI] [PMC free article] [PubMed] [Google Scholar]
- 29.Venkatachalam V., Brinks D., Cohen A.E. Flash memory: photochemical imprinting of neuronal action potentials onto a microbial rhodopsin. J. Am. Chem. Soc. 2014;136:2529–2537. doi: 10.1021/ja411338t. [DOI] [PMC free article] [PubMed] [Google Scholar]
- 30.Hou J.H., Venkatachalam V., Cohen A.E. Temporal dynamics of microbial rhodopsin fluorescence reports absolute membrane voltage. Biophys. J. 2014;106:639–648. doi: 10.1016/j.bpj.2013.11.4493. [DOI] [PMC free article] [PubMed] [Google Scholar]
- 31.Chen T.W., Wardill T.J., Kim D.S. Ultrasensitive fluorescent proteins for imaging neuronal activity. Nature. 2013;499:295–300. doi: 10.1038/nature12354. [DOI] [PMC free article] [PubMed] [Google Scholar]
- 32.Berndt A., Yizhar O., Deisseroth K. Bi-stable neural state switches. Nat. Neurosci. 2009;12:229–234. doi: 10.1038/nn.2247. [DOI] [PubMed] [Google Scholar]
- 33.Ritter E., Piwowarski P., Bartl F.J. Light-dark adaptation of channelrhodopsin C128T mutant. J. Biol. Chem. 2013;288:10451–10458. doi: 10.1074/jbc.M112.446427. [DOI] [PMC free article] [PubMed] [Google Scholar]
- 34.Horton R.M., Hunt H.D., Pease L.R. Engineering hybrid genes without the use of restriction enzymes: gene splicing by overlap extension. Gene. 1989;77:61–68. doi: 10.1016/0378-1119(89)90359-4. [DOI] [PubMed] [Google Scholar]
- 35.Gradinaru V., Zhang F., Deisseroth K. Molecular and cellular approaches for diversifying and extending optogenetics. Cell. 2010;141:154–165. doi: 10.1016/j.cell.2010.02.037. [DOI] [PMC free article] [PubMed] [Google Scholar]
- 36.Karbowski M., Arnoult D., Youle R.J. Quantitation of mitochondrial dynamics by photolabeling of individual organelles shows that mitochondrial fusion is blocked during the Bax activation phase of apoptosis. J. Cell Biol. 2004;164:493–499. doi: 10.1083/jcb.200309082. [DOI] [PMC free article] [PubMed] [Google Scholar]
- 37.MacLaurin D., Venkatachalam V., Cohen A.E. Mechanism of voltage-sensitive fluorescence in a microbial rhodopsin. Proc. Natl. Acad. Sci. USA. 2013;110:5939–5944. doi: 10.1073/pnas.1215595110. [DOI] [PMC free article] [PubMed] [Google Scholar]
- 38.Goslin K. The MIT Press; Cambridge, MA: 1998. Culturing Nerve Cells. [Google Scholar]
- 39.Nagel G., Brauner M., Gottschalk A. Light activation of channelrhodopsin-2 in excitable cells of Caenorhabditis elegans triggers rapid behavioral responses. Curr. Biol. 2005;15:2279–2284. doi: 10.1016/j.cub.2005.11.032. [DOI] [PubMed] [Google Scholar]
- 40.Akerboom J., Chen T.W., Looger L.L. Optimization of a GCaMP calcium indicator for neural activity imaging. J. Neurosci. 2012;32:13819–13840. doi: 10.1523/JNEUROSCI.2601-12.2012. [DOI] [PMC free article] [PubMed] [Google Scholar]
- 41.Lin J.Y., Lin M.Z., Tsien R.Y. Characterization of engineered channelrhodopsin variants with improved properties and kinetics. Biophys. J. 2009;96:1803–1814. doi: 10.1016/j.bpj.2008.11.034. [DOI] [PMC free article] [PubMed] [Google Scholar]
- 42.Mattis J., Tye K.M., Deisseroth K. Principles for applying optogenetic tools derived from direct comparative analysis of microbial opsins. Nat. Methods. 2012;9:159–172. doi: 10.1038/nmeth.1808. [DOI] [PMC free article] [PubMed] [Google Scholar]
Associated Data
This section collects any data citations, data availability statements, or supplementary materials included in this article.