

Abstract
The diagnosis of Attention Deficit Hyperactivity Disorder (ADHD) is based on subjective measures despite evidence for multisystemic structural and functional deficits. ADHD patients have consistent neurofunctional deficits in motor response inhibition. The aim of this study was to apply pattern classification to task‐based functional magnetic resonance imaging (fMRI) of inhibition, to accurately predict the diagnostic status of ADHD. Thirty adolescent ADHD and thirty age‐matched healthy boys underwent fMRI while performing a Stop task. fMRI data were analyzed with Gaussian process classifiers (GPC), a machine learning approach, to predict individual ADHD diagnosis based on task‐based activation patterns. Traditional univariate case‐control analyses were also performed to replicate previous findings in a relatively large dataset. The pattern of brain activation correctly classified up to 90% of patients and 63% of controls, achieving an overall classification accuracy of 77%. The regions of the discriminative network most predictive of controls included later developing lateral prefrontal, striatal, and temporo‐parietal areas that mediate inhibition, while regions most predictive of ADHD were in earlier developing ventromedial fronto‐limbic regions, which furthermore correlated with symptom severity. Univariate analysis showed reduced activation in ADHD in bilateral ventrolateral prefrontal, striatal, and temporo‐parietal regions that overlapped with areas predictive of controls, suggesting the latter are dysfunctional areas in ADHD. We show that significant individual classification of ADHD patients of 77% can be achieved using whole brain pattern analysis of task‐based fMRI inhibition data, suggesting that multivariate pattern recognition analyses of inhibition networks can provide objective diagnostic neuroimaging biomarkers of ADHD. Hum Brain Mapp 35:3083–3094, 2014. © 2013 Wiley Periodicals, Inc.
Keywords: ADHD, biomarker, diagnosis, functional magnetic resonance imaging, Gaussian process classifier, inhibition
INTRODUCTION
Attention Deficit Hyperactivity Disorder (ADHD) is the most commonly diagnosed child psychiatric disorder, defined by age‐inappropriate problems with inattention, impulsivity, and hyperactivity [American Psychiatric Association, 2000]. One of the most consistent deficits is in motor response inhibition during the Stop task [Alderson et al., 2007; Rubia et al., 2007a; Willcutt et al., 2005], underpinned by functional magnetic resonance imaging (fMRI) findings of reduced activation in key inhibition areas of ventrolateral prefrontal cortex (VLPFC), supplementary motor area (SMA) and caudate, as well as temporo‐parietal regions [Cubillo et al., 2010, 2012; Hart et al., 2013; Passarotti et al., 2010; Pliszka et al., 2006; Rubia, 2011; Rubia et al., 1999, 2005, 2008, 2010, 2011a, 2013; Smith et al., 2006].
Despite the fact that ADHD is a neurodevelopmental disorder with consistent evidence for brain structure and function deficits [Cubillo et al., 2012; Nakao et al., 2011; Hart et al., 2012, 2013; Rubia, 2011; Valera et al., 2007], currently ADHD is diagnosed solely on the basis of subjective clinical and rating measures, which are often unreliable, leading to diagnostic variability between clinicians, cultures and countries [Polanczyk et al., 2007]. Sensitivity of classification of ADHD children with clinical measures based on Diagnostic and Statistical Manual (DSM)‐IV criteria has been shown to be 70–90% [Weiler et al., 2000], thus misdiagnoses are around 10–30%. It is thus highly desirable to develop additional and more reliable diagnostic methods for ADHD patients that rely on objectively measurable neuroimaging data. Attempts to find objective neuroimaging biomarkers for ADHD, however, have been limited by the fact that in traditional univariate group statistical analyses, subjects in both groups tend to overlap in measures that show group differences and effect sizes have been relatively small [Valera et al., 2007], which has made it difficult to make diagnostic predictions at the level of individual subjects.
In contrast, multivariate pattern analyses (MVPA) for imaging data take into account interactions between regions (i.e., brain structure or function patterns) and can make predictions (e.g., of class membership) for individual subjects as opposed to group‐level inferences. These methods have been shown to provide sensitive and specific diagnostic indicators for individual patients with other pathologies such as autism, depression, and Alzheimer's disease [Ecker et al., 2010; Marquand et al., 2008; Orru et al., 2012].
To date, few imaging studies have used multivariate pattern recognition analyses techniques to classify ADHD patients. A recent competition to apply multivariate methods on a multicenter resting state functional and anatomical imaging dataset of 285 children and adolescents with ADHD and 491 healthy controls (ADHD‐200 Consortium; http://fcon_1000.projects.nitrc.org/indi/adhd200/) was met by a range of classification approaches including random forests, gradient boosting, multi‐kernel learning and support vector machines [Cheng et al., 2012; Colby et al., 2012; Dai et al., 2012; Eloyan et al., 2012]. Accuracies derived by internal cross‐validation ranged from 55–78%, although the accuracies reported on an external test dataset for which diagnostic labels were withheld were substantially lower [61% for the winning team (Eloyan et al., 2012)]. This difference was attributed to a lack of standardization between sites, leading to multiple confounds including missing data, site‐specific differences in behavioural measurements, imaging acquisition, processing, and protocols, scanner quality and other unmeasured confounding and mediating variables. Furthermore, the competition dataset was highly unbalanced, with more control subjects than ADHD patients (63% and 37% respectively) and balanced accuracy measures, caclulated as the mean of sensitivity and specificity, that accommodate this imbalance [Broderson et al., 2012] are consistently lower than the figures reported (e.g., 57.5% for the winning team). In addition, the competition scoring rewarded specificity more than sensitivity so that all teams reported high specificity, but poor sensitivity (21% for the winning team). Also, none of the studies used probabilistic classification models such as Gaussian Process Classifiers (GPCs). GPCs are kernel classifiers used in machine learning, similar to support vector machines (SVMs), which have good performance for fMRI [Marquand et al., 2010]. Their main advantage over alternative methods is that they provide estimates of predictive uncertainty and can accommodate unbalanced diagnostic settings or variations in disease prevalence, which are crucial for clinical applications [Hahn et al., 2012]. The only study that used GPC in structural imaging data in ADHD showed that it is possible to accurately classify 29 ADHD patients relative to controls and patients with autism with an accuracy of over 79% based on structural MRI data [Lim et al., 2013]. Lastly, to our knowledge, no study in ADHD has used multivariate classification methods to task‐related functional imaging data.
The aim of the present study was therefore to test the hypothesis that GPCs of task‐based fMRI data during the tracking Stop task in 30 boys with and 30 healthy boys can identify distributed neurofunctional patterns that will provide accurate diagnostic predictors of ADHD. The tracking Stop task is individually adjusted for accuracy and involves the inhibition of a pre‐potent motor response to a Stop signal that infrequently and unexpectedly follows a go signal. We considered the functional neuroanatomy of the Stop task to be an excellent candidate for a diagnostic biomarker for ADHD since (1) deficits in motor response inhibition in the Stop task are one of the most consistent findings in ADHD [Alderson et al., 2007; Rubia et al., 2007a; Willcutt et al., 2005] and (2) fMRI studies using the Stop task consistently report reduced activation in ADHD patients relative to healthy controls in key areas of motor response inhibition such as right VLPFC, SMA, caudate and thalamus [Cubillo et al., 2010; Hart et al., 2013; Pliszka et al., 2006; Rubia et al., 1999, 2005, 2008, 2010, 2011a].
A secondary aim was to use traditional univariate analyses to replicate previous findings of reduced function in inhibitory regions of VLPFC and the basal ganglia in a relatively large cohort of 30 ADHD patients, given that previous studies were typically conducted in less than 20 subjects [Cubillo et al., 2010; 2013; Passarotti et al., 2010; Pliszka et al., 2006; Rubia et al., 1999, 2008, 2010, 2011a,b, 2005] and to test whether discriminating activation patterns from the MVPA overlapped with activations identified in conventional univariate analysis group comparisons.
METHODS AND MATERIALS
Participants
Sixty right‐handed boys aged between 10–17 years participated. Thirty boys were recruited from clinics with a clinical diagnosis of ADHD, hyperactive‐impulsive/inattentive combined subtype, as assessed by an experienced child psychiatrist using the standardized Maudsley diagnostic interview [Goldberg and Murray, 2002] that assesses ADHD according to DSM‐IV‐TR criteria [American Psychiatric Association, 1994]. ADHD boys scored above clinical threshold for hyperactive‐impulsive/inattentive symptoms on the Strengths and Difficulties Questionnaire for parents (SDQ) [Goodman et al., 2000], the Conners' Parent Rating Scale (CPRS‐R) [Conners et al., 1998], and below clinical threshold on the Social Communication Questionnaire (SCQ) [Rutter et al., 2003]. The majority of the ADHD boys were medication naive (N = 20). The remainder were taking methylphenidate but discontinued treatment for a 48hr washout period prior to scanning (N = 9) or had taken methylphenidate in the past but had discontinued treatment for over a year prior to scanning (N = 1).
Thirty healthy control boys were recruited through advertisement in the same geographical area. They scored below clinical threshold on the SDQ, SCQ and CPRS‐R.
Exclusion criteria for all participants were IQ<70 on the Wechsler Abbreviated Scale of Intelligence (WASI) [Wechsler, 1999], history of substance abuse or neurological deficits, presence of other psychiatric disorder (except for conduct/oppositional defiant disorder in the ADHD group, N = 2), learning disability, reading, speech or language disorder (see Table 1 for demographic and clinical measures).
Table 1.
Demographic and clinical data for 30 boys with ADHD and 30 healthy control boys
| Demographic/clinical measures | Controls Mean (SD) | ADHD Mean (SD) |
|---|---|---|
| Age (years, month) | 14.1 (2.5) | 13.9 (2) |
| IQ | 109 (12) | 92 (11) |
| Conners Parent Rating Scale | 45 (4) | 79 (8) |
| SDQ Hyperactive‐impulsive/inattentive behaviours | 1.9 (2) | 8.6 (1.5) |
| Social Communication Questionnaire | 1.0 (1) | 9 (4.6) |
SDQ, strength and difficulty questionnaire.
One‐way analyses of variance (ANOVAs) showed no significant group differences for age (F(1,58)=0.63; P = 0.43), but for IQ ((F(1,58)=30.379; P < 0.001) which is typical in this population [Kuntsi et al., 2004; Polderman et al., 2006]. Although ANCOVA is commonly conducted in case‐control studies, this is statistically illegitimate when the covariate is typically associated with the disorder and when, as in this study, groups were not randomly selected. It then becomes meaningless to “adjust” the group effects for differences in the covariate, and ANCOVA cannot be used to control group assignment independent of the covariate as it would alter the group effect in potentially problematic ways, leading to spurious results [Dennis et al., 2009; Miller and Chapman, 2001]. Therefore, all analyses were conducted without IQ as a covariate. However, to assess the potential impact of IQ on the classification findings, GPC predictive probabilities were correlated with IQ within each group.
Originally 34 ADHD boys were scanned, but 3 ADHD boys had to be excluded due to high motion and 1 ADHD boy was excluded due to extreme outlying task performance.
Participants received £50 per scanning session. Parental and child informed consent/assent and approval from the local Ethical Committee were obtained.
Stop Task
Participants practiced the 9‐min mixed‐trial, event‐related tracking fMRI Stop task, which measures the ability to suppress an already triggered motor response [Cubillo et al., 2013; Rubia et al., 2003, 2005, 2007b, 2008, 2010, 2013], once prior to scanning. The basic go trials are choice reaction time trials with a mean ITI of 1.8 s, where participants have to respond to go arrows (80% of trials, 236 trials, 1 s duration) pointing either right or left with a right or left button response with the right/left thumb. In 20% of trials (60 trials), the go‐signals are followed by stop‐signals ∼250 ms later and participants have to inhibit their motor responses. A tracking algorithm changes the time interval between go‐signal and stop‐signal onsets in steps of 50 ms according to each subject's performance on previous trials based on the average percentage of inhibition over previous stop trials, recalculated after each stop trial, resulting in 50% successful and 50% unsuccessful inhibition trials [Cubillo et al., 2013; Rubia et al., 2003, 2005, 2007b, 2008, 2010, 2013]. The dependent task variables is the Stop Signal Reaction Time (SSRT), calculated by subtracting the mean stop‐signal delay (SSD: average time between go‐ and stop‐signal, at which the subject inhibited 50% of stop trials) from the mean reaction time (MRT) to go trials, i.e. MRT‐SSD [Logan et al., 1997]. Measures of the Go process of the task are the MRT to go trials and intra‐subject standard deviation of MRT (SD of MRT) and premature responses (defined as responses made 200 ms before stimulus appearance).
fMRI Data Acquisition
Gradient‐echo echoplanar MR imaging (EPI) data were acquired on a GE Signa 3T Horizon HDx system (General Electric, Milwaukee, WI) at the Centre for Neuroimaging Sciences, Institute of Psychiatry, King's College London, UK. A semi‐automated quality control procedure ensured consistent image quality [Simmons, 1999]. The body coil was used for RF transmission and an 8 channel headcoil for RF reception. In each of 28 noncontiguous planes parallel to the anterior‐posterior commissure, 296 T2*‐weighted MR images depicting BOLD (Blood Oxygen Level Dependent) contrast covering the whole brain were acquired with TE = 30 ms, TR = 1.8 s, flip angle = 75°, in‐plane resolution = 3 mm, slice thickness = 5.5 mm (including slice‐skip = 0.5 mm). A high‐resolution gradient echo planar image was also acquired in the inter‐commissural plane, with TE = 30 ms, TR = 1.8 s, flip angle =9 0°, 43 slices, slice thickness = 3.0 mm, slice skip = 0.3 mm, 1.875 mm in‐plane voxel size (matrix size 128x128), providing complete brain coverage.
Univariate fMRI Data Analysis
The software package XBAM was used for univariate analysis (http://www.brainmap.co.uk) [Brammer et al., 1997]. fMRI data were first processed to minimise motion related artifacts [Bullmore et al., 1999]. A 3D volume consisting of the average intensity at each voxel over the whole experiment was calculated and used as a template. The 3D image volume at each time point was then realigned to this template by computing the combination of rotations (around the x y and z axes) and translations (in x y and z) that maximized the correlation between the image intensities of the volume in question and the template (rigid body registration). Following realignment, data were then smoothed using a Gaussian filter (FWHM 2.354 * in‐plane fMRI voxel size mm) to improve the signal to noise characteristics of the images [Bullmore et al., 1999].
After preprocessing, time series analysis for each subject was based on a wavelet‐based data resampling method for fMRI data [Bullmore et al., 1999, 2001]. At the individual subject level, a standard general linear modelling (GLM) approach was used to obtain estimates of the response size (beta) to the Stop task condition (successful stop trials) against an implicit baseline (go trials). After first‐level analysis, the individual statistical maps were normalised into Talairach standard space [Bullmore et al., 2001].
A group brain activation map was then produced for the contrast successful stop–go trials and hypothesis testing was carried out at the cluster level. The detection of activated voxels is extended from voxel to cluster level using a two‐pass method [Bullmore et al., 1999]. We first used a voxel‐level threshold of p < 0.05 to give maximum sensitivity and to avoid type II errors. 3D clusters were then built by joining together adjacent significant voxels. Cluster mass (rather than a cluster extent) threshold was used as a second‐pass cluster statistic, to minimize discrimination against possible small, strongly responding foci of activation [Bullmore et al., 1999]. The cluster‐level threshold was then computed in such a way as to ensure that the final expected number of type I error cluster was less than one per whole brain. For univariate between‐group comparisons an ANOVA was carried out comparing controls with ADHD adolescents.
Pattern Recognition Analysis
GPCs were used to classify ADHD patients from controls on the basis of whole‐brain individual beta maps/GLM coefficients for the Stop task obtained from the univariate analysis, i.e., for the contrast of successful Stop – Go trials. GPC models are Bayesian extensions of logistic regression that aim to learn statistical properties of a set of “training” data that enables accurate prediction of the label of unseen (“test”) data using the rules of probability. For theoretical background and implementation details see [Marquand et al., 2010; Rasmussen, 2006]. The main advantage GPCs hold over alternative methods such as support vector machines is that they provide probabilistic class predictions, thereby accurately quantifying the predictive confidence assigned to each data point. In this work, the GPC modelled the probability of each scan being assigned to the ADHD class (equivalent to 1 minus the probability of each scan being assigned to the control class).
Classifier performance was evaluated using: (i) a receiver operating characteristic (ROC) curve, which plots the classifier's true positive rate (sensitivity) against its false positive rate (1‐specificity) as the decision threshold is varied, (ii) the area under the ROC curve (AUC), which summarises classifier performance across all decision thresholds, and (iii) classification accuracy, which describes the proportion of correct predictions based at a particular decision threshold. The GPC classifier was trained with leave‐one‐out cross‐validation using the PROBID software package (http://www.brainmap.co.uk/PROBID). For each cross‐validation iteration, the data were partitioned into training and test sets, excluding a different participant from each group each time. This process was repeated leaving each participant out once, allowing the sensitivity and specificity to be computed respectively as the number of ADHD and control examples correctly classified over all trials. Statistical significance of the classifier was determined by permutation testing, as described previously [Marquand et al., 2010; Rasmussen, 2006]. Briefly, permutation testing was performed by repeatedly retraining the classifier after permuting the class labels (1000 permutations). A P‐value was computed by counting the number of permutations for which the permuted accuracy was equal or greater than the true (nonpermuted) accuracy, then dividing by 1000. The classifier was trained on a set of whole brain images with only nonbrain tissue masked out. At the given image resolution, this resulted in 21,658 features.
To examine the discriminative value of different brain regions an unthresholded GPC weight map which shows the relative contribution of each voxel to the classifier decision was generated. In addition, two‐tailed Pearson correlation analyses were carried out between GPC predictive probability and ADHD symptom severity using the CPRS ADHD T‐scores and SDQ hyperactive‐impulsive/inattention scores.
RESULTS
Task Performance
The probability of inhibition (PI) did not differ between groups showing that the tracking algorithm worked as expected (t = 0.8; df = 58; P = 0.4). A multivariate ANOVA between controls and ADHD patients showed a significant group effect (F (df = 6, 53) = 3, P < 0.01), due to significantly increased intra‐subject variance to go trials (P < 0.02), and premature responses to go trials (defined as responses made 200 ms before stimulus onset) (P < 0.05) in ADHD relative to control boys. However, groups did not differ in the inhibitory measure of the task, the SSRT (Table 2).
Table 2.
Performance data for 30 boys with ADHD and 30 healthy control boys
| Performance variable | Controls mean (SD) | ADHD mean (SD) |
|---|---|---|
| PI (%) | 50.7 (2.8) | 50.1 (3.4) |
| SSRT (ms) | 168.0 (102.4) | 131.2 (93.3) |
| SSD (ms) | 427.4 (139.1) | 472.2 (81.0) |
| MRT go trials (ms) | 586.8 (114.6) | 587.5 (96.6) |
| SD go trials (ms) | 161.6 (50.6) | 189.3 (36.0) |
| Premature responses (%) | 1.2 (1.7) | 3.2 (5.2) |
PI, probability of inhibition; SSRT, stop signal reaction time; SSD, average stop signal delay, i.e. time between go and stop signal; MRT, mean reaction time; SD, intra‐subject standard deviation.
Brain Activation
Motion
MANOVAs showed no significant group effects in the three dimensional extent of maximum rotation and translation movement parameters for the x, y, and z axes (F(3,56)=2.6; P = n.s.) or in the three‐dimensional Euclidean space (F (1,59) = 0.02, P = n.s.).
Gaussian process analysis
The ROC curve showed that GPC discriminated between ADHD and control subjects above chance across all decision thresholds (Fig. 1A). Accordingly, the AUC for this classifier was 0.81, well above the 0.50 level that would be predicted by chance. At the default decision threshold (i.e., defined by thresholding the probabilistic predictions at 0.5, where a value > 0.5 was deemed to be an ADHD patient), diagnostic classification of patients reached a sensitivity of 90% and specificity of 63%, leading to a diagnostic accuracy of 77% (P < 0.001) (Fig. 1B). The positive predictive value (PPV) was 71.05% and the negative predictive value (NPP) was 86.36%. Notably, only 3 ADHD patients were misclassified as healthy controls. The probabilistic predictions derived from the classifier are shown in Figure 1B along with the decision threshold.
Figure 1.
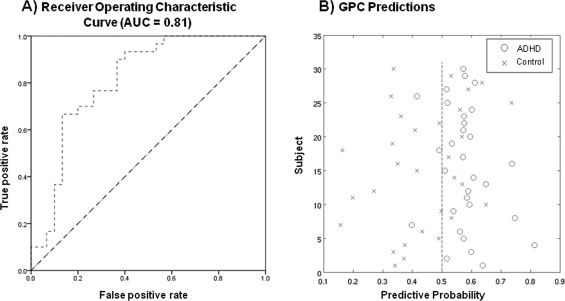
A: Receiver operating characteristic (ROC) curve. Each point on the ROC curve describes the performance of the classifier at a particular decision threshold. Points on the lower left‐hand side of the ROC graph are “conservative,” requiring strong evidence for a positive classification and therefore have low true and false positive rates (TPR/FPR). Points on the upper right‐hand side of the graph are “liberal,” making positive classifications with weak evidence and therefore have a high TPR but also a high FPR. A classifier is more accurate than another if it is closer to the point (1,0), which reflects perfect classification. Chance level is indicated by the dotted diagonal line. B: Classification accuracies for GPC predictions for classifying individuals into either the ADHD or the control group. The x‐axis describes the probability with which each subject is predicted to be an ADHD patient (equal to 1‐ the probability of being a control). The dotted line indicates the decision threshold.
The discriminating global activation pattern was mapped for the Stop task unthresholded (Fig. 2A). Although the discriminating activation pattern is multivariate and therefore encompasses the whole brain, the regions with the highest weight vector coefficients contributing to the delineation between ADHD and healthy boys corresponded to a distributed network of brain regions involved in response inhibition including VLPFC, dorsolateral prefrontal cortex (DLPFC), basal ganglia, thalamus, cingulate, cerebellum and parietal, temporal, and occipital cortices. This discriminating pattern included clusters with magnitude (positive) weights predictive of healthy controls in bilateral VLPFC, DLPFC, and rostromedial frontal cortex, as well as ACC, SMA, and premotor cortices, the basal ganglia (caudate, putamen, and globus pallidus), thalamus, inferior parietal lobes, predominantly right superior temporal areas, posterior cingulate cortex (PCC) and precuneus, parahippocampal gyri, right hippocampus, superior lateral cerebellar regions and cerebellar vermis and some medial and lateral occipital areas. The discriminating patterns with high magnitude (negative) weights predictive of ADHD patients included predominantly ventromedial frontal cortex and ACC, with small areas in DLPFC, left precentral gyrus, anterior and posterior insula, thalamus, predominantly left superior temporal areas, in mid‐cingulate, precuneus, bilateral amygdala, hippocampus, inferior caudate tail, occipital areas, and more inferior cerebellar regions than the ones predictive of controls.
Figure 2.
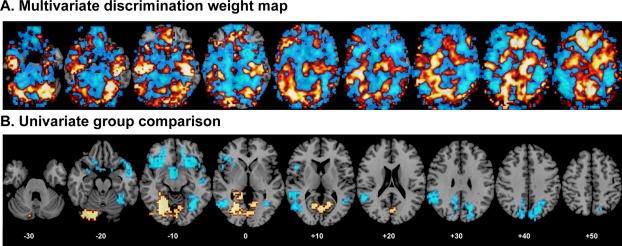
A: Unthresholded GPC weights overlaid on an anatomical template. The color code shows the relative weight of each voxel for the decision boundary (red/yellow scales: higher weights for ADHD boys and blue scales: higher weights for healthy control boys). B: The univariate ANOVA group comparison map at P < 0.05 for voxel and P < 0.01 for clusters, showing brain areas that are decreased in activation in ADHD relative to healthy control boys in blue and brain areas that are increased in activation in ADHD relative to healthy control boys in red/yellow. [Color figure can be viewed in the online issue, which is available at http://wileyonlinelibrary.com.]
Pearson correlation analyses between GPC predictive probabilities and ADHD symptom severity across all subjects were significant for both CPRS‐R ADHD t‐scores (r = 0.4; P < 0.001) and SDQ hyperactivity scores (r = 0.4; P < 0.005).
To test whether IQ impacted upon the GPC predictive probabilities, we correlated betwen the two measures within each group and across all participants. We found no significant correlations with IQ within each group. However, there was a significant negative correlation between GPC predictive values and IQ across all participants (r= −0.3; P < 0.014). Given that a predictive value of > 0.5 was deemed to be classifying ADHD patients, while a value of < 0.5 was deemed to classify controls (see Fig. 1B), the findings suggest that the higher the predictive value for ADHD, the lower the IQ which is in line with the finding of lower IQ values in ADHD relative to controls. There was no correlation across all participants between GPC predictive values and the extent of maximum rotation and translation movement parameters for x, y, and z axes in the three‐dimensional Euclidian space.
Given that the brain function patterns that classified ADHD patients were in earlier developing regions, we tested whether the GPC classifier was correlated with age across all subjects. In fact there was a trend for a significant negative correlation with age (r = −0.25; P < 0.057).
For comparative purposes, to test whether the imaging‐based GPC classification was comparable to a classification based on the clinical behavioral scores, we also conducted a discriminant analysis from group sizes using leave‐one‐out classification and applying cross‐validation to test for sensitivity and specificity of the clinical behavioral scores (i.e. the CPRS and the SDQ for hyperactive/impulsive and inattentive behaviors). The sensitivity (classifying patients) and specificity (classifying controls) were relatively high for both measures: for the CPRS, the sensitivity was 96.3%, the specificity was 100%, and the overall accuracy was 98%; for the SDQ, the sensitivity was 93.3%, the specificity was 100% and the overall accuracy was 96.7%. However, given that groups were selected based on these clinical questionnaires, higher accuracy was to be expected than from the imaging‐based GPC measures.
Univariate analysis results
ANOVA showed that ADHD relative to control boys had reduced activation in two large bilateral clusters in VLPFC reaching subcortically into insula, head of caudate and putamen and in the right hemisphere into superior and middle temporal lobes (Table 3, Fig. 2B). In addition, they had reduced activation in a cluster comprising globus pallidus, nucleus accumbens, putamen, and caudate, in a cluster comprising left superior/middle/inferior temporal and inferior parietal lobe, in a cluster in right fusiform gyrus/inferior temporal lobe and in bilateral precuneus and posterior cingulate. ADHD boys relative to controls had increased activation in a cluster in left cerebellum which extended into bilateral lingual gyrus, cuneus, and PCC (Table 3, Fig. 2B).
Table 3.
Results of the univariate analysis, showing brain regions that are (a) underactivated in ADHD boys relative to healthy controls and (b) overactivated in ADHD boys relative to controls
| Cluster Size | Talairach coordinates | P value | Brodman Area (BA) | Brain region | ||
|---|---|---|---|---|---|---|
| x | y | z | ||||
| (a) Controls > ADHD | ||||||
| 175 | 28 | 25 | −13 | 0.001833 | 47/11/45/38/21 | R VLPFC/superior & middle temporal lobe/insula/caudate head/putamen |
| 164 | −36 | 25 | −9 | 0.001558 | 47/11/45 | L VLPFC/insula/caudate head/putamen |
| 75 | −3 | 14 | −19 | 0.009029 | / | B globus pallidus/nucleus accumbens/ putamen/caudate |
| 106 | −43 | −40 | 6 | 0.002512 | 22/21/39/41/40 | L superior/middle/inferior temporal/ inferior parietal lobe |
| 131 | 39 | −59 | −13 | 0.001487 | 20/37 | R fusiform gyrus/inferior temporal lobe |
| 81 | −50 | −44 | 26 | 0.006506 | 40 | L inferior parietal lobe |
| 91 | −7 | −74 | 39 | 0.007072 | 7/31 | L precuneus/posterior cingulate |
| 122 | 21 | −59 | 26 | 0.002122 | 7/31 | R precuneus/posterior cingulate |
| (b) ADHD > Controls | ||||||
| 615 | −25 | −66 | −6 | 0.000094 | 18/19/30 | L Cerebellum, lingual gyrus, posterior cingulate |
To test whether VLPFC areas that differed between groups were correlated with stop signal reaction time (SSRT), we extracted the BOLD response in these areas and correlated these with SSRT. In controls, the activation in right VLPFC cluster was significantly negatively correlated with SSRT (r = −0.4, P < 0.02).
To test whether the cerebellar activation was a compensation for the reduced fronto‐striatal activation, as previously observed during attention tasks [Christakou et al., 2013; Cubillo et al., 2012; Rubia et al., 2009], we tested for correlations within ADHD patients between this cluster and left and right VLPFC and the basal ganglia clusters. The (increased) cerebellar activation cluster in fact correlated negatively with the (decreased) activation cluster in the basal ganglia (r = −0.4, P < 0.03).
To test whether IQ had an impact on the group difference findings, statistical BOLD response in each cluster that differed between groups was extracted for each subject and correlated with IQ in each group. No correlations with IQ were observed.
DISCUSSION
We demonstrate that it is possible to classify individual ADHD patients based on their functional neuroanatomy pattern of motor response inhibition, at an accuracy of 77%, with 90% sensitivity to correctly identify ADHD boys and 63% specificity to classify controls. Furthermore, the component regions of the discriminative pattern most predictive of controls were in later developing typical inhibition areas of lateral VLPFC and DLPFC, SMA, ACC, striatal, temporo‐parietal and superior cerebellar regions, whilst regions most predictive of ADHD were in earlier developing mostly ventromedial fronto‐limbic areas such as ventromedial frontal cortex, ACC, insula, amygdala, hippocampus, and inferior cerebellum. In addition, the GPC predictive probabilities for ADHD patients were correlated with ADHD severity scores, reinforcing their diagnostic utility. The univariate group difference analysis showed that ADHD patients relative to controls had reduced activation in bilateral VLPFC, caudate and temporo‐parietal regions, which mostly overlapped with the areas that were predictive of classifying controls, suggesting that these areas that classify controls are dysfunctional areas in ADHD. The overall classification accuracy findings of 77% are promising and, if replicated, suggest that it may be possible in the future to use machine learning based pattern recognition analyses to aid in the diagnostic classification of ADHD with a more objective and reliable measure such as a short task‐based fMRI scan.
The classification accuracy of 77% observed in this study is larger than that obtained in other machine learning studies of resting state functional and anatomical data in ADHD [Cheng et al., 2012; Dai et al., 2012, Colby et al., 2012; Eloyan et al., 2012]. They demonstrate for the first time that individuals with ADHD can be differentiated from controls on the basis of their discriminative task‐based neurofunctional activation patterns during inhibitory performance. As GPC is a multivariate technique and considers inter‐regional correlations, discriminative brain networks should be interpreted cautiously as a spatially distributed pattern rather than permitting inference on the constituent regions. GPC identified a distributed network predictive of controls in later developing lateral and medial fronto‐striatal and parieto‐temporal regions that are crucial for motor response inhibition [Aron and Poldrack, 2006; Cai et al., 2012; Chambers et al., 2006, 2009; Juan and Muggleton, 2012; Rubia et al., 2003, 2007b, 2013]. Structurally [Sowell et al., 1999, 2004] and functionally during inhibition tasks (Adleman et al., 2002; Bunge et al., 2002; Rubia et al., 2000; Rubia et al., 2007b; Rubia et al., 2006, Rubia et al., 2013) [for review see (Rubia, 2013)], these lateral prefrontal, striatal and parietal brain regions develop later than the ventromedial prefrontal, limbic (i.e., hippocampus, amygdala) and paralimbic areas (insula) that were predictive of ADHD patients. Our finding of high magnitude weights predictive of controls in later developing lateral fronto‐striato‐parietal regions and for ADHD in earlier developing ventromedial fronto‐limbic regions hence suggest that the ADHD discrimination networks are reflective of more immature activation patterns, while the control discrimination patterns are reflective of a more mature activation pattern for Stop task performance. This was also confirmed in the trend‐wise correlation between age and the GPC probabilistic classification pattern. This would be in line with the notion that ADHD is a disorder of developmental delay, as demonstrated in univariate structural longitudinal analyses that showed a 2–5 year delay in ADHD patients in the maturation of cortical thickness and surface morphology, most prominently in DLPFC and VLPFC, superior temporal and inferior parietal brain regions [Rubia, 2007; Shaw et al., 2007, 2012].
The significant correlation between the GPC predictive probabilities and ADHD symptom severity suggests that the most severely impaired ADHD patients are more confidently predicted by their immature fronto‐limbic activation patterns than the less severely impaired ones, which further reinforces the potential diagnostic value of GPC pattern recognition analyses combined with fMRI for ADHD.
The univariate ANOVA showed that ADHD boys had a significant reduction in the activation of left and right VLPFC, reaching into caudate and superior temporal lobes, as well as in parieto‐temporal regions, replicating previous evidence for consistent fronto‐striatal as well as temporo‐parietal underactivations in ADHD patients during Stop task performance [Cubillo et al., 2010, 2013; Passarotti et al., 2010; Pliszka et al., 2006; Rubia et al., 1999, 2005, 2011b, 2008, 2010], as also confirmed in a recent meta‐analysis [Hart et al., 2013]. While our findings replicate previous work, this study is, to our knowledge, the largest fMRI ADHD dataset on the Stop task, with previous fMRI studies including less than 20 ADHD patients and controls [Cubillo et al., 2010; 2013; Passarotti et al., 2010; Pliszka et al., 2006; Rubia et al., 1999, 2005, 2011b, 2010, 2008]. Interestingly, the key region for inhibitory control, the right VLPFC [Aron et al., 2003; Aron and Poldrack, 2006; Chambers et al., 2006; Rubia et al., 2001, 2003, 2007b, 2013], that was reduced in ADHD patients relative to controls, was also correlated with the main inhibitory task variable, the SSRT, in controls, even though patients were not impaired in this measure. Patients, however, had a more premature and variable response to go trials. The lack of inhibitory performance deficits despite brain function deficits replicates previous fMRI findings in patients with ADHD [Cubillo et al., 2010, 2013; Pliszka et al., 2006; Rubia et al., 1999, 2005, 2011b, 2008] and is likely related to the fact that fMRI stop tasks generally have less behavioral sensitivity than neuropsychological task versions due to the target separation and hence larger predictability of stop trials. Also, neuropsychological studies are typically conducted in children, while we studied an older age group of adolescescents who may have grown out of their performance deficits. It is also possible that the enhanced inferior cerebellar and visual cortex activation in ADHD patients relative to controls may have compensated for the reduced fronto‐striatal‐activations, sparing inhibitory performance deficits. This hypothesis was supported by the negative correlation between cerebellar and striatal activation in ADHD.
Multivariate pattern recognition analyses reveal discriminating activation patterns without necessarily defining the direction of activation. However, the coanalysis of univariate analyses in this study showed that several of the brain areas that were reduced in activation in ADHD relative to control boys in the univariate analyses, in particular left and right VLPFC, the basal ganglia and inferior parietal lobes, overlapped with regions that showed higher weights for discriminating the control group from the ADHD group in the multivariate analysis (see Fig. 2A,B), suggesting that they reflect brain areas that are dysfunctional (i.e., underactivated) in ADHD children.
The fMRI stop task‐based classifier was significantly better than inhibitory performance to discriminate between groups, given that performance did not differ between patients and controls. However, while the task‐based fMRI classification accuracy of 77% was relatively higher than previous attempts to use MVPRA combined with resting state fMRI data, which achieved only a maximum classification accuracy of 61% for the best classification [Eloyan et al., 2012], and was comparable to our accuracy of 79% using GPC analyses combined with brain structure data [Lim et al., 2013], the classification accuracy is nevertheless not high enough to be used in isolation, even if replicated. The discriminant analysis based on clinical measures was substantially higher, in particular for specificity, which was 100% relative to only 77% for the fMRI based GPC classification, while the sensitivity measures for the ADHD classification were relatively comparable, with 93.3% and 96.3% for the clinical measures, and 90% for the fMRI‐ based GPC analysis. However, given that disorders were selected based on these clinical measures, the higher classification accuracy based on these measures was to be expected as clinical diagnostic measures were used as labels for the fMRI‐based classifier. Studies that tested for the sensitivity of classification of ADHD children with clinical measures based on Diagnostic and Statistical Manual (DSM)‐IV criteria have shown that this is between 70–90% [Weiler et al., 2000], thus misdiagnoses are around 10–30%. Task‐based fMRI classification, if replicated across centers and scanners, may therefore have its use as an adjunct to clinical diagnostic measures, in particular for difficult to diagnose cases. However, for its potential use as aid for clinical diagnosis, future studies will have to show disorder‐specificity of fMRI based individual classifications relative to other childhood disorders, as differential diagnosis is typically more challenging than differentiation from controls. For structural MRI classifications we have shown relatively high disorder‐specific accuracy relative to children with autism of over 80% [Lim et al., 2013].
A strength of the study is the relatively large sample, in particular for the univariate analysis. A limitation is the potential confound of IQ differences between cases and controls. However, GPC probabilistic predictors did not correlate with IQ in either group and hence are unlikely to have affected the findings. The univariate analysis results did not correlate with IQ in either group. Furthermore, Stop task performance has been shown to be independent of IQ [Friedman et al., 2006]. IQ correlated with GPC predictive values across both groups, which is, however to be expected, given that both groups differed in IQ and in predictive GPC values (the latter, by definition). Another limitation is that we only included males and the combined hyperactive‐impulsive/inattentive subtype of ADHD which limits the generalizability of the diagnostic classification patterns. Also, future diagnostic utility of pattern classification analyses will rely on its ability to classify ADHD subgroups as to determine disorder‐specificity of classification patterns.
In summary, to our knowledge this is the first study to use multivariate machine‐learning techniques to predict ADHD diagnosis based on task‐based fMRI imaging data showing a classification accuracy of 77%. Whilst classification algorithms are not meant as a substitute for clinical assessment and diagnosis, they may be a useful objective, automated, and reliable complementary diagnostic tool that could reduce variability in clinical practice and, ultimately, may help to improve diagnostic accuracy or to revise clinical diagnosis through biomarker classification of uncertain diagnostic cases.
ACKNOWLEDGMENT
Lilly Pharmaceuticals had no input into the design, analysis, data interpretation or write‐up.
REFERENCES
- Adleman NE, Menon V, Blasey CM, White CD, Warsofsky IS, Glover GH, Reiss AL (2002): A developmental fMRI study of the stroop color‐word task. Neuroimage 16:61–75. [DOI] [PubMed] [Google Scholar]
- Alderson R, Rapport M, Kofler M (2007): Attention‐deficit/hyperactivity disorder and behavioral inhibition: A meta‐analytic review of the stop‐signal paradigm. J Abnormal Child Psychol 35:745–758. [DOI] [PubMed] [Google Scholar]
- American Psychiatric Association (2000): Diagnostic and Statistical Manual of Mental Disorders.American Psychiatric Association. Association AP, editor. Washington, DC. [Google Scholar]
- Aron AR, Fletcher PC, Bullmore ET, Sahakian BJ, Robbins TW (2003): Stop‐signal inhibition disrupted by damage to right inferior frontal gyrus in humans. Nat Neurosci 6:1329–1329. [DOI] [PubMed] [Google Scholar]
- Aron AR, Poldrack RA (2006): Cortical and subcortical contributions to stop signal response inhibition: Role of the subthalamic nucleus. J Neurosci 26:2424–2433. [DOI] [PMC free article] [PubMed] [Google Scholar]
- Brammer MJ, Bullmore ET, Simmons A, Williams SC, Grasby PM, Howard RJ, Woodruff PW, Rabe‐Hesketh S (1997): Generic brain activation mapping in functional magnetic resonance imaging: A nonparametric approach. Magn Resonance Imaging 15:763–770. [DOI] [PubMed] [Google Scholar]
- Bullmore ET, Brammer MJ, Rabe‐Hesketh S, Curtis VA, Morris RG, Williams SCR, Sharma T, McGuire PK (1999): Methods for diagnosis and treatment of stimulus‐correlated motion in generic brain activation studies using fMRI. Hum Brain Mapp 7:38–48. [DOI] [PMC free article] [PubMed] [Google Scholar]
- Bullmore E, Long C, Suckling J, Fadili J, Calvert G, Zelaya F, Carpenter TA, Brammer M (2001): Colored noise and computational inference in neurophysiological (fMRI) time series analysis: Resampling methods in time and wavelet domains. Hum Brain Mapp 12:61–78. [DOI] [PMC free article] [PubMed] [Google Scholar]
- Bunge SA, Dudukovic NM, Thomason ME, Vaidya CJ, Gabrieli JDE (2002): Immature frontal lobe contributions to cognitive control in children: Evidence from fMRI. Neuron 33:301–311. [DOI] [PMC free article] [PubMed] [Google Scholar]
- Cai W, George JS, Verbruggen F, Chambers CD, Aron AR (2012): The role of the right presupplementary motor area in stopping action: Two studies with event‐related transcranial magnetic stimulation. J Neurophysiol 108:380–389. [DOI] [PMC free article] [PubMed] [Google Scholar]
- Chambers CD, Bellgrove MA, Stokes MG, Henderson TR, Garavan H, Robertson IH, Morris AP, Mattingley JB (2006): Executive “brake failure” following deactivation of human frontal lobe. J Cogn Neurosci 18:444–455. [DOI] [PubMed] [Google Scholar]
- Chambers CD, Garavan H, Bellgrove MA (2009): Insights into the neural basis of response inhibition from cognitive and clinical neuroscience. Neurosci Biobehav Rev 33:631–646. [DOI] [PubMed] [Google Scholar]
- Cheng W, Ji X, Zhang J, Feng J (2012): Individual classification of ADHD patients by integrating multiscale neuroimaging markers and advanced pattern recognition techniques. Front Syst Neurosci 6. [DOI] [PMC free article] [PubMed] [Google Scholar]
- Christakou A, Murphy CM, Chantiluke K, Cubillo AI, Smith AB, Giampietro V, Daly E, Ecker C, Robertson D, Murphy DG, et al. (2013): Disorder‐specific functional abnormalities during sustained attention in youth with Attention Deficit Hyperactivity Disorder (ADHD) and with Autism. Mol Psychiatry 18:236–244. [DOI] [PMC free article] [PubMed] [Google Scholar]
- Colby JB, Rudie JD, Brown JA, Douglas PK, Cohen MS, Shehzad Z (2012): Insights into multimodal imaging classification of ADHD. Front Syst Neurosci 6. [DOI] [PMC free article] [PubMed] [Google Scholar]
- Conners CK, Sitarenios G, Parker JDA, Epstein JN (1998): Revision and restandardization of the Conners Teacher Rating Scale (CTRS‐R): Factor structure, reliability, and criterion validity. J Abnormal Child Psychol 26:279–291. [DOI] [PubMed] [Google Scholar]
- Cubillo A, Halari R, Ecker C, Giampietro V, Taylor E, Rubia K (2010): Reduced activation and inter‐regional functional connectivity of fronto‐striatal networks in adults with childhood Attention Deficit Hyperactivity Disorder (ADHD) and persisting symptoms during tasks of motor inhibition and cognitive switching. J Psychiatr Res 44:629–639. [DOI] [PubMed] [Google Scholar]
- Cubillo A, Halari R, Smith A, Taylor E, Rubia K (2012): A review of fronto‐striatal and fronto‐cortical brain abnormalities in children and adults with Attention Deficit Hyperactivity Disorder (ADHD) and new evidence for dysfunction in adults with ADHD during motivation and attention. Cortex 48:194–215. [DOI] [PubMed] [Google Scholar]
- Cubillo A, Smith A, Barrett N, Simmons A, Brammer M, Giampietro V, Rubia K: Shared and drug‐specific effects of atomoxetine and methylphenidate on inhibitory brain dysfunction in medication‐naive ADHD boys. Cerebral Cortex. DOI: http://dx.doi.org/10.1017/S0033291713000676. [DOI] [PMC free article] [PubMed] [Google Scholar]
- Dai D, Wang J, Hua J, He H (2012): Classification of ADHD children through multimodal magnetic resonance imaging. Front Syst Neurosci 6. [DOI] [PMC free article] [PubMed] [Google Scholar]
- Dennis M, Francis DJ, Cirino PT, Schachar R, Barnes MA, Fletcher JM (2009): Why IQ is not a covariate in cognitive studies of neurodevelopmental disorders. J Int Neuropsychol Soc 15:331–343. [DOI] [PMC free article] [PubMed] [Google Scholar]
- Ecker C, Rocha‐Rego V, Johnston P, Mourao‐Miranda J, Marquand A, Daly EM, Brammer MJ, Murphy C, Murphy DG, Consortium MA (2010): Investigating the predictive value of whole‐brain structural MR scans in autism: A pattern classification approach. Neuroimage 49:44–56. [DOI] [PubMed] [Google Scholar]
- Eloyan A, Muschelli J, Nebel MB, Liu H, Han F, Zhao T, Barber AD, Joel S, Pekar JJ, Mostofsky SH, et al. (2012): Automated diagnoses of attention deficit hyperactive disorder using magnetic resonance imaging. Front Syst Neurosci 6. [DOI] [PMC free article] [PubMed] [Google Scholar]
- Friedman NP, Miyake A, Corley RP, Young SE, Defries JC, Hewitt JK (2006): Not all executive functions are related to intelligence. Psychol Sci 18:172–179. [DOI] [PubMed] [Google Scholar]
- Goldberg D, Murray R. 2002. Maudsley Handbook of Practical Psychiatry. Press. OU, editor. Oxford. [Google Scholar]
- Goodman R, Ford T, Simmons H, Gatward R, Meltzer H (2000): Using the strengths and difficulties questionnaire (SDQ) to screen for child psychiatric disorders in a community sample. Br J Psychiatry 177:534–539. [DOI] [PubMed] [Google Scholar]
- Hahn T, Marquand AF, Plichta MM, Ehlis AC, Schecklmann MW, Dresler T, Jarczok TA, Eirich E, Leonhard C, Reif A, et al. (2013): A novel approach to probabilistic biomarker‐based classification using functional near‐infrared spectroscopy. Hum Brain Mapp 34:1102–1114. [DOI] [PMC free article] [PubMed] [Google Scholar]
- Hart H, Radua J, Mataix D, Rubia K (2012): Meta‐analysis of fMRI studies of timing functions in ADHD. Neurosci Biobehav Rev 36:2248–2256. [DOI] [PubMed] [Google Scholar]
- Hart H, Radua J, Nakao T, Mataix‐Cols D, Rubia K (2013): Meta‐analysis of fMRI studies of inhibition and attention in ADHD: exploring task‐specific, stimulant medication and age effects. Archives General Psychiatry 70:185–198. [DOI] [PubMed] [Google Scholar]
- Juan C‐H, Muggleton NG (2012): Brain stimulation and inhibitory control. Brain Stimulation 5:63–69. [DOI] [PubMed] [Google Scholar]
- Kuntsi J, Eley TC, Taylor A, Hughes C, Asherson P, Caspi A, Moffitt TE (2004): Co‐occurrence of ADHD and low IQ has genetic origins. Am J Med Gene Part B: Neuropsychiatric Gene 124:41–47. [DOI] [PubMed] [Google Scholar]
- Lim L, Cubillo A, Smith A, Chantiluke K, Marquand A, Simmons A, Mehta M, Rubia K (2013): Disorder‐specific predictive classification of adolescents with Attention Deficit Hyperactivity Disorder (ADHD) relative to autism using structural magnetic resonance imaging. PLOS One 8:e63660. [DOI] [PMC free article] [PubMed] [Google Scholar]
- Logan GD, Schachar RJ, Tannock R (1997): Impulsivity and inhibitory control. Psychological Sci 8:60–64. [Google Scholar]
- Marquand AF, Mourão‐Miranda J, Brammer MJ, Cleare AJ, Fu CHY (2008): Neuroanatomy of verbal working memory as a diagnostic biomarker for depression. Neuroreport 19:1507–1511 10.1097/WNR.0b013e328310425e. [DOI] [PubMed] [Google Scholar]
- Marquand A, Howard M, Brammer M, Chu C, Coen S, Mourao‐Miranda J (2010): Quantitative prediction of subjective pain intensity from whole‐brain fMRI data using Gaussian processes. Neuroimage 49:2178–2189. [DOI] [PubMed] [Google Scholar]
- Miller G, Chapman J (2001): Misunderstanding analysis of covariance. J Abnormal Psychol 110:40–48. [DOI] [PubMed] [Google Scholar]
- Nakao T, Radua C, Rubia K, Mataix‐Cols D (2011): Gray matter volume abnormalities in ADHD and the effects of stimulant medication: Voxel‐based meta‐analysis. Am J Psychiatry 168:1154–1163. [DOI] [PubMed] [Google Scholar]
- Orru G, Pettersson‐Yeo W, Marquand AF, Sartori G, Mechelli A (2012): Using Support Vector Machine to identify imaging biomarkers of neurological and psychiatric disease: A critical review. Neurosci Biobehav Rev 36:1140–1152. [DOI] [PubMed] [Google Scholar]
- Passarotti AM, Sweeney JA, Pavuluri MN (2010): Neural correlates of response inhibition in pediatric bipolar disorder and attention deficit hyperactivity disorder. Psychiatry Res‐Neuroimaging 181:36–43. [DOI] [PMC free article] [PubMed] [Google Scholar]
- Pliszka SR, Glahn DC, Semrud‐Clikeman M, Franklin C, Perez R, Xiong JJ (2006): Neuroimaging of inhibitory control areas in children with attention deficit hyperactivity disorder who were treatment naive or in long‐term treatment. Am J Psychiatry 163:1052–1060. [DOI] [PubMed] [Google Scholar]
- Polanczyk G, de Lima MS, Horta BL, Biederman J, Rohde LA (2007): The worldwide prevalence of ADHD: A systematic review and metaregression analysis. Am J Psychiatry 164:942–948. [DOI] [PubMed] [Google Scholar]
- Polderman T, Gosso M, Posthuma D, Van Beijsterveldt T, Heutink P, Verhulst F, Boomsma D (2006): A longitudinal twin study on IQ, executive functioning, and attention problems during childhood and early adolescence. Acta Neurol Belg 106:191–207. [PubMed] [Google Scholar]
- Rasmussen C, Williams CKI. 2006. Gaussian Processes for Machine Learning. The MIT Press: Cambridge MA. [Google Scholar]
- Rubia K (2007): Neuro‐anatomic evidence for the maturational delay hypothesis of ADHD. Proc Natl Acad Sci USA 104:19663–19664. [DOI] [PMC free article] [PubMed] [Google Scholar]
- Rubia K (2011): “Cool” inferior fronto‐striatal dysfunction in Attention Deficit Hyperactivity Disorder (ADHD) versus “hot” ventromedial orbitofronto‐limbic dysfunction in conduct disorder: A review. Biol Psychiatry 69:e69–e87. [DOI] [PubMed] [Google Scholar]
- Rubia K (2013): Functional brain imaging across development. Eur Child Adolescent Psychiatry 1–13. published online first: DOI 10.1007/s00787-012-0291-8. [DOI] [PMC free article] [PubMed]
- Rubia K, Overmeyer S, Taylor E, Brammer M, Williams SC, Simmons A, Bullmore ET (1999): Hypofrontality in attention deficit hyperactivity disorder during higher‐order motor control: A study with functional MRI. Am J Psychiatry 156:891–896. [DOI] [PubMed] [Google Scholar]
- Rubia K, Overmeyer S, Taylor E, Brammer M, Williams S, Simmons A, Andrew C, Bullmore E (2000): Functional frontalisation with age: Mapping neurodevelopmental trajectories with fMRI. Neurosci Biobehav Rev 24:13–19. [DOI] [PubMed] [Google Scholar]
- Rubia K, Overmeyer S, Taylor E, Brammer M, Williams SCR, Simmons A, Andrew C, Giampietro V, Bullmore ET (2001): Mapping motor inhibition: Conjunctive brain activations across different versions of go/no‐go and stop tasks. NeuroImage 13:250–261. [DOI] [PubMed] [Google Scholar]
- Rubia K, Smith AB, Brammer MJ, Taylor E (2003): Right inferior prefrontal cortex mediates response inhibition while mesial prefrontal cortex is responsible for error detection. Neuroimage 20:351–358. [DOI] [PubMed] [Google Scholar]
- Rubia K, Smith AB, Brammer MJ, Toone B, Taylor E. (2005): Abnormal brain activation during inhibition and error detection in medication‐naive adolescents with ADHD. Am J Psychiatry 162:1067–1075. [DOI] [PubMed] [Google Scholar]
- Rubia K, Smith AB, Woolley J, Nosarti C, Heyman I, Taylor E, Brammer M (2006): Progressive increase of frontostriatal brain activation from childhood to adulthood during event‐related tasks of cognitive control. Hum Brain Mapp 27:973–993. [DOI] [PMC free article] [PubMed] [Google Scholar]
- Rubia K, Smith A, Brammer M, Taylor E (2007a): Performance of children with Attention Deficit Hyperactivity Disorder (ADHD) on a test battery for impulsiveness. Child Neuropsychol 30:659–695. [DOI] [PubMed] [Google Scholar]
- Rubia K, Smith AB, Taylor E, Brammer M (2007b): Linear age‐correlated functional development of right inferior fronto‐striato‐cerebellar networks during response inhibition and anterior Cingulate during error‐related processes. Hum Brain Mapp 28:1163–1177. [DOI] [PMC free article] [PubMed] [Google Scholar]
- Rubia K, Halari R, Smith AB, Mohammed M, Scott S, Giampietro V, Taylor E, Brammer MJ (2008): Dissociated functional brain abnormalities of inhibition in boys with pure conduct disorder and in boys with pure attention deficit hyperactivity disorder. Am J Psychiatry 165:889–897. [DOI] [PubMed] [Google Scholar]
- Rubia K, Halari R, Cubillo A, Mohammad M, Taylor E (2009): Methylphenidate normalises activation and functional connectivity deficits in attention and motivation networks in medication‐naïve children with ADHD during a Rewarded Continuous Performance Task. Neuropharmacology 57:640–652. [DOI] [PubMed] [Google Scholar]
- Rubia K, Cubillo A, Smith AB, Woolley J, Heyman I, Brammer MJ (2010): Disorder‐specific dysfunction in right inferior prefrontal cortex during two inhibition tasks in boys with attention‐deficit hyperactivity disorder compared to boys with obsessive‐compulsive disorder. Hum Brain Mapp 31:287–299. [DOI] [PMC free article] [PubMed] [Google Scholar]
- Rubia K, Halari R, Cubillo A, Smith A, Mohammad M, Brammer M, Taylor E (2011a): Methylphenidate normalises fronto‐striatal underactivation during interference inhibition in medication‐naive boys. Neuropsychopharmacology 36:1575–1586. [DOI] [PMC free article] [PubMed] [Google Scholar]
- Rubia K, Halari R, Mohammad AM, Taylor E, Brammer M (2011b): Methylphenidate normalizes frontocingulate underactivation during error processing in attention‐deficit/hyperactivity disorder. Biol Psychiatry 70:255–262. [DOI] [PMC free article] [PubMed] [Google Scholar]
- Rubia K, Lim L, Ecker C, Halari R, Giampietro V, Simmons A, Brammer M, Smith A (2013): Effects of age and gender on neural networks of motor response inhibition: From adolescence to adulthood. Neuroimage, published online first: 10.1016/j.neuroimage.2013.06.078. [DOI] [PubMed] [Google Scholar]
- Rutter M, Bailey L, Lord C, editors. 2003. Social Communication Question. Los Angeles, USA: Western Psychological Services. [Google Scholar]
- Shaw P, Eckstrand K, Sharp W, Blumenthal J, Lerch JP, Greenstein D, Clasen L, Evans A, Giedd J, Rapoport JL (2007): Attention‐deficit/hyperactivity disorder is characterized by a delay in cortical maturation. Proc Natl Acad Sci USA 104:19649–19654. [DOI] [PMC free article] [PubMed] [Google Scholar]
- Shaw P, Malek M, Watson B, Sharp W, Evans A, Greenstein D (2012): Development of cortical surface area and gyrification in attention‐deficit/hyperactivity disorder. Biol Psychiatry 72:191–197. [DOI] [PMC free article] [PubMed] [Google Scholar]
- Simmons A, Moore E, Williams SCR (1999): Quality control for functional magnetic resonance imaging using automated data analysis and Shewhart Charting. Magn Resonance Med 41:1274–1278. [DOI] [PubMed] [Google Scholar]
- Smith AB, Taylor E, Brammer M, Toone B, Rubia K (2006): Task‐specific hypoactivation in prefrontal and temporoparietal brain regions during motor inhibition and task switching in medication‐naive children and adolescents with attention deficit hyperactivity disorder. Am J Psychiatry 163:1044–1051. [DOI] [PubMed] [Google Scholar]
- Sowell ER, Thompson PM, Holmes CJ, Batth R, Jernigan TL, Toga AW (1999): Localizing age‐related changes in brain structure between childhood and adolescence using statistical parametric mapping. Neuroimage 9:587–597. [DOI] [PubMed] [Google Scholar]
- Sowell ER, Thompson PM, Toga AW (2004): Mapping changes in the human cortex throughout the span of life. Neuroscientist 10:372–392. [DOI] [PubMed] [Google Scholar]
- Wechsler D (1999): Wechsler Abbreviated Scale of Intelligence. San Antonio, Texas: The Psychological Corporation. [Google Scholar]
- Weiler MD, Bellinger D, Simmons E, et al. (2000): Reliability and validity of a DSM‐IV based ADHD screener. Child Neuropsychol 6:3–23. [DOI] [PubMed] [Google Scholar]
- Willcutt EG, Doyle AE, Nigg JT, Faraone SV, Pennington BF (2005): Validity of the executive function theory of attention‐deficit/hyperactivity disorder: A meta‐analytic review. Biol Psychiatry 57:1336–1346. [DOI] [PubMed] [Google Scholar]