Abstract
The implantation of animal organs is one approach to overcoming the shortage of human donor organs for medical transplantation. Although readily available, non-primate tissues are subject to hyperacute rejection wherein human anti-Galα(1–3)Gal antibodies react with haptens present on the transplanted cells’ surfaces. The understanding of this interaction on a molecular level will further the development of a strategy for the prevention of hyperacute rejection in xenotransplantation. The Galα(1–3)Gal hapten (‘xenograft antigen’) has been cocrystallized with the Gal-specific B4 isolectin of Griffonia simplicifolia lectin-1. Crystals were analyzed by cryocrystallography and were found to diffract to moderately high resolution on a rotating-anode X-ray source. They belong to the P21212 space group, with unit-cell parameters a = 111.0, b = 51.3, c = 76.9Å, and contain two molecules per asymmetric unit.
1. Introduction
In the process of hyperacute rejection (Platt & Bach, 1991), Galα(1–3)Galβ(1–4)GlcNAc-R, known as the xenograft antigen, triggers the rejection of non-primate tissues from human transplant recipients (Good et al., 1992; Sandrin et al., 1993; Galili, 1993). The ubiquitous presence of anti-Galα(1–3)Gal antibodies in humans, Old World monkeys and apes is paralleled by the absence of Galα(1–3)Gal on the cell surfaces of those species (Galili et al., 1987). Evolutionary pressure may have led to the suppression of α1,3-galactosyltransferase and thus the absence of Galα(1–3)Gal epitopes in those cases (Galili, 1999).
G. simplicifolia lectin-1 (GS-1) is a carbohydrate-binding protein present in the seeds of the African leguminous shrub. As isolated, GS-1 is a mixture of five tetrameric isolectins that vary in their content of A and B subunits (Murphy & Goldstein, 1977). Similar to other legume lectins, GS-1 loses its carbohydrate-binding activity upon removal of metal ions (Hayes & Goldstein, 1974) and it has been postulated (Loris et al., 1998) that the simultaneous presence of both Ca2+ and a transition-metal ion such as Mn2+ is required for carbohydrate-binding activity of these lectins. Indeed, Mn2+ and Ca2+ are both observed in the reported structure of a complex of G. simplicifolia lectin-4 (Delbaere et al., 1993). In contrast, the addition of Ca2+ alone can restore GS-1 activity from samples where Mn2+ and Zn2+ have been removed beyond the limit of detection (Hayes & Goldstein, 1974).
Labelled derivatives of GS-1 isolectin B4 (GS-1-B4) are distributed commercially as a marker for non-primate mammalian tissues (Laitinen et al., 1987; Laitinen, 1987; Christie & Thomson, 1989). Competitive binding studies have shown affinity of GS-1-B4 for the Galα(1–3)Gal epitope (Wood et al., 1979). It has also become a useful tool in structural studies of xenograft-antigen recognition. In fact, inhibitors of anti-Galα(1–3)Gal antibodies also block carbohydrate binding to GS-1-B4 (Kooyman et al., 1996; Vaughan et al., 1996; Sandrin et al., 1997). In an effort to improve understanding of xenograft-antigen recognition at a structural level, we undertook the crystal structure analysis of the GS-1-B4– Galα(1–3)Gal complex by X-ray diffraction. The structure will serve as the basis for the design of effective inhibitors of Galα(1–3)Gal binding to both GS-1-B4 and, owing to the cross-reactivity established in several studies, to anti-Galα(1–3)Gal antibodies. It is therefore anticipated that the structural information resulting from this effort will contribute to the development of structure-based approaches to the prevention of xenograft rejection (McKenzie et al., 1996).
2. Materials and methods
Lectin-1 isolectin B4 from G. simplicifolia, GS-1-B4, was purchased from Vector Laboratories (catalog No. L1104) and used without further purification. Galα(1–3)Gal β-methyl glycoside was purchased from Calbiochem-Novabiochem Corporation (catalog No. 345523) and used without further purification. The protein was reconstituted to the desired concentration in a solution containing 10 mM HEPES buffer pH 8.5, 150 mM NaCl, 0.1 mM CaCl2, 0.08% NaN3 and 1.1 mM Galα(1–3)Galβ-methyl glycoside. This solution was passed through a 0.2 μm filter prior to crystallization experiments.
Crystallization experiments were conducted at 293 K using hanging-drop vapor diffusion. Linbro plates (Hampton Research, HR3-110) and siliconized cover slides (Hampton Research, HR3-241) were used. The volume of reservoir precipitant solution was 500 μl. Initial screening for crystallization conditions was carried out with the Hampton Crystal Screen kit (Hampton Research, HR2-110) by mixing 2 μl of protein solution (protein concentration 5 mg ml−1) with an equal volume of precipitant solution. For the preparation of diffraction-quality crystals, 1.5 μml of protein solution (protein concentration 10 mg ml−1) was mixed first with 0.3 μl [0.02%(w/v)] of detergent NP-40 (Calbiochem-Novabiochem, 492015) and then with 1.5 μl of precipitant solution [11%(w/v) PEG 4000, 8%(v/v) MPD, 6%(v/v) DMSO, 0.1 M HEPES buffer pH 7.5].
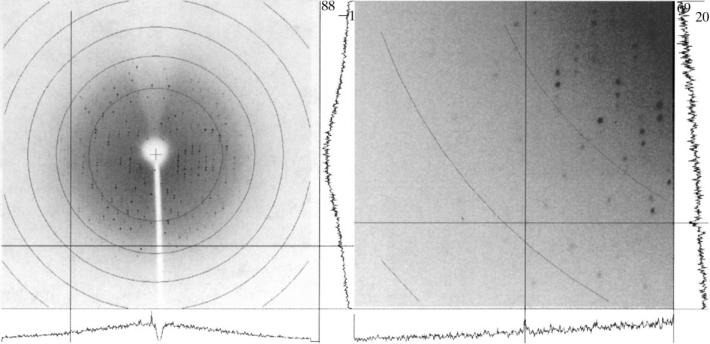
Crystals were mounted in loops (Teng, 1990; Hampton Research, HR4-955) and placed in a stream of cold (93 K) nitrogen gas after brief (few seconds) incubation in a 1:3(v/v) mixture of neat MPD and precipitant solution. Data were recorded using 5 kW Cu Kα radiation generated by a Rigaku RU-200 rotating anode and focused with MSC Blue confocal optics. A total of 198 1° oscillation images (Fig. 1), each exposed for 15 min, were collected on a Rigaku R-AXIS IV image-plate detector using a crystal-to-detector distance of 180 mm. External control of the goniostat, generator and detector was provided by a PC running CrystalClear (Molecular Structure Corporation). Data were indexed, integrated and scaled using the HKL suite (Otwinowski & Minor, 1997).
Figure 1.
Typical 1° oscillation image obtained during data collection. In the zoomed image (right), a reflection at 2.65Å and I/σ of 2.4 is marked by the cross hair. I/σ for this reflection is also illustrated by the intensity profiles at the lower and right-hand side margins of the images.
For molecular replacement, the CNS software suite (Brunger et al., 1998) was used employing the peptide chain of PDB file 1gsl (Delbaere et al., 1993) as a search model.
3. Results and discussion
It is of interest to note that G. simplicifolia lectin-1 has eluded previous attempts at crystallographic analysis (Goldstein, 2000). This is consistent with our own failure to produce well diffracting crystals of the native protein in the absence of carbohydrate ligand.
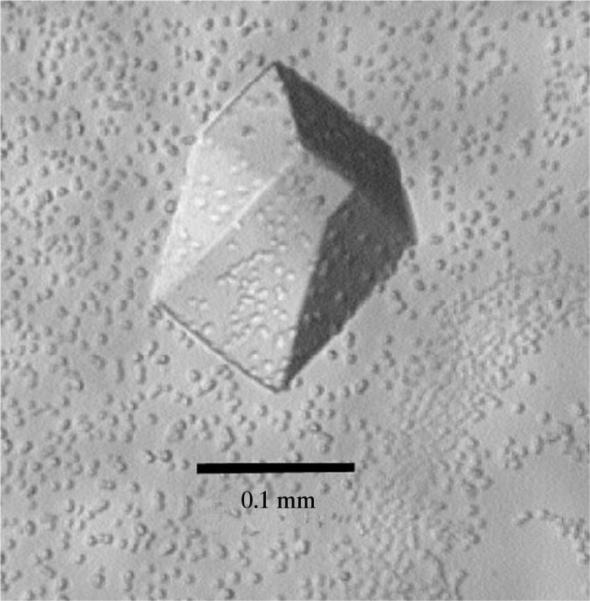
Galα(1–3)Galβ-methyl glycoside (Fig. 2) was chosen as the carbohydrate ligand for the purpose of this study. It conserves the terminus of the α-Gal epitope Galα(1–3)Galβ(1–4)GlcNAc-R which is found on non-primate mammalian cells. In the presence of carbohydrate ligand, sparse-matrix screening (Jancarik & Kim, 1991) produced small crystals with a precipitant solution consisting of 20%(w/v) PEG 4000, 10%(v/v) 2-propanol, 0.1 M HEPES buffer pH 7.5. We noticed that crystal stability was compromised during crystal handling owing to evaporation of 2-propanol. This problem was overcome through substitution of 10%(v/v) MPD for 2-propanol. Modification of precipitant concentration had the most noticeable effect on the final crystal size. For the preparation of diffraction-quality crystals the concentration of lectin in the protein–ligand solution was doubled to 10 mg ml−1, thereby reducing the optimum concentration of PEG 4000 in the precipitant solution. The addition of DMSO to the well solution and of NP-40 to the crystallization drop improved the final crystal size and inhibited the formation of precipitate. The beneficial effect of addition of DMSO to the precipitant solution is likely to be the result of precipitant dilution. Crystals with excellent morphology and measuring approximately 0.05 mm in their largest dimension were observed after 2–3 d. These crystals grew to a size of approximately 0.15 mm within two weeks (see Fig. 3).
Figure 2.
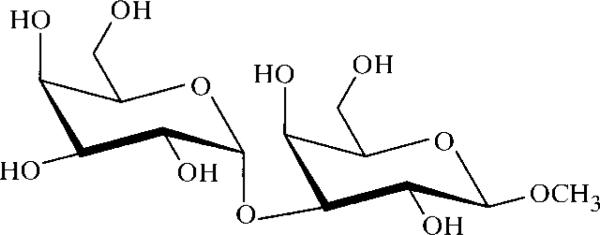
For the purpose of this study, the xenograft antigen was presented as the β-methyl glycoside.
Figure 3.
Crystal of GS-B4 grown in the presence of Galα(1–3)Galβ-OMe.
Crystals were initially mounted without additional cryoprotecting treatment. Although ice rings were not visible on the oscillation images, a high crystal mosaicity was apparent. We therefore briefly immersed crystals into a 1:3(v/v) mixture of neat MPD and precipitant solution prior to mounting of the crystal in the X-ray beam and found the mosaicity acceptable.
The data indexed in a primitive ortho-rhombic lattice and gave refined unit-cell parameters a = 111.0, b = 51.3, c = 76.9Å. Refinement of mosaicity gave an average value of 1.0° over all images. Data-processing statistics are listed in Table 1. Examination of the three-dimensional data set gave systematic absences of h = 2n + 1 in h00 and k = 2n + 1 in 0k0, indicating that the space group is P21212 (Table 1).
Table 1.
Data-processing statistics.
| Resolution range (Å) | 30.00–2.65 | 2.77–2.65 |
|---|---|---|
| No. of unique observed reflections | 12864 | 1541 |
| Completeness (%) | 97.4 | 95.9 |
| 〈I〉/〈σ〉 | 27.8 | 6.7 |
| Redundancy for unique reflections | ||
| >3 observations (%) | 94.7 | 91.27 |
| >6 observations (%) | 80.5 | 77.2 |
| Rmerge† (%) | 6.9 | 28.0 |
Rmerge = ∑ |I – 〈I〉|/ ∑ I.
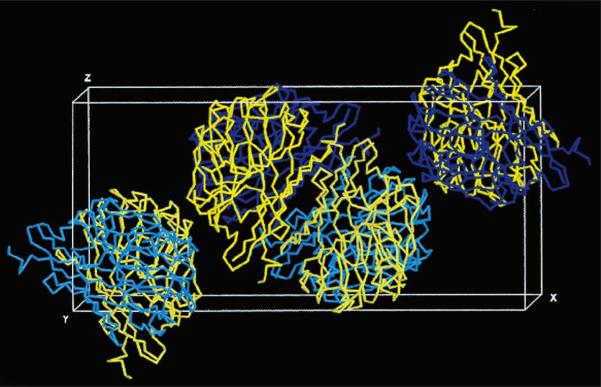
Structure solution by molecular replacement was attempted using several lectin structures as search models. The GS-4 structure (PDB code 1gsl; Delbaere et al., 1993) produced the best results. Although the sequencing of GS-1-B4 is in progress, a BLAST (Altschul et al., 1990) alignment of the N-terminal GS-1-B4 sequence (Lamb & Goldstein, 1984) showed a 44% identity with that of GS-4. The initial cross-rotation search (DeLano & Brünger, 1995) gave a solution with a rotation function value of 0.0657 at ε = 0.25 at θ1 = 334, θ2 = 78, θ3 = 278°. Using this solution, the translation search (Navaza & Vernoslova, 1995) followed by rigid-body refinement placed the single polypeptide chain at θ1 = 332, θ2 = 78, θ3 = 278°, xtrans = 42.2, ytrans = 7.6, ztrans = 13.8Å with an R factor of 54.6% and a packing coefficient of 0.36 using 8–4Å resolution data. The second molecule in the asymmetric unit was placed at θ1 = 332, θ2 = 79, θ3 = 203°, xtrans = –11.0, ytrans = 15.3, ztrans = 24.7Å by fixing the coordinates of the first molecule and performing translation searches on the remaining cross-rotation function solutions. After placing the second molecule in the asymmetric unit, the crystallographic residual improved to 47.3%, with a packing coefficient of 0.70. The crystal packing is represented in Fig. 4. Based on this structure solution and assuming a molecular weight of 30.4 kDa for each subunit, the Matthews coefficient and solvent content are calculated to be 1.8Å Da−1 and 32%, respectively. These values fall at the low end of the range determined for the original set of protein crystals (Matthews, 1968).
Figure 4.
Representation of crystal packing: the Cα trace of PDB file 1gsl is placed in the unit cell according to the structure solution by molecular replacement. For each of the four asymmetric units shown, subunit 1 is drawn in yellow, while subunit 2 can be seen in blue. For clarity, the cell origin was shifted along y by one half of the unit-cell edge. The contents of the two asymmetric units in the center of the unit cell constitute the biologically active tetramer. This image was generated using the program RasMol (Bernstein, 2001).
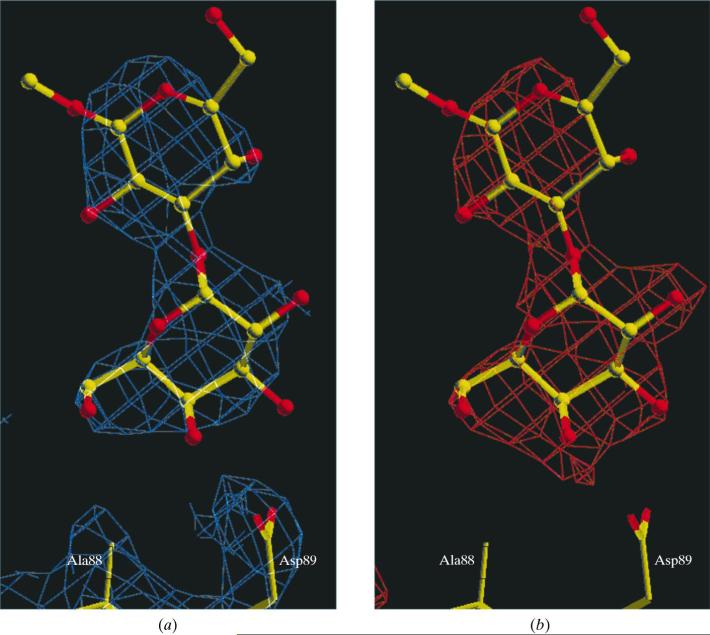
Complete structural refinement is awaiting the outcome of amino-acid sequence determination of GS-1-B4. However, initial electron-density maps calculated from the molecular-replacement phases (CNS) showed density for the carbohydrate ligand in the lectin's putative binding site (see Fig. 5). The fully refined GS-1-B4–Galα(1–3)Galβ-methyl glycoside structure will reveal details of xenograft-antigen recognition by a protein that exhibits a high degree of cross-reactivity with the antibodies that cause the hyper-acute rejection of xenografts in primates.
Figure 5.
The images depict a region of the asymmetric unit where specific binding of a carbohydrate ligand by the lectin is expected to occur by homology with the GS-4 complex in 1gsl. In (a) a 2Fo – Fc difference map is shown at 1.3σ (blue); in (b) a Fo – Fc map at 2.7σ can be seen in red for the same region. Ligand coordinates were not included for the map calculation but are shown here for clarity as a ball-and-stick model. The numbering of peptide side chains conforms to that used in 1gsl. The images were generated using the program O (Jones et al., 1991).
Acknowledgments
We thank the Mizutani Glycoscience Foundation and the Office of the Vice President for Research, The University of Georgia for financial support. We are indebted to Dr Ron Orlando for the mass-spectrometric analysis of GS-1-B4 and related peptides.
References
- Altschul SF, Gish W, Miller W, Myers EW, Lipman DJ. J. Mol. Biol. 1990;215:403–410. doi: 10.1016/S0022-2836(05)80360-2. [DOI] [PubMed] [Google Scholar]
- Bernstein HJ. RasMol Version 2.7.1.1. 2001 http://www.bernstein-plus-sons.com/software/rasmol/
- Brunger AT, Adams PD, Clore GM, DeLano WL, Gros P, Grosse-Kunstleve RW, Jiang JS, Kuszewski J, Nilges M, Pannu NS, Read RJ, Rice LM, Simonson T, Warren GL. Acta Cryst. 1998;D54:905–921. doi: 10.1107/s0907444998003254. [DOI] [PubMed] [Google Scholar]
- Christie KN, Thomson C. J. Histochem. Cytochem. 1989;37:1303–1304. doi: 10.1177/37.8.2754256. [DOI] [PubMed] [Google Scholar]
- DeLano WL, Brünger AT. Acta Cryst. 1995;D51:740–748. doi: 10.1107/S0907444995001284. [DOI] [PubMed] [Google Scholar]
- Delbaere LT, Vandonselaar M, Prasad L, Quail JW, Wilson KS, Dauter Z. J. Mol. Biol. 1993;230:950–965. doi: 10.1006/jmbi.1993.1212. [DOI] [PubMed] [Google Scholar]
- Galili U. Immunol. Today. 1993;14:480–482. doi: 10.1016/0167-5699(93)90261-i. [DOI] [PubMed] [Google Scholar]
- Galili U. In: Subcellular Biochemistry, Vol. 32, α-Gal and Anti-Gal. Galili U, Avila JL, editors. Kluwer Academic/Plenum Press; New York: 1999. pp. 1–23. [Google Scholar]
- Galili U, Clark MR, Shohet SB, Buehler J, Macher BA. Proc. Natl Acad. Sci. USA. 1987;84:1369–1373. doi: 10.1073/pnas.84.5.1369. [DOI] [PMC free article] [PubMed] [Google Scholar]
- Goldstein IJ. Personal communication. 2000 [Google Scholar]
- Good AH, Cooper DKC, Malcolm AJ, Ippolito RM, Koren E, Neethling FA, Ye Y, Zuhdi N, Lamontagne LR. Transplant. Proc. 1992;24:559–562. [PubMed] [Google Scholar]
- Hayes CE, Goldstein IJ. J. Biol. Chem. 1974;249:1904–1914. [PubMed] [Google Scholar]
- Jancarik J, Kim S-H. J. Appl. Cryst. 1991;24:409–411. [Google Scholar]
- Jones TA, Zou JY, Cowan SW, Kjeldgaard M. Acta Cryst. 1991;A47:110–119. doi: 10.1107/s0108767390010224. [DOI] [PubMed] [Google Scholar]
- Kooyman DL, McClellan SB, Parker W, Avissar PL, Velardo MA, Platt JL, Logan JS. Transplantation. 1996;61:851–855. doi: 10.1097/00007890-199603270-00001. [DOI] [PubMed] [Google Scholar]
- Laitinen L. Histochem. J. 1987;19:225–234. doi: 10.1007/BF01680633. [DOI] [PubMed] [Google Scholar]
- Laitinen L, Virtanen I, Saxen L. J. Histochem. Cytochem. 1987;35:55–65. doi: 10.1177/35.1.3794309. [DOI] [PubMed] [Google Scholar]
- Lamb JE, Goldstein IJ. Arch. Biochem. Biophys. 1984;229:15–26. doi: 10.1016/0003-9861(84)90125-5. [DOI] [PubMed] [Google Scholar]
- Loris R, Hamelryck T, Bouckaert J, Wyns L. Biochim. Biophys. Acta. 1998;1383:9–36. doi: 10.1016/s0167-4838(97)00182-9. [DOI] [PubMed] [Google Scholar]
- McKenzie IFC, Osman N, Cohney S, Vaughan HA, Patton K, Mouhtouris E, Atkin JD, Elliott E, Fodor WL, Squinto SP, Burton D, Gallop MA, Oldenburg KR, Sandrin MS. Transplantation Proc. 1996;28:537. [PubMed] [Google Scholar]
- Matthews BW. J. Mol. Biol. 1968;33:491–497. doi: 10.1016/0022-2836(68)90205-2. [DOI] [PubMed] [Google Scholar]
- Murphy LA, Goldstein IJ. J. Biol. Chem. 1977;252:4739–4742. [PubMed] [Google Scholar]
- Navaza J, Vernoslova E. Acta Cryst. 1995;A51:445–449. [Google Scholar]
- Otwinowski Z, Minor W. Methods Enzymol. 1997;276:307–326. doi: 10.1016/S0076-6879(97)76066-X. [DOI] [PubMed] [Google Scholar]
- Platt JL, Bach FH. Curr. Opin. Immunol. 1991;3:735–739. doi: 10.1016/0952-7915(91)90105-a. [DOI] [PubMed] [Google Scholar]
- Sandrin MS, Vaughan HA, Dabkowski PL, McKenzie IFC. Proc. Natl Acad. Sci. USA. 1993;90:11391–11395. doi: 10.1073/pnas.90.23.11391. [DOI] [PMC free article] [PubMed] [Google Scholar]
- Sandrin MS, Vaughan HA, Xing PX, McKenzie IFC. Glycoconj. J. 1997;14:97–105. doi: 10.1023/a:1018521217276. [DOI] [PubMed] [Google Scholar]
- Teng TY. J. Appl. Cryst. 1990;23:387–391. [Google Scholar]
- Vaughan HA, Oldenburg KR, Gallop MA, Atkin JD, McKenzie IFC, Sandrin MS. Xenotransplantation. 1996;3:18–23. [PubMed] [Google Scholar]
- Wood C, Kabat EA, Murphy LA, Goldstein IJ. Arch. Biochem. Biophys. 1979;198:1–11. doi: 10.1016/0003-9861(79)90389-8. [DOI] [PubMed] [Google Scholar]


