Abstract
A CMOS Hall-effect sensor chip designed for the characterization and detection of magnetic nanoparticles (MNPs) achieves over three orders of magnitude better temporal resolution than prior solutions based on superconducting quantum interference devices and fluxgate sensors. The sensor relies on wires embedded in the chip to generate a local magnetizing field that is switched OFF rapidly to observe the relaxation field of the MNPs. The CMOS sensor chip, with integrated high-speed readout electronics, occupies 6.25 mm2. It can be easily integrated with microfluidics and is suitable for lab-on-a-chip and point-of-care applications.
Index Terms: Biosensor, CMOS, Hall-effect devices, magnetic nanoparticles (MNPs), magnetic relaxation
I. Introduction
Magnetic nanoparticles (MNPs) have been widely used in biomedical and bioanalytical applications, for instance, as labels for target analytes in magnetic immunoassays [1]–[3]. Recently, magnetorelaxometry (MRX) based on magnetic relaxation of MNPs was developed as a label detection method [4]–[6]. Compared to some other label detection methods based on detecting a small signal change superposed on a much stronger magnetizing field [7], [8], the MRX technique avoids the high dynamic range requirement. This greatly reduces the needs for bias stability and associated practical challenges, such as calibration and temperature stability.
In MRX measurements, the magnetic dipole moments of the superparamagnetic nanoparticles are first aligned by a pulsed magnetizing field and then the magnetizing field is abruptly switched OFF, leaving only the dipole moments rotating via the Néel relaxation mechanism, with time constant
| (1) |
where τ0 is approximately 10−9 s, T is the temperature, k is the Boltzmann constant, and ΔE is the anisotropy energy barrier which depends on the MNP’s anisotropy constant K and volume V.
Unfortunately, magnetic relaxation time of MNPs is poorly characterized and it cannot be measured with conventional tools such as photon correlation spectroscopy or transmission electron microscopy. In addition, the magnetic relaxation properties of MNPs vary greatly between different manufacturers and even between different batches, so manufacturers and users need a solution for fast, simple, and comprehensive characterization of MNPs.
Previous MRX measurements using superconducting quantum interference devices (SQUID) and fluxgate sensors [9], [10] suffer from a long delay (“dead zone”) of several hundred microseconds between switching off the magnetizing field and detecting the MNP field. This delay is set by the magnets and readout electronics and limits those instruments to the characterization of MNPs with long relaxation times.
In this paper, we report the first CMOS MRX system which integrates miniaturized Hall-effect sensors, electromagnets, and high-speed electronics on a 2.5 mm × 2.5 mm chip that achieves a “dead zone” of less than 100 ns. Characterization data on three commercially available MNP samples are presented.
II. Materials and Methods
A. CMOS Sensor Chip
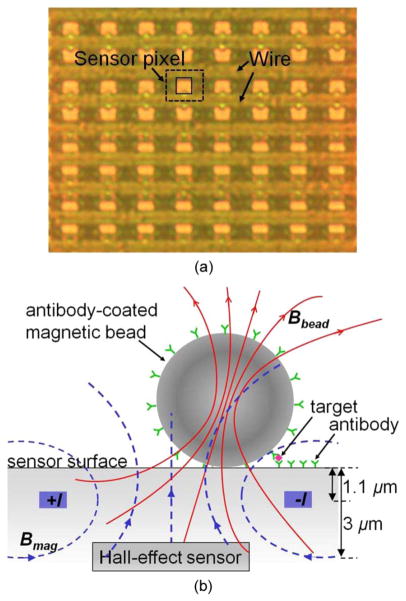
Our Hall-effect sensors are implemented as four 8 × 8 arrays in 0.18 μm CMOS process. Each array occupies a total area of 68 μm × 48 μm [see Fig. 1(a)]. Each pixel consists of a Hall plate and two access transistors, similar to an SRAM cell architecture. The 4 μm × 4 μm voltage-biased Hall plate is realized in a 1 μm thick n-well layer. In magnetic immunoassays, MNPs bound to the target are immobilized on the chip surface and magnetized by a 3 mT B-field (Bmag) generated by on-chip metal wires carrying 32 mA current [see Fig. 1(b)]. The embedded Hall-effect sensor detects the induced field by the MNPs (Bbead). To increase the signal strength, after standard CMOS fabrication steps, the chip is post processed to remove the top interlayer dielectrics so the MNPs are closer to the sensor surface [11]. The dimensions after postprocessing are shown in Fig. 1(b).
Fig. 1.
(a) Top view of an 8 × 8 array of CMOS Hall-effect sensors. Each sensor pixel (dashed line, 8.5 μm × 6 μm) consists of a Hall plate (solid line, 4 μm × 4 μm) and two access transistors. An electromagnet is implemented as a pair of metal wires and shared by the entire row of sensors. (b) Magnetic immunoassays: currents +I and −I generate a B-field Bmag that magnetizes the magnetic bead label, resulting in the much weaker field Bbead. The embedded Hall-effect sensor detects Bbead after Bmag is switched OFF.
B. Magnetizing Field Modulation
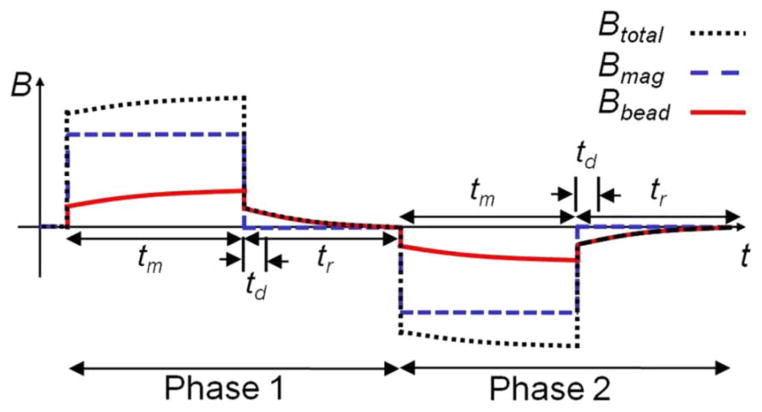
For MRX measurements, Bmag is modulated as shown in Fig. 2. In phase 1, a B-field Bmag of 3 mT is ON for a duration tm and then switched OFF for tr. The B-field induced in the MNP Bbead is measured during relaxation to eliminate the large “baseline” B-field Bmag. The time td denotes the “dead zone” where Bbead cannot be reliably measured due to the limited bandwidth of the electromagnet and the readout electronics. In SQUID or fluxgate MRX systems, this “dead zone” is more than 300 μs, whereas the “dead zone” of our MRX sensor is only 64 ns achieved by the integration of electromagnet and readout channel. As a result, our MRX system can be used for the characterization and detection of a wide selection of MNPs.
Fig. 2.
Timing diagram of the MRX system.
To accurately measure the MNP relaxation signal, the stray magnetic fields from the electronic equipment and Earth, 1/f noise, and sensor offset should be rejected. This is achieved by adding phase 2 in the magnetic modulation where Bmag is changed to the opposite direction, and then taking the difference of phases 1 and 2 (correlated-double-sampling technique or CDS). The thermal noise is suppressed by data averaging.
C. MRX System Setup
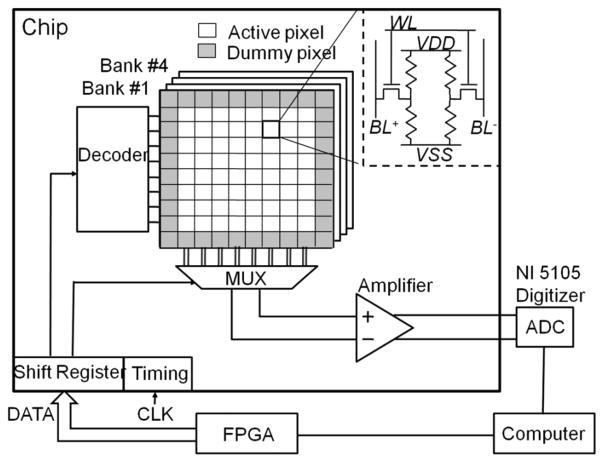
The test setup is shown in Fig. 3. The sensor outputs are multiplexed, amplified on-chip, and then sampled with a National Instrument Data Acquisition device (NI-5105, 14-bit 64MS/s ADC). The data are further processed in MATLAB.
Fig. 3.
Block diagram of test setup.
D. MNP Samples
Three MNP samples were used in the experiment. The first two samples are 20 and 25 nm diameter magnetite nanocrystals with oleic acid coating (catalog number SOR-20-50 and SOR-25-50, Ocean NanoTech, Springdale, AR). The third sample contains 1 μm magnetic beads suspended in double-distilled water at a concentration of 50 mg[solids]/ml with 22.5 mg[Fe]/ml (SiMAG/K-Silanol, Chemicell GmbH, Berlin, Germany). Each bead consists of multiple magnetite nanoparticle cores embedded in a silica matrix.
III. Results and Discussion
Since the total sensor area is only 68 μ m × 48 μ m, samples of submicroliter volume contain enough MNPs to cover the sensor surfaces. In our experiments, a sample of each MNP is diluted and air dried on one sensor chip. The sensor chips are calibrated before the MNPs are immobilized on the sensor surface. To increase the signal-to-noise ratio, each measurement is averaged for 8 s. Data are then averaged over multiple sensors to reduce measurement variation.
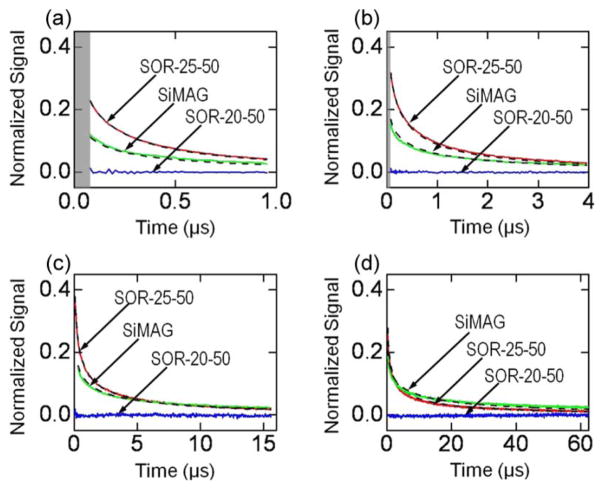
The relaxation curves after CDS are shown in Fig. 4. As can be seen, for tm = tr = 1 μs, there is no visible relaxation from the SOR-20-50 sample whereas for the SOR-25-50 and SiMAG, relaxation is observed and can be clearly distinguished [see Fig. 4(a)]. There are two possible causes that no relaxation is detected on the SOR-20-50 MNPs. First, the MNPs could have fairly large anisotropy energy (ΔE ≫ kT) so there is not enough time to magnetize them during tm; second, the MNPs could have such a small anisotropy energy that they relax very fast and cannot be detected. The first cause is unlikely because no relaxation is observed for the SOR-20-50 MNPs even when the magnetization time is increased to 4, 16, and 64 μs [see Fig. 4(b)–(d)]. This implies that the Néel relaxation time of SOR-20-50 is far less than the 64 ns “dead zone.” It follows from (1) that their anisotropy energy ΔE ≪ 4.2 kT. At room temperature, this corresponds to an anisotropy constant K ≪ 4.1 kJ/m3 less than the values reported by other groups [10], [12]. This difference might be explained by the fact that 1) an MNP’s anisotropy constant is not only dependent on its magneto-crystalline structure but is also affected by other factors such as its shape and surface; 2) the Néel relaxation time constant described in (1) is simplified and only holds for uniaxial symmetry; and 3) interactions between MNPs are not fully ruled out even though the MNPs are coated with an oleic acid layer and diluted.
Fig. 4.
Measured relaxation curves (solid lines) and model (dotted). The “dead zone” is shaded. (a) tm = tr = 1 μs; (b) tm = tr = 4 μs; (c) tm = tr = 16 μs; (d) tm = tr = 64 μs.
Both the SOR-25-50 MNPs and SiMAG beads show relaxation. However, their relaxation curves differ, which indicates that their internal magnetic properties such as anisotropy energy and volume distribution are different. This can be analyzed with the moment superposition model [13], given by
| (2) |
where Ir is the MNP signal during relaxation, I0 is the MNP signal after long magnetization duration, L(y, H) is the Langevin function, y is the reduced volume defined as y = V/Vc, where Vc = kT/K, f(y) is the MNP volume distribution function, and τNH is the relaxation time in a magnetic field H. In our case H ≪ HK so we get τNH ≈ τN. Compared with the original expression in [13], a function g was added to account for the MNP magnetic moment offset at the beginning of the modulation cycle as shown in Fig. 2. It can be derived that in steady state and when tm = tr
| (3) |
We also assume that the MNP volume distribution in each sample follows a log-normal function
| (4) |
where ȳ is the geometric mean of the reduced volume and exp(σ) is the geometric standard variation.
We can investigate the MNPs’ anisotropy energy and volume distribution by “scanning” them with different magnetization duration. By fitting the relaxation curves in Fig. 4 with (2)–(4), we obtain ȳ = 4, σ = 0.45 for SOR-25-50 MNPs and ȳ = 0.16, σ = 1.65, for SiMAG beads, which corresponds to a diameter variation of 15% and 125%, respectively. This shows that the SOR-25-50 MNPs have a bigger portion of MNPs with anisotropy energy larger than 1 kT and narrower distribution of MNP size. The anisotropy constant K can be estimated based on the size of the MNPs. For the 25 nm MNPs (SOR-25-50), we find K = 2 kJ/m3.
IV. Conclusion
We present a CMOS Hall-effect sensor chip developed for the characterization and detection of magnetic labels in biomedical applications based on MRX. Compared to prior instruments exploiting MRX, the proposed solution might have the potential of measuring very fast magnetic relaxation with time constant as small as 64 ns. This could allow a wide selection of magnetic beads or nanoparticles to be used as labels in magnetic immunoassays.
Three commercially available MNP samples were measured with the CMOS Hall-effect MRX system. The samples show different relaxation. This implies that these samples have different intrinsic magnetic properties. The MNPs’ anisotropy energy and volume distribution can be determined by “scanning” them with various magnetization durations.
The chip is easy to integrate with microfluidics and the compact size and low cost give it great potential for lab-on-a-chip and point-of-care applications.
Acknowledgments
The authors would like to thank A. Wang (Ocean NanoTech, LLC) and R. Quaas (Chemicell GmbH) for providing the samples and helpful discussions. Device fabrication was performed at the University of California, Berkeley Microlab facility. This work was supported by the trans-NIH Genes, Environment and Health Initiative, Biological Response Indicators of Environmental Systems Center under Grant U54 ES016115-01.
Footnotes
Color versions of one or more of the figures in this paper are available online at http://ieeexplore.ieee.org.
References
- 1.Baselt DR, Lee GU, Natesan M, Metzger SW, Sheehan PE, Colton RJ. A biosensor based on magnetoresistance technology. Biosens Bioelectron. 1998;13:731–739. doi: 10.1016/s0956-5663(98)00037-2. [DOI] [PubMed] [Google Scholar]
- 2.Li G, Sun S, Wilson RJ, White RL, Pourmand N, Wang SX. Spin valve sensors for ultrasensitive detection of superparamagnetic nanoparticles for biological applications. Sen Actuators A. 2006;126:98–106. doi: 10.1016/j.sna.2005.10.001. [DOI] [PMC free article] [PubMed] [Google Scholar]
- 3.Aytur T, Foley J, Anwar M, Boser B, Harris E, Beatty PR. A novel magnetic bead bioassay platform using a microchip-based sensor for infectious disease diagnosis. J Immunol Methods. 2006;314:21–29. doi: 10.1016/j.jim.2006.05.006. [DOI] [PubMed] [Google Scholar]
- 4.Kötitz R, Weitschies W, Trahms L, Brewer W, Semmler W. Determination of the binding reaction between avidin and biotin by relaxation measurements of magnetic nanoparticles. J Magn Magn Mater. 1999;194:62–68. [Google Scholar]
- 5.Chemla YR, Grossman HL, Poon Y, McDermott R, Stevens R, Alper MD, Clarke J. Ultrasensitive magnetic biosensor for homogeneous immunoassay. Proc Natl Acad Sci. 2000;97:14268–14272. doi: 10.1073/pnas.97.26.14268. [DOI] [PMC free article] [PubMed] [Google Scholar]
- 6.Enpuku K, Inoue K, Soejima K, Yoshinaga K, Kuma H, Hamasaki N. Magnetic immunoassays utilizing magnetic markers and a high-Tc SQUID. IEEE Trans Appl Supercond. 2005 Jun;15(2):660–663. [Google Scholar]
- 7.Besse PA, Boero G, Demierre M, Pott V, Popovic R. Detection of a single magnetic microbead using a miniaturized silicon Hall sensor. Appl Phys Lett. 2002;80:4199–4201. [Google Scholar]
- 8.Florescu O, Mattmann M, Boser B. Fully integrated detection of single magnetic beads in complementary metal-oxide-semiconductor. J Appl Phys. 2008;103:046101. [Google Scholar]
- 9.Eberbeck D, Hartwig S, Steinhoff U, Trahms L. Description of the magnetisation decay in ferrofluids with a narrow particle size. Magnetohydrodynamics. 2003;39:77–83. [Google Scholar]
- 10.Ludwig F, Heim E, Schilling M. Characterization of superparamagnetic nanoparticles by analyzing the magnetization and relaxation dynamics using fluxgate magnetometers. J Appl Phys. 2007;101:113909. [Google Scholar]
- 11.Skucha K, Liu M, Megens P, Kim J, Boser B. A compact Hall-effect sensor array for the detection and imaging of single magnetic beads in biomedical assays,” in. Dig. 16th Int. Conf. Solid-State Sens. Actuators; 2011; pp. 1833–1836. [Google Scholar]
- 12.Eberbeck D, Wiekhorst F, Steinhoff U, Trahms L. Aggregation behaviour of magnetic nanoparticle suspensions investigated by magnetorelaxometry. J Phys: Condens Matter. 2006;18:2829–2846. [Google Scholar]
- 13.Chantrell R, Hoon SR, Tanner BK. Time-dependent magnetization in fine-particle ferromagnetic systems. J Magn Magn Mater. 1983;38:133–141. [Google Scholar]


