Abstract
In this study, we selected adult normal pituitary gland tissues from six patients during operations for pituitary microadenomas via the transsphenoidal approach for extended normal pituitary tissue resection around the tumor, and analyzed the protein expression of human normal pituitary using two-dimensional high-performance liquid chromatography combined with LTQ-Orbitrap mass spectrometry proteomics technology. The ten most highly expressed proteins in normal human pituitary were: alpha 3 type VI collagen isoform 5 precursor (abundance among tall pituitary proteins, 1.30%), fibrinogen beta chain preproprotein (0.99%), vimentin (0.73%), prolactin (0.69%), ATP synthase, H+ transporting and mitochondrial F1 complex beta subunit precursor (0.52%), keratin I (0.49%), growth hormone (0.45%), carbonic anhydrase I (0.40%), heat shock protein 90 kDa I (0.31%), and annexin V (0.30%). Based on the biological function classifications of these proteins, the top three categories by content were neuroendocrine proteins (abundance among all pituitary proteins, 40.1%), catalytic and metabolic proteins (28.3%), and cell signal transduction proteins (9.8%). Based on cell positioning classification, the top three categories were cell organelle (24.5%), membrane (20.8%), and cytoplasm (13.0%). Based on biological process classification, the top three categories of proteins are involved in physiological processes (42.9%), cellular processes (40.4%), and regulation of biological processes (9.1%). Our experimental findings indicate that a protein expression profile database of normal human pituitary can be precisely and efficiently established by proteomics technology.
Keywords: two-dimensional high-performance liquid chromatography, mass spectrum, pituitary gland, proteins, proteomics, hypophyseal tumor, physiological function, pathological mechanism
Research Highlights
-
(1)
Studies to date have focused on gene expression profiles of pituitary gland tissue, but there is little evidence regarding the levels of normal pituitary gland proteins.
-
(2)
We aimed to analyze the protein expression profile in normal adult pituitary gland tissues using two-dimensional high performance liquid chromatography combined with LTQ-Orbitrap mass spectrometry proteomics technology.
-
(3)
We describe the 10 most highly expressed proteins, providing evidence for the physiological functions and pathological mechanisms in the pituitary gland.
Abbreviations 2D-HPLC, two-dimensional high-performance liquid chromatography; MS, mass spectrum
INTRODUCTION
The normal human pituitary, as the central regulatory gland, is one of the most important endocrine organs in the human body[1]. The anterior and posterior lobes of the pituitary comprised several different cell types, which are responsible for the synthesis and secretion of a number of hormones such as growth hormone, prolactin and adrenocorticotropic hormone. The most common pathology is the formation of pituitary adenomas that arise from cells of the anterior lobe. Details of the formation and proliferation of pituitary tumors are not fully understood. The current model of pituitary tumorigenesis considers a multifactorial biological process that involves intrinsic defects within the gland as well as dysregulation of hypothalamic stimuli[2,3].
According to the central dogma of biology, protein is the main mediator of biological functions. Thus, to gain more insight into the role of pituitary tumorigenesis, it is necessary to investigate overall protein expression in the normal human pituitary, which also could provide evidence for progressive research on human pituitary diseases.
Proteomics offers an effective means for the comprehensive examination of normal human pituitary proteins. The present study aimed to achieve a systematic analysis of overall protein expression. Therefore, in this study, two-dimensional high-performance liquid chromatography (2D-HPLC) combined with LTQ-Orbitrap mass spectrometry (MS) was used to establish a quantitative total protein reference database for the normal human pituitary, which provides a substantial foundation for future research.
RESULTS
Protein categories in normal pituitary tissues
Using 2D-HPLC combined with LTQ-Orbitrap MS technology, we first established a quantitative total protein reference database for the normal human pituitary, containing 406 proteins in specimens from six patients obtained during operations for pituitary microadenomas via the transsphenoidal approach for extended normal pituitary tissue resection around the tumor (Figure 1).
Figure 1.
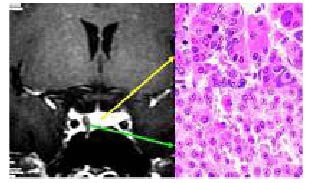
Morphology of human normal pituitary tissue from a female 36-year-old patient.
Coronal enhanced MRI shows that the tumors were low-signal, and biased towards one side. The surrounding enhanced normal pituitary tissues were displayed clearly.
The green arrow (downward) shows the pituitary adenoma and the yellow arrow (upward) shows the normal pituitary tissue confirmed by postoperative pathology.
Figure 2 shows the process of 2D-HPLC combined with LTQ-Orbitrap MS using collagen (Figures 2C–E), one of the proteins identified in this study, as an example.
Figure 2.
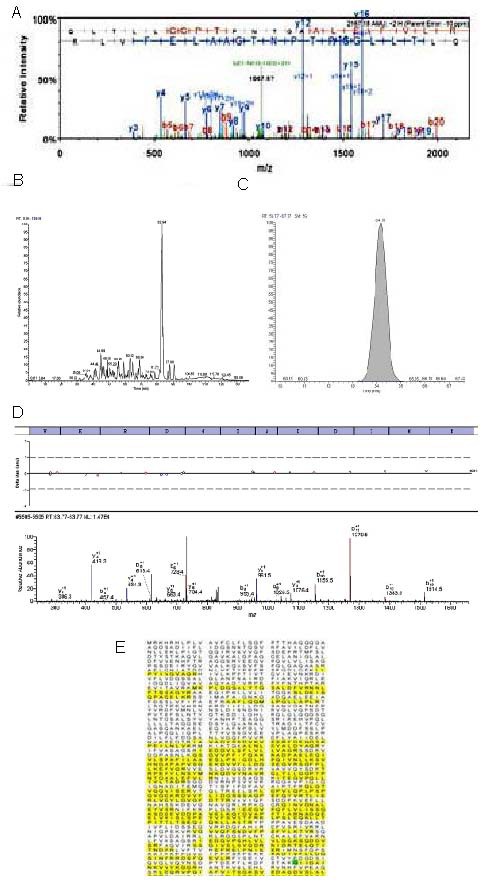
Block diagram of protein separation and identification using two-dimensional high-performance liquid chromatography combined with LTQ-Orbitrap (collagen as an example).
(A) Total ion-current in chromatography with 100 mM ammonium acetate solution. The horizontal axis represents wash speed and the vertical axis represents relative intensity.
(B) The spectrum signal for the collagen protein changed with time. (C) The chromatographic peak of one peptide of the collagen protein. (B, C) The horizontal axis represents time and the vertical axis represents the relative abundance of the protein.
(D) Process of protein identification using software. The top line of letters represents the identified amino acid. Below, at t = 64.15 minutes, is the mass chromatogram for the collagen peptides.
(E) The composition of the amino acids of the collagen protein. The yellow area represents the functional domain of the protein.
After the amino acid compositions of all proteins had been confirmed, a protein database was downloaded from the European Bioinformatics Institute website (ftp://ftp.ebi.ac.uk/goa) to compare with the results obtained in this study. Biological function, cell positioning and the biological processes of the identified proteins were used to classify the identified proteins (Figure 3). Based on biological functional classification of the proteins, the top three categories by content were binding proteins (neuroendocrine proteins, including all kinds of hormones and their receptors, 40.1%), catalytic and metabolic proteins (including enzymes, 28.3%), and cell signaling and signal transduction proteins (9.8%). Based on the cell positioning classification, the top three categories were cell organelle (24.5%), membrane (20.8%), and cytoplasm (13.0%). Based on biological process classification, the top three categories of proteins are involved in physiological processes (42.9%), cellular process (40.4%), and regulation of biological process (9.1%).
Figure 3.
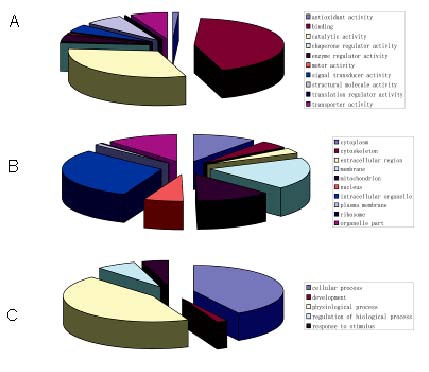
Protein classification of human normal pituitary tissues.
(A) Biological functional classification. (B) Cell positioning classification. (C) Biological process classification.
Highly expressed proteins in normal pituitary tissues
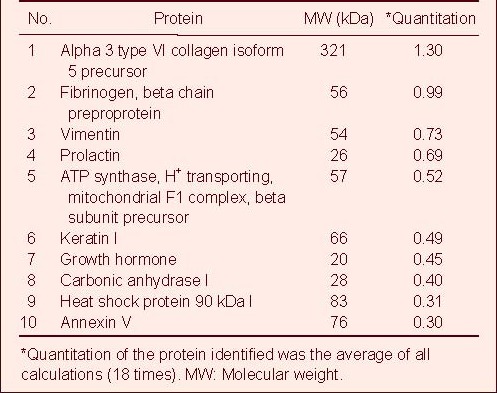
The 10 most highly expressed proteins were: alpha 3 type VI collagen isoform 5 precursor (1.30%), fibrinogen beta chain preproprotein (0.99%), vimentin (0.73%), prolactin (0.69%), ATP synthase, H+ transporting and mitochondrial F1 complex beta subunit precursor (0.52%), keratin I (0.49%), growth hormone (0.45%), carbonic anhydrase I (0.40%), heat shock protein 90 kDa I (0.31%), and annexin V (0.30%). These data are shown in Table 1.
Table 1.
Quantitative total protein reference database for human normal pituitary (10 most highly expressed proteins)
Western blot assay
The results of western blot assays showed the high expression of vimentin and carbonic anhydrase I in two normal pituitary samples, and low expression in normal brain tissue (Figure 4), consistent with the results of 2D-HPLC combined with LTQ-Orbitrap MS.
Figure 4.
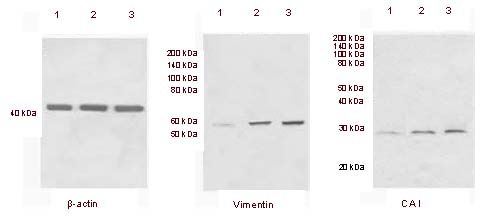
Expression of vimentin and carbonic anhydrase I in normal pituitary tissue.
Western blot assay results showing high expression of vimentin and carbonic anhydrase I (CAI) in two normal pituitary samples (lanes 2 and 3) and low expression in normal brain tissue (lane 1). Beta-actin was used as an internal standard.
Our findings were consistent with those from two-dimensional high-performance liquid chromatography combined with LTQ-Orbitrap mass spectrometry.
Molecular weights are shown at the left.
DISCUSSION
Methodology
In 2002, Song et al [4] took the lead in the application of expressed sequence tags to construct a normal pituitary gene expression profile database for an in-depth understanding of the function of the pituitary and neuroendocrine system.
However, in humans, the abundances of mRNAs and protein are not closely related, and this is especially true for low-abundance proteins. The results of this study are consistent with the known gene expression profiles for human normal pituitary in terms of approximate composition (including neuroendocrine proteins, hormones and their receptors, enzymes and signal transduction proteins); however, the relative proportions of these contents differ considerably between the present study based on protein levels and previous studies on gene expression. In previous studies, pituitary autopsy specimens were always used. However, due to a variety of factors such as the time in vitro and the degree of freshness, the value of these specimens is limited. In this study, we obtained samples confirmed by postoperative pathology during operations for pituitary microadenomas using the transsphenoidal approach for extended normal pituitary tissue resection around the tumor, which is supported by a series of studies and is in accordance with Medical Ethics norms[5,6].
Proteomics technology provides an ideal technology platform. Compared with previously commonly used classic proteomics technology, such as two-dimensional gel electrophoresis combined with matrix-assisted laser desorption/ionization time of flight mass spectrometry (MALDI-TOF-MS), 2D-HPLC combined with LTQ-Orbitrap offers a number of advantages. (1) It is a peptide-based experimental method, as compared with a protein-based method, and the number of peptides can greatly increase the amount of information provided. (2) On the basis of previous research[7,8], we used the chromatographic peak area as a quantitative measure for proteins, which is called the “non-marking quantitative (label-free) method”, as opposed to other quantitative methods such as isotope labeling; this approach is a “non-invasive” quantitative measure. (3) Liquid chromatography is suitable for separation of proteins of < 1 × 10³ Da in size, insoluble membrane proteins, and low abundance proteins[9], and the proteins can be directly separated from samples, which can make up for the defects of protein separation by two-dimensional gel electrophoresis[10,11,12]. (4) The process of separation is accurate, efficient and automatic. Each sample was analyzed three times, which increase the reliability and repeatability of the results. There are very few such studies described in the literature[13]. For example, Sarka in 2002 analyzed the total proteins from normal pituitary tissue from one individual sample using two-dimensional gel electrophoresis combined with MALDI-TOF-MS technology, and identified 38 reliable protein spots[14]. Our study identified not only the same 38 proteins identified by Sarka, but also 406 others.
Components of the proteins expressed in normal pituitary
Human pituitary is an important hormone-releasing organ; it is also regulated by a variety of hormones secreted by the hypothalamus. In this study, prolactin and growth hormone were found to be among the top 10 proteins expressed; we also identified the POMC (adrenocorticotropic hormone precursor), thyroid stimulating hormone, follicle-stimulating hormone, and insulin-like growth factor. As a classic endocrine organ, the pituitary receives and sends out information; thus, the signal transduction system and related enzymes show high expression of some proteins in particular, such as ATP synthase and H+ transporting mitochondrial F1 complex, annexin V (after activation by calcium, this protein can combine with cell membrane phospholipids and become involved in membrane transport and other proceedings depending on a host of CaMs), the levels of which placed them both among the top 10 proteins expressed in the pituitary.
Proteins related to normal physiological and pathological processes in the human pituitary
In this study, the three most highly expressed proteins were type VI collagen, fibrinogen beta chain preproprotein and vimentin, which are all cytoskeletal proteins important for the integrity and stability maintenance of the extracellular matrix and basal membrane of the human pituitary. A variety of pathogenic factors such as matrix metalloproteinases can lead to the degradation of the extracellular matrix and damage the basal membrane, thereby promoting tumor angiogenesis, invasion and metastasis[15,16]. The results of this study fully show the importance of cytoskeletal proteins in human normal pituitary tissue.
Our study also identified a number of proteins closely related to the function of human pituitary, such as proteins involved in hormone secretion and regulation, as well as metabolic proteins, which explain how the human normal pituitary performs a wide range of functions, not only endocrine functions, but also a variety of physiological functions of the body. Among the top ten proteins found in this study, the carbonic anhydrase I and heat shock protein 90 kDa deserve more attention. The gene for carbonic anhydrase I is located on chromosome 8 and is expressed nearly in all tissues or organs to regulate the acid-base balance[17]. It is closely related to tumor invasion, metastasis and biological behavior such as CO2 retention, decreasing pH, and water and electrolyte disorders[18,19]. Therefore, we suppose that the same mechanism may be associated with the occurrence of pituitary tumors. The relationship between heat shock protein 90 kDa and pituitary adenoma was confirmed in a previous study[20]. Recently, a mitogen-activated protein kinase-signaling abnormality was reported to be significantly associated with pituitary adenoma based on a proteomics technique, which was totally different from our results[21].
A quantitative total protein database of the normal human pituitary, which will enhance the depth of understanding of its physiological functions and the associated pathological process of great significance, was precisely and efficiently established using proteomics technology. The identified proteins, such as cytoskeletal proteins, carbonic anhydrase I and heat shock protein 90 kDa, may provide suitable targets for progressive research.
SUBJECTS AND METHODS
Design
A proteomic study.
Time and setting
From January 2008 to September 2008, this experiment was performed in the Department of Neurosurgery, Huashan Hospital and the Institution of Biological Medicine, Fudan University, Shanghai, China.
Subjects
The specimens were obtained from six patients, two men and four women, aged 30–36 years, during operations for pituitary microadenomas using the transsphenoidal approach for extended normal pituitary tissue resection around the tumor in the Department of Neurosurgery, Huashan Hospital, Fudan University, Shanghai, China.
Inclusion criteria: All samples were confirmed as normal pituitary tissues by postoperative pathology. Coronal enhanced MRI showed that the tumors were low-signal, limited or biased towards one side. The surrounding normal pituitary tissues enhanced were displayed clearly (Figure 1). The method of extended resection of normal pituitary tissues is based on the theory proposed by Hardy and Ren that the subtotal resection of normal pituitary tissues around pituitary adenomas can significantly strengthen the effectiveness of surgical treatment[4,5].
Exclusion criteria: Other types of pituitary adenomas and individuals with other pituitary diseases were excluded. In accordance with the Administrative Regulations on Medical Institution, announced by the State Council of China[22], all patients were told the experimental program and relevant risks before the study. The program was approved by the local Ethics Committee and informed consents were obtained.
Methods
Extraction of overall pituitary proteins
Specimens (0.1 g) were frozen immediately in liquid nitrogen, and ground to powder. Then, the powder was suspended in 0.5 mL of sample buffer containing urea (8 M), 3-[(3-cholamidopropyl) dimethylammonio]-1-propanesulfonate (4%), phenylmethylsulfonyl fluoride (1 mM), leupeptin and pepstatin A (1 μL/mL; Sigma, St Louis, MO, USA). The mixture was homogenized for 30 seconds, twice, and centrifuged at 5 000 r/min for 15 minutes at 4°C to obtain the supernatant. Then, the supernatant was fully suspended and centrifuged at 28 000 r/min for 60 minutes at 4°C to obtain the total-extracted proteins. The protein concentration in the supernatant was calculated based on Bradford assay (Bio-Rad, Hercules, CA, USA). Extracted protein samples were stored at −80°C until analysis.
Sample digestion with enzyme
Samples containing 90 μg of protein were reduced in 10 mM dithiothreitol/25 mM ammonium bicarbonate (Merck, Darmstadt, Germany) at 56°C for 1 hour and alkylated in iodoacetamide (55 mM; Amresco, Solon, OH, USA) for 45 minutes in the dark at room temperature. Then, 2 μL of trypsin (1 μg/μL, trypsin:protein = 1:50; Sigma) was added into the samples, which were incubated for 18 hours at 34°C. Finally 3 μL of formic acid was added to stop the enzymolysis reaction.
2D-HPLC combined with LTQ-Orbitrap MS analysis
The 2D-HPLC MS experiments were carried on using an LC-Packing system containing one FAMOS micro-autosampler, one SWITCHOS micro-flow LC pump equipped with two ten-port switching valves and one ULTIMATE nano-flow LC pump (Nano LC-Packing System, Amsterdam, The Netherlands). Protein samples (90 μg) were loaded and bound onto a BioX-SCX strong cation exchange column (1.0 mm × 150 mm, LC-Packing). A series of ammonium acetate solutions (at concentrations of 0, 50, 100, 200, 400, 800, 1 000 and 2 000 mM) were applied to the column to replace a portion of the samples. The eluted portion was desalted online using a CAPTRAP column (0.5 mm × 2 mm; MICHROM Bioresources, Auburn, CA, USA), and then was analyzed using a PICOFRIT C18 reverse-phase column (0.075 mm × 100 mm; New Objective, Woburn, MA, USA) at a flow rate of 300 nL/min (Figure 5). The mobile phases consisted of acetonitrile (5%) containing formic acid (0.1%; phase A and the loading phase; Amresco, Solon, OH, USA) and acetonitrile (95%) containing formic acid (0.1%; phase B). To achieve proper separation, a 60-minute linear gradient from 5% to 45% phase B was employed. The 2D-HPLC system was connected to an LTQ-Orbitrap mass spectrometer through a dynamic electrospray ion source (both from Thermo Fisher Corporation, San Jose, CA, USA) via a 15-μm silica tip (New Objective). The spray voltage was set at 2.0 kV and the heated capillary at 210°C. The mass spectrometer was operated in data-dependent mode and each cycle of duty contained one full-MS survey scan in the mass range 400–2 000 Da with a resolution power of 100 000 using the Orbitrap section, followed by the MS2 experiment for the eight most intense ions (Figures 2A, B). Peptides were fragmented in the LTQ section using collision-induced dissociation with helium and the normalized collision energy value was set at 35%. Previously fragmented peptides were excluded for 60 seconds. The 2D-HPLC combined with LTQ-Orbitrap MS (Thermo Fisher Corporation) was repeated three times for every sample. The detailed characteristics of the peptide fragments from every protein were identified and shown as chromatographic peaks (Figure 2C); then, the constitution of the amino acids for every protein were confirmed in database searches (Figures 2D, E).
Bioinformatics and proteins database search
After LTQ-Orbitrap MS, the sequences of the amino acids from peptides fragments were used to identify the parent protein by searching NCBI databases for human (RefSEQ version, Dec 2006, downloaded from ftp://ftp.ncbi.nih.gov/refseq/release/) using BioWorks 3.2 software (Thermo Fisher Corporation) and the TurboSequest search engine v2.7 with the following criteria: two possible missed cleavage sites, peptide mass tolerance of 10 ppm, fragment mass tolerance of 1 Da shift, +57 Da shift for carboxyamidomethylated cysteine considered as a fixed modification and +16 Da shift for oxidized methione as variable modifications. The acceptance criteria for peptide identifications were determined (using the same filtration criteria) by searching the files against a reversed RefSEQ databases for human. Using these stringent filtration criteria, the rate of false discovery identification was less than 1%, thus increasing the confidence in the identified proteins. Then, the matched protein in databases of National Center for Biotechnology Information was considered the target protein identified.
Protein quantification
Peak areas of all identified proteins were calculated using the integrated PepQuan Area/Height Calculation function. The algorithm works by reading the MH+ value from the .dta file and calculating the precursor mass from this value. A reconstructed ion chromatogram was generated using the precursor mass, smoothed, and the integrated height of the peaks was calculated. BioWorks then displayed the percent areas of the proteins in the last column of the result table. The intensity threshold was set to 5e5, the mass tolerance was 0.02 Da and the time window was ± 2 minutes. The final abundance of each protein was the protein's area percentage divided by the area percentage for beta-actin (Gene Symbol = ACTB, GI 4501885). The calculation was repeated three times and generated three sets of data for one sample. Because the study included six samples, 18 sets of data were generated for one protein quantification. Then, the protein identified and its relative abundance among all proteins were used for the establishment of the total protein reference database for human normal pituitary, and the quantification of proteins was the average of all calculations (18 sets of data). Microsoft EXCEL 2003 was used to build the reference database. The results in the database were presented as the name and the average percentage abundance among all proteins.
Western blot verification of vimentin and carbonic anhydrase I
We selected vimentin and carbonic anhydrase I to perform western blot assays and confirm the proteins identified by 2D-HPLC combined with LTQ-Orbitrap. Protein (50 mg) from two normal pituitary samples and one normal brain tissue sample as a control, provided by Department of Neurosurgery, Huashan Hospital, Fudan University, was loaded and separated on a 12.5% gel, and then transferred to a polyvinylidene fluoride membrane. The polyvinylidene fluoride membrane was incubated in PBS-T/5% bovine serum albumin (PBS containing 0.1% Tween-20 and 5% bovine serum albumin) for 1 hour at room temperature and then in mouse anti-human monoclonal antibodies for vimentin and carbonic anhydrase I (both 1:3 000; Genetech, San Jose, CA, USA) overnight at 4°C. Then, the polyvinylidene fluoride membrane was incubated with FITC-labeled rabbit anti-mouse IgG (1:5 000; Genetech) for 1 hour and the bands were visualized with KC™ chemiluminescence detection. Beta-actin (1:10 000; Genetech) was used as an internal standard to quantitatively normalize the signals.
Acknowledgments
We would like to thank the staff of the Department of Neurosurgery, Huashan Hospital, Fudan University and the Institution of Biological Medicine, Fudan University, Shanghai, China, for their support and encouragement.
Footnotes
Funding: This study was supported by the National Natural Science Foundation of China, No. 81200890.
Conflicts of interest: None declared.
Ethical approval: The study was approved by the Institutional Review Board of Huashan Hospital, Fudan University, China.
(Edited by Luo QY, Liu HS/Yang Y/Song LP)
REFERENCES
- [1].Horvath E, Kovacs K. New York: Raven Press, USA; 1994. The Pituitary Gland. [Google Scholar]
- [2].Asa SL, Ezzat S. The cytogenesis and pathogenesis of pituitary adenomas. Endocrine Rev. 1998;19(6):798–827. doi: 10.1210/edrv.19.6.0350. [DOI] [PubMed] [Google Scholar]
- [3].Melmed S. Pathogenesis of pituitary tumors. Metab Clin North Am. 1999;28(1):1–12. doi: 10.1016/s0889-8529(05)70055-4. [DOI] [PubMed] [Google Scholar]
- [4].Song HD, Hu RM. Study on the gene expression profiling in the normal human pituitary. Zhonghua Neifenmi Daixie Zazhi. 2000;16(5):292–296. [Google Scholar]
- [5].Hardy J. Transphenoidal microsurgery of the normal and pathological pituitary. Clin Neurosurg. 1969;16:185–217. doi: 10.1093/neurosurgery/16.cn_suppl_1.185. [DOI] [PubMed] [Google Scholar]
- [6].Ren ZY, Wang ZC. Beijing: People's Health Publishing House; 1999. Neurosurgery. [Google Scholar]
- [7].Chelius D, Zhang T, Wang G, et al. Global protein identification and qualification technology using two-dimensional liquid chromatography nanospray mass spectrometry. Anal Chem. 2003;75(23):6658–6665. doi: 10.1021/ac034607k. [DOI] [PubMed] [Google Scholar]
- [8].Old W, Meyer-Arend K, Aveline-Wol L, et al. Comparison of label-free methods gor quantifying human proteins by shotgun proteomics. Mol Cell Proteomics. 2005;4(10):1487–1502. doi: 10.1074/mcp.M500084-MCP200. [DOI] [PubMed] [Google Scholar]
- [9].Romijn EP, Krijgsveld J, Heck AJ. Recent liquid chromatographic-(tandem) mass spectrometric applications in proteomics. J Chromatogr A. 2003;1000(1-2):589–608. doi: 10.1016/s0021-9673(03)00178-x. [DOI] [PubMed] [Google Scholar]
- [10].Gharahdaghi F, Weinberg CR, Meagher DA, et al. Mass spectrometric identification of proteins from silver-stained polyacrylamide gel: a method for the removal of silver ions to enhance sensitivity. Electrophoresis. 1999;20(3):601–605. doi: 10.1002/(SICI)1522-2683(19990301)20:3<601::AID-ELPS601>3.0.CO;2-6. [DOI] [PubMed] [Google Scholar]
- [11].Giorgianni F, Desiderio DM, Beranova-Giorgianni S. Proteome analysis using isoelectric focusing in immobilized pH gradient gels followed by mass spectrometry. Electrophoresis. 2003;24(1-2):253–259. doi: 10.1002/elps.200390021. [DOI] [PubMed] [Google Scholar]
- [12].Li C, Zhan XQ, Li MY, et al. Proteomic comparison of two- dimensional gel electrophoresis profiles from human lung squamous carcinoma and normal bronchial epithelial tissues. Genomics Proteomics Bioinfomatics. 2003;1(1):58–67. doi: 10.1016/S1672-0229(03)01008-8. [DOI] [PMC free article] [PubMed] [Google Scholar]
- [13].Zhang X, Desiderio DM. A reference map of a human pituitary adenoma proteome. Proteomics. 2003;3(5):699–713. doi: 10.1002/pmic.200300408. [DOI] [PubMed] [Google Scholar]
- [14].Beranova-Giorgianni S, Giorgianni F, et al. Analysis of the proteome in the human pituitary. Proteomics. 2002;2(5):534–542. doi: 10.1002/1615-9861(200205)2:5<534::AID-PROT534>3.0.CO;2-K. [DOI] [PubMed] [Google Scholar]
- [15].Asa SL, Ezzat S. The cytogenesis and pathogenesis of pituitary adenomas. Endocr Rev. 1998;19(6):798–827. doi: 10.1210/edrv.19.6.0350. [DOI] [PubMed] [Google Scholar]
- [16].Liu W, Matsumoto Y, Okada M, et al. Matrix metalloproteinase 2 and 9 expression correlated with cavernous sinus invasion of pituitary adenomas. J Med Invest. 2005;52(3-4):151–158. doi: 10.2152/jmi.52.151. [DOI] [PubMed] [Google Scholar]
- [17].Davis MB, West LF, Butterworth P, et al. Int. Cong. Hum. Genet. Berlin: 1986. The assignment of human carbonic anhydrases CA1 and CA3 to chromosome 8q13-22 (Abstract) 7th. [Google Scholar]
- [18].Tripp BC, Smith K, Ferry JG. Carbonic anhydrase: new insights for an ancient enzyme. J Biol Chem. 2001;276(52):48615–48616. doi: 10.1074/jbc.R100045200. [DOI] [PubMed] [Google Scholar]
- [19].Tripp BC, Bell CB, Cruz F, et al. A role for iron in an ancient carbonic anhydrase. J Biol Chem. 2004;279(8):6683–6687. doi: 10.1074/jbc.M311648200. [DOI] [PubMed] [Google Scholar]
- [20].David RB, Alan P. Binding of Aryl hydrocarbon receptor (AhR) to AhR-interacting protein. The role of hsp90. J Biol Chem. 2000;275(46):36407–36414. doi: 10.1074/jbc.M004236200. [DOI] [PubMed] [Google Scholar]
- [21].Zhan X, Desiderio DM. Signaling pathway networks mined from human pituitary adenoma proteomics data. BMC Med Genomics. 2010;3:13. doi: 10.1186/1755-8794-3-13. [DOI] [PMC free article] [PubMed] [Google Scholar]
- [22].State Council of the People's Republic of China. Administrative Regulations on Medical Institution. 1994 Sep 01; [Google Scholar]


