

Abstract
To assess a species' vulnerability to climate change, we commonly use mapped environmental data that are coarsely resolved in time and space. Coarsely resolved temperature data are typically inaccurate at predicting temperatures in microhabitats used by an organism and may also exhibit spatial bias in topographically complex areas. One consequence of these inaccuracies is that coarsely resolved layers may predict thermal regimes at a site that exceed species' known thermal limits. In this study, we use statistical downscaling to account for environmental factors and develop high-resolution estimates of daily maximum temperatures for a 36 000 km2 study area over a 38-year period. We then demonstrate that this statistical downscaling provides temperature estimates that consistently place focal species within their fundamental thermal niche, whereas coarsely resolved layers do not. Our results highlight the need for incorporation of fine-scale weather data into species' vulnerability analyses and demonstrate that a statistical downscaling approach can yield biologically relevant estimates of thermal regimes.
Keywords: vulnerability, exposure, spatial weather layers, climate change, sensitivity
1. Introduction
Global climate change represents a threat to biodiversity across multiple biomes and organizational scales [1]. In the face of this threat, robust estimation of species' vulnerability to climate change is necessary [2]. Species' vulnerability can be seen as a function of the environmental regimes which a species experiences in situ (its ‘exposure’) and its physiological and adaptive responses to this environment (its ‘sensitivity’) [2]. The use of inaccurate measures of exposure or sensitivity for creating vulnerability analyses can potentially lead to false inference and wasted conservation resources. Hence, we need to examine closely the analytical procedures used to derive estimates of exposure and sensitivity for species.
Coarse-scale weather surfaces will likely make a poor surrogate for the microclimate experienced by an organism. Coarse-scale weather surfaces are typically created from empirical point climate data (daily temperature maxima or minima, Tmax or Tmin), which are then splined through unsampled geographic space according to elevation, latitude and longitude (e.g. [3]). Splining approaches do not take into account factors known to decouple local and regional thermal regimes and as a result are often inaccurate at the microclimate scale [4–6]. As well as this, coarse-scale weather takes no account of the species' behaviour: nocturnal and diurnal species, for example, may have very different exposures.
We can move from coarse weather layers to fine-scale layers, and ultimately species' exposure, using either a correlative (statistical [6]) or a mechanistic (mass/energy balance [7]) downscaling approach. Mechanistic methods use complex energy balance equations which incorporate spatially mapped variables such as surface albedo, relative humidity, incoming solar radiation and wind speed (as well as conductivity and emission constants) to generate estimates of microclimate [7]. While very flexible, particularly for predicting microclimates into the future, mechanistic approaches require a large number of parameters to be estimated. Alternatively, a correlative approach may lend itself well to producing spatial estimates of microclimate under current conditions [6]. Such an approach does not explicitly incorporate mechanism, but draws statistical associations between empirical microclimate observations and spatial layers of environmental factors [6]. Unlike the mechanistic approach, the correlative approach does not require a large number of parameters to be specified a priori, and it makes use of large datasets on microclimate that already exist [6].
Microclimate estimates will need to meet three criteria to be relevant to the species in question and therefore suitable for constructing vulnerability analyses. First, factors that decouple regional and local microclimates will need to be explicitly incorporated. Second, microclimate estimates need to be temporally resolved enough to quantify the effect of short-term weather events on the focal species [8,9]. Finally, microclimate estimates will need to be consistent with what we know of the current distribution and physiological constraints of the species in question. Meeting these criteria should produce estimates of microclimate which are biologically sensible and useful for vulnerability assessment.
Here, we assess the correlative approach to downscaling weather data against our three criteria. We compare three datasets that represent iteratively more complex statistical downscaling. The first dataset (‘AWAP’) is of coarsely resolved (5 km grid) data on daily Tmax and Tmin [3]. The second dataset (‘DS1’) is a previously described statistical downscale (to 250 m resolution) of the first dataset that incorporates factors that decouple regional and local climates [6]. We compare these two datasets against the known critical thermal maxima (CTmax, a hard physiological limit on individual survival [10]) of seven species of endemic frog (family: Microhylidae) in Australia's Wet Tropics (AWT) and find them wanting. Both indicate thermal regimes that routinely exceed the focal species' CTmax, yielding an impossible situation in which focal species thrive outside their fundamental thermal niche. We proceed to further statistically downscale DS1 using an independent dataset of microhabitat temperature records from the focal species' preferred diurnal shelter (underneath fallen logs in rainforest). The resultant dataset (‘DS2’) accurately predicts observed temperatures and, importantly, projects temperature regimes compatible with the thermal niche of all the focal species. Indeed, our downscaled weather data place the focal species firmly within their fundamental thermal niche, suggesting that our results are now at a sufficient spatio-temporal scale as to be biologically valid and useful for constructing vulnerability analyses.
2. Material and methods
We used the AWT as a case-study region to demonstrate the problems inherent with using broad-scale weather layers to construct microclimates. To this end, we use a biological criterion to assess the accuracy of microclimate surfaces: their ability to accurately portray a species' fundamental thermal niche. For the latter, we ask a simple question: do thermal regimes predicted by weather surfaces at known species occurrence points conform to known CTmax of the species?
Comparisons are drawn between three representations of thermal regimes with increasing spatial resolution and complexity of statistical downscaling. The AWAP surfaces represent the daily open-air Tmax at approximately 1.5 m above the ground at 5 km daily resolution [3]. The DS1 weather surfaces representing daily Tmax and Tmin are downscaled to 250 m resolution from the AWAP layers, according to key environmental factors [6]. Lastly, we use the DS1 weather layers [6] in conjunction with a paired empirical dataset of air and microhabitat (underneath fallen logs) temperature records. A linear model is employed to generate a relationship between daily air temperatures and microclimate Tmax. Spatially mapped air temperature values from DS1 are then substituted into the model to form a region-wide spatial prediction of the daily thermal regime underneath a fallen rainforest log (DS2 layers). For further details of the linear downscaling model, see the electronic supplementary material, appendix S1.
We determined CTmax for seven species of rainforest-restricted, terrestrially developing microhylid frog: Cophixalus aenigma, C. bombiens, C. exiguus, C. hosmeri, C. infacetus, C. mcdonaldi and C. neglectus. The focal species are known to be nocturnally active and shelter underneath fallen logs during daylight hours [11] (C. Storlie 2013, personal observation). Adult male frogs were identified by call and tested within 24 h using a dynamic methodology [12] to determine CTmax. For further details on the determination of the focal species' CTmax see the electronic supplementary material, appendix S2.
Location data for species occurrences were derived from Williams et al. [11] and supplemented with recent records vetted for positional and observer accuracy. These occurrences were then overlaid on the weather surfaces in a GIS environment using the SDMTools package 1.13 [13] in the R statistical software package v. 2.15.1 [14] to extract absolute Tmax for all occurrence points of focal species. Thirty-eight years of absolute Tmax at known occurrence points were then standardized against each species' thermal limits by subtracting individual species' CTmax from all records. We used kernel density estimation to represent the distribution of temperatures for all focal species. Density distributions were calculated across the entire range of predicted standardized temperatures and the total probability density falling above each species' CTmax was calculated (i.e. the density above zero after standardization). These values represent the proportion of time (given the data) that CTmax is exceeded across the set of species occurrence locations for each species and are reported in table 1.
Table 1.
CTmax values and standard deviations (in °C) for all focal species, the number of occurrence records, and the proportion of time that mean CTmax is exceeded if we treat each of our datasets as truth.
| species | CTmax | s.d. of CTmax | N (CTmax) | N (occurrence records) | AWAP prop. above CTmax | DS1 prop. above CTmax | DS2 prop. above CTmax |
|---|---|---|---|---|---|---|---|
| C. aenigma | 28.09 | 2.31 | 3 | 148 | 0.9595 | 0.2316 | 0.0002 |
| C. bombiens | 32.36 | 3.16 | 10 | 58 | 0.9990 | 0.1692 | <0.0001 |
| C. exiguus | 35.93 | 1.00 | 6 | 8 | 0.9874 | <0.0001 | <0.0001 |
| C. hosmeri | 31.73 | 0.41 | 4 | 86 | 0.9990 | 0.0111 | <0.0001 |
| C. infacetus | 35.08 | 0.71 | 5 | 121 | 0.9990 | 0.6355 | <0.0001 |
| C. mcdonaldi | 32.77 | 0.65 | 8 | 22 | 0.9999 | <0.0001 | <0.0001 |
| C. neglectus | 30.70 | 2.56 | 13 | 45 | 0.9985 | 0.0213 | <0.0001 |
3. Results
In producing DS2, the linear model of microclimate Tmax fits the empirical temperature data well, giving us confidence in its ability to estimate microclimate Tmax from air temperature (figure 1). For all focal species, the thermal regimes predicted by AWAP and DS2 are non-overlapping, indicating substantial differences in temperature between datasets for all species (figure 2). Importantly, the DS2 spatial layers rarely produce temperature estimates that exceed focal species' CTmax (table 1 and figure 2). This contrasts sharply with AWAP layers, for which the majority of all occurrences exist in locations that exceed the focal species' CTmax (table 1 and figure 2). The DS1 layers produce estimates of thermal regimes that exceed species' CTmax for four of the seven target species (table 1 and figure 2). Summing kernel densities above individual species' CTmax indicates an extremely low probability that any DS2 thermal regimes exceed the species known thermal limits (p < 0.0002 in all the cases, table 1); while the same procedure using the AWAP data show an extremely high probability that conditions at known occurrence sites exceed the species fundamental thermal niche (table 1).
Figure 1.
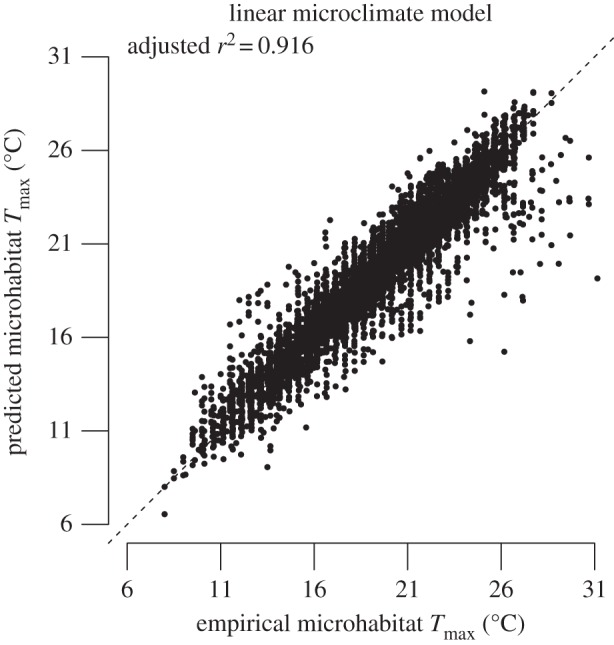
Relationship between empirical microclimate (underneath a fallen log) Tmax and predicted microclimate Tmax from the linear microclimate model. Line represents a 1 : 1 relationship.
Figure 2.
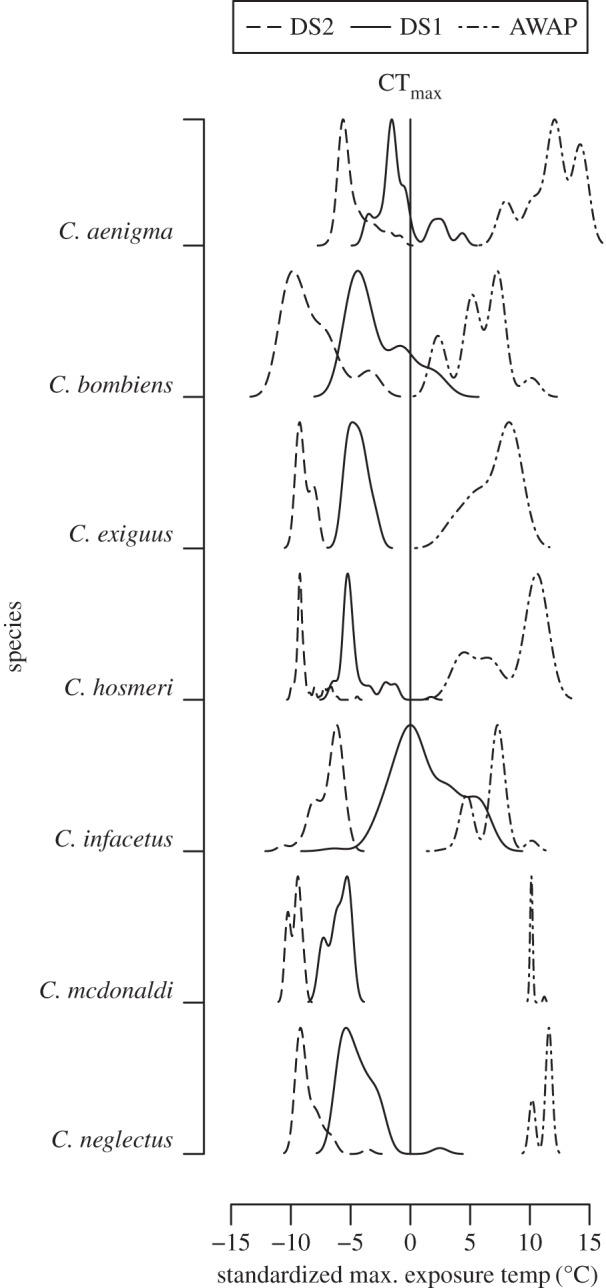
Thermal regimes predicted by three sets of weather layers. Temperature (x-axis) is standardized against individual species' CTmax (zero is CTmax for each species). The y-axis shows the probability density of temperature given each dataset, scaled against the maximum density for each species set.
4. Discussion
Currently available weather layers are powerful resources for ecological applications, yet in the context of vulnerability analyses they require adjustment to reflect microclimates species experience in situ. The addition of key environmental information to the AWAP layers via statistical downscaling allows for the DS1 layers to very accurately depict thermal regimes of open-air conditions [6]. In some cases, this procedure alone is enough to produce estimates of thermal regimes that are within the species' fundamental thermal niche. Yet, these layers are still not biologically sensible for a nocturnal species that shelters underneath logs during the day. The addition of the second, simpler, downscale procedure to the DS1 layers produces estimates of temperatures underneath logs during the day. The resultant dataset, DS2, produces a biologically meaningful depiction of thermal regimes that is consistent with the known thermal limits of all species.
We have presented a clear method for deriving microclimate surfaces that are accurate with respect to empirically measured temperatures and that predict thermal regimes within the known physiological limits of resident species. AWAP weather layers consistently predict thermal regimes at known occurrence points that exceed the focal species' CTmax, effectively placing individuals outside of their fundamental niche. The microhabitat-specific DS2 weather layers generated here effectively never predict thermal regimes that exceed a focal species' CTmax at a known occurrence point. This finding strongly supports the notion that increasing the biological relevance of weather layers—by including the important effects of behaviour (microhabitat use) and buffering at multiple scales—is a key aspect of robust vulnerability assessments.
As well as demonstrating the importance of downscaling coarsely resolved temperature data, our study also demonstrates the importance of using biological criteria (e.g. the physiological limits and distribution of species) to verify the resultant data. While both mechanistic and correlative approaches can be used to estimate microclimate (for a mechanistic approach, see the recent global dataset of Kearney et al. [15]), they both need to meet biological criteria to be convincing. In meeting biological criteria they can be more confidently used to estimate species' vulnerabilities.
Global climate change and other stressors will continue to threaten biodiversity into the foreseeable future, making the application of robust vulnerability analyses for species key to conservation outcomes. Estimates of species' exposure and sensitivity, which lie at the core of these analyses, must both then be accurate. Inaccuracies in these estimates may result in biologically nonsensical outcomes and call into question inference on exposure that flows from such data. Thus, we must generate accurate estimates of species' thermal regimes to be confident in the outcome of species' vulnerability assessments. Our results show that correlative techniques with explicit consideration of key abiotic and biotic factors provide biologically meaningful estimates of thermal regimes.
Data accessibility
Data deposited in Dryad, doi:10.5061/dryad.68m52.
Supplementary Material
Supplementary Material
Acknowledgements
The authors acknowledge two anonymous reviewers whose comments greatly improved this manuscript from its original draft.
References
- 1.Parmesan C, Yohe G. 2003. A globally coherent fingerprint of climate change impacts across natural systems. Nature 421, 37–42. ( 10.1038/nature01286) [DOI] [PubMed] [Google Scholar]
- 2.Williams SE, Shoo LP, Isaac J, Hoffmann AA, Langham G. 2008. Toward an integrated framework for assessing the vulnerability of species to climate change. PLoS Biol. 6, 2621–2626. ( 10.1371/journal.pbio.0060325) [DOI] [PMC free article] [PubMed] [Google Scholar]
- 3.Jones DA, Wang W, Fawcett R. 2009. High-quality spatial climate data-sets for Australia. Aust. Meteorol. Oceanogr. J. 58, 233–248. [Google Scholar]
- 4.Shoo LP, Storlie CJ, VanDerWal JJ, Little J, Williams SE. 2010. Targeted protection and restoration to conserve tropical biodiversity in a warming world. Glob. Change Biol. 17, 186–193. ( 10.1111/j.1365-2486.2010.02218.x) [DOI] [Google Scholar]
- 5.Scherrer D, Schmid S, Korner C. 2011. Elevational species shifts in a warmer climate are overestimated when based on weather station data. Int. J. Biometeorol. 55, 645–654. ( 10.1007/s00484-010-0364-7) [DOI] [PubMed] [Google Scholar]
- 6.Storlie CJ, Phillips B, VanDerWal JJ, Williams SE. 2013. Improved spatial estimates of climate predict patchier species distributions. Divers. Distrib. 9, 1106–1113. ( 10.1111/ddi.12068) [DOI] [Google Scholar]
- 7.Kearney M, Porter W. 2009. Mechanistic niche modelling: combining physiological and spatial data to predict species’ ranges. Ecol. Lett., 12, 334–350. ( 10.1111/j.1461-0248.2008.01277.x) [DOI] [PubMed] [Google Scholar]
- 8.Welbergen JA, Klose SM, Markus N, Eby P. 2008. Climate change and the effects of temperature extremes on Australian flying-foxes. Proc. R. Soc. B 275, 419–425. ( 10.1098/rspb.2007.1385) [DOI] [PMC free article] [PubMed] [Google Scholar]
- 9.Reside AE, VanDerWal JJ, Kutt AS, Perkins GC. 2010. Weather, not climate, defines distributions of vagile bird species. PLoS ONE 5, e13569 ( 10.1371/journal.pone.0013569) [DOI] [PMC free article] [PubMed] [Google Scholar]
- 10.Lutterschmidt WI, Hutchison VH. 1997. The critical thermal maximum: history and critique. Can. J. Zool. 75, 1561–1574. ( 10.1139/z97-783) [DOI] [Google Scholar]
- 11.Williams SE, et al. 2010. Distributions, life-history specialization, and phylogeny of the rain forest vertebrates in the Australian Wet Tropics. Ecology 91, 2493 ( 10.1890/09-1069.1) [DOI] [Google Scholar]
- 12.Cowles RB, Bogert CM. 1944. A preliminary study of the thermal requirements of desert reptiles. Bull. Am. Mus. Nat. History 83, 261–296. [Google Scholar]
- 13.VanDerWal JJ, Falconi L, Januchowski S, Shoo LP, Storlie CJ. 2012. SDMTools: Species Distribution Modelling Tools: tools for processing data associated with species distribution modelling exercises, R-Package version 1.13 See http://CRAN.R-project.org/package=SDMTools.
- 14.R Core Team. 2012. R: a language and environment for statistical computing. Vienna, Austria: R Foundation for Statistical Computing; (http://www.R-project.org/) [Google Scholar]
- 15.Kearney MR, Isaac AP, Porter WP. 2014. microclim: Global estimates of hourly microclimate based on long-term monthly climate averages. Sci. Data 1, 14006 ( 10.1038/sdata.2014.6) [DOI] [PMC free article] [PubMed] [Google Scholar]
Associated Data
This section collects any data citations, data availability statements, or supplementary materials included in this article.
Supplementary Materials
Data Availability Statement
Data deposited in Dryad, doi:10.5061/dryad.68m52.