

Abstract
We previously positionally cloned Sorcs1 as a diabetes quantitative trait locus. Sorcs1 belongs to the Vacuolar protein sorting-10 (Vps10) gene family. In yeast, Vps10 transports enzymes from the trans-Golgi network (TGN) to the vacuole. Whole-body Sorcs1 KO mice, when made obese with the leptinob mutation (ob/ob), developed diabetes. β Cells from these mice had a severe deficiency of secretory granules (SGs) and insulin. Interestingly, a single secretagogue challenge failed to consistently elicit an insulin secretory dysfunction. However, multiple challenges of the Sorcs1 KO ob/ob islets consistently revealed an insulin secretion defect. The luminal domain of SORCS1 (Lum-Sorcs1), when expressed in a β cell line, acted as a dominant-negative, leading to SG and insulin deficiency. Using syncollin-dsRed5TIMER adenovirus, we found that the loss of Sorcs1 function greatly impairs the rapid replenishment of SGs following secretagogue challenge. Chronic exposure of islets from lean Sorcs1 KO mice to high glucose and palmitate depleted insulin content and evoked an insulin secretion defect. Thus, in metabolically stressed mice, Sorcs1 is important for SG replenishment, and under chronic challenge by insulin secretagogues, loss of Sorcs1 leads to diabetes. Overexpression of full-length SORCS1 led to a 2-fold increase in SG content, suggesting that SORCS1 is sufficient to promote SG biogenesis.
Introduction
The obesity epidemic has brought about a dramatic increase in the proportion of the population with type 2 diabetes (T2D). Although obesity greatly increases the likelihood of developing T2D, most obese people remain nondiabetic. Genetic factors play an important role in determining who among obese people will develop diabetes. Human genome-wide association studies have suggested that many of these T2D susceptibility loci affect β cell function or β cell mass (1).
To mount the insulin response required to maintain normal glucose levels, β cells must sense the blood-borne nutrients, metabolize them efficiently, and transduce metabolic signals to the secretory pathway. This pathway triggers the exocytosis of secretory granules (SGs) containing insulin. The formation of SGs begins at the trans-Golgi network (TGN). SGs have a high Ca2+ concentration and a relatively low pH, factors that promote the aggregation of specific SG proteins. In β cells, proinsulin is synthesized and translocated to the ER. In the immature SGs, proinsulin is a substrate of 2 prohormone convertases, PC1/3 and PC2, which splice the C-peptide connecting the B and A chains of insulin. Carboxypeptidase E/H then trims the 2 basic amino acids at each cleavage site (2–5).
We positionally cloned Sorcs1 as a quantitative trait locus (QTL) for fasting insulin in a mouse F2 sample derived from ob/ob C57BL/6 (B6) and BTBR mice (6). Shortly thereafter, SORCS1 was found to be associated with human T2D (7) and diabetes complications (8, 9).
SORCS1 is homologous to yeast Vacuolar protein sorting-10 (Vps10), a receptor responsible for transporting soluble vacuolar enzymes to the yeast vacuole (the yeast equivalent of the mammalian lysosome) (10). Five spliced isoforms of SORCS1, which differ in their cytoplasmic tails, reside in distinct intracellular membranes (11).
In mammals, there are 5 members of the Vps10 gene family. These proteins have a wide range of functions (12–14). Sortilin, which only contains the Vps10 domain in its luminal segment, functions similarly to yeast Vps10; it transports some lysosomal enzymes to the mammalian lysosomes, apparently a backup for the mannose-6-phosphate recognition system (15). Sortilin has numerous other functions, including the sorting of GLUT4 vesicles (16), regulation of lipoprotein secretion via the targeting of newly synthesized APOB for lysosomal degradation (17–19), and the binding of proteins affecting neuronal growth and death (14, 20–23).
There is extensive debate in the field about the involvement of specific receptors in SG biogenesis. Some SG cargo proteins, when expressed in nonendocrine cells, can form SG-like vesicles through protein aggregation (24). However, these vesicles do not replicate all of the characteristics of bona fide SGs. Aggregation of insulin occurs after proinsulin is converted to insulin, indicating that the sorting to the immature SGs precedes aggregation (25–28). The issue of aggregation versus specific receptor-mediated targeting remains unresolved.
In protozoans, several members of the Vps10 family evolved to play an essential role in the formation of secretory organelles. These organelles, like mammalian SGs, are triggered for exocytosis and engage essentially the same molecular machinery (e.g., the SNARE complex) in this process. In Tetrahymena, 1 of 4 members of the Vps10 family, Sor4, is essential for the transport of soluble cargo to its secretory organelle, the mucocyst (29). In Toxoplasma, a Vps10 homolog is essential for the formation of its 2 secretory organelles, rhoptries and micronemes (30).
We deleted the Sorcs1 gene in mice to examine its effects on the secretory pathway of pancreatic β cells. We discovered that Sorcs1 is essential for the formation or stability of SGs in β cells of mice metabolically stressed by the leptinob mutation or exposure to glucose plus free fatty acids (FFAs), a phenotype strikingly similar to that seen in protozoans with deletion of their Vps10 genes. Loss of Sorcs1 results in a failure to efficiently replenish the pools of SGs required to support an increased demand for insulin secretion and thus, with the chronic metabolic challenge imposed by obesity, results in insulin insufficiency and diabetes.
Results
Deletion of Sorcs1 in the leptin-deficient mouse leads to diabetes.
We derived mice with the first exon of Sorcs1 flanked by LoxP sites and bred them to E2A-Cre mice to obtain whole-body Sorcs1 KO mice (Supplemental Figure 1A; supplemental material available online with this article; doi:10.1172/JCI74072DS1).
When made obese with the leptin deficiency caused by the leptinob allele, Sorcs1 KO mice develop severe diabetes. By 14 weeks of age, Sorcs1 KO ob/ob mice had an average fasting serum glucose of 440 ± 30 mg/dl, whereas the WT ob/ob mice had an average fasting glucose of 176 ± 42 mg/dl (Figure 1A). The diabetes in the Sorcs1 KO ob/ob mice started as early as 6 weeks of age and became more severe with age. Surprisingly, fasting plasma insulin levels did not differ significantly between B6 ob/ob and Sorcs1 KO ob/ob mice until 14 weeks of age (Figure 1B), when the KO mice exhibited a reduction in fasting insulin; i.e., fasting hyperglycemia preceded the reduction in fasting insulin.
Figure 1. Deletion of Sorcs1 in the leptin-deficient mice leads to diabetes.

(A and B) Plasma glucose (A) and insulin (B) levels following a 4-hour fast in female B6 ob/ob (n = 12) and Sorcs1 KO ob/ob (n = 10) mice as a function of age. (C–E) Plasma glucose (C), insulin (D), and insulin-to-glucose ratio (E) during an oral glucose tolerance test (OGTT) in 20-week-old female B6 ob/ob (n = 9) and Sorcs1 KO ob/ob (n = 12) mice. (F) Glucose during an intraperitoneal insulin tolerance test (IP-ITT) in 4-hour-fasted 12-week-old female B6 ob/ob (n = 8) and Sorcs1 KO ob/ob (n = 12) mice. Data are represented as mean ± SEM (*P < 0.05, **P < 0.005, ***P < 0.0001).
To examine whether the elevated fasting glucose levels in the Sorcs1 KO ob/ob mice resulted from altered glycemic control, we subjected 20-week-old B6 ob/ob and Sorcs1 KO ob/ob mice to an oral glucose tolerance test (OGTT) after a 4-hour fast. During the entire OGTT, Sorcs1 KO ob/ob mice had significantly higher glucose levels than B6 ob/ob mice (Figure 1C). However, when corrected for their baseline glucose levels, the area under the curve of glucose values was the same in the 2 groups, suggesting that glucose clearance was unaffected by the loss of Sorcs1 (Supplemental Figure 2C). Interestingly, irrespective of the presence of higher glucose levels in Sorcs1 KO ob/ob mice, insulin levels during the OGTT did not differ between B6 ob/ob and Sorcs1 KO ob/ob mice (Figure 1D). However, as demonstrated in Figure 1E, the ratio of insulin to glucose during the OGTT suggests that Sorcs1 KO ob/ob mice are secreting inappropriately lower levels of insulin with respect to their level of hyperglycemia.
To evaluate the effect of Sorcs1 deficiency on insulin sensitivity, intraperitoneal insulin tolerance tests were performed in mice fasted for 4 hours. Sorcs1 KO ob/ob mice were mildly insulin resistant as compared with B6 ob/ob mice (Figure 1F). However, liver gluconeogenic gene expression levels as well as liver triglyceride content were not significantly different between B6 ob/ob and Sorcs1 KO ob/ob mice (Supplemental Figure 2, E–G). The ability of exogenous insulin to stimulate the insulin signaling pathways (pIRS-1, p85, and pAMPK) was not greatly different between the B6 ob/ob and Sorcs1 KO ob/ob mice (see Supplemental Methods and Supplemental Figure 2, H and I). Taken together, our data suggest that deletion of Sorcs1 in the ob/ob background results in severe hyperglycemia associated with mild glucose intolerance and insulin resistance.
In contrast to the genetically obese mice, lean Sorcs1 KO mice do not develop diabetes. Fasting plasma glucose and insulin values were comparable between WT (B6 lean) and Sorcs1 KO (Sorcs1 KO lean) mice (Supplemental Figure 3, A and B). However, glucose values during an OGTT were higher in Sorcs1 KO lean mice at the last 2 time points, suggesting a subtle glucose clearance defect (Supplemental Figure 3C). Moreover, even though the values did not reach statistical significance, insulin values during the OGTT tended to be lower in the KO mice (Supplemental Figure 3D). Therefore, the insulin-to-glucose ratio in the KO mice is lower, further highlighting a subtle defect in glucose tolerance (Supplemental Figure 3E). Intraperitoneal insulin tolerance tests showed a similar degree of insulin sensitivity between the WT and KO lean mice (Supplemental Figure 3F).
We then investigated whether high-fat diet worsens the subtle glucose intolerance seen in Sorcs1 KO lean mice. We found, as previously suggested, the response to high-fat diet was variable between individual B6 mice (31), and approximately half of the mice, both WT and KO, were resistant to high-fat diet–induced weight gain. We therefore stratified the mice according to body weight gain and compared the glucose tolerance curves of the WT and KO mice that responded to the diet. The glucose values during the OGTT trended higher in Sorcs1 KO mice but did not reach statistical significance (Supplemental Figure 4B). These data suggest that the 45%-kcal-fat diet used here alone is not a sufficient metabolic stress to induce glucose intolerance in Sorcs1 KO mice.
Deletion of Sorcs1 in ob/ob mice leads to dramatic depletion of islet insulin and secretory granule content.
It was immediately evident during the islet isolation procedures that Sorcs1 KO ob/ob islets are pale to transparent as compared with the B6 ob/ob islets, which appear light yellow to golden under brightfield illumination (Figure 2A). To determine whether this phenotype is due to a reduction in insulin content, we measured islet insulin content by ELISA and observed an approximately 50% decrease in insulin content in the Sorcs1 KO ob/ob islets (Supplemental Figure 5A). This reduction in insulin seemed insufficient to account for the striking visual appearance of the islets. Thus, we directly measured mature insulin by MALDI/TOF analysis. Sorcs1 KO ob/ob islets had a severe depletion of mature insulin (Figure 2B). Spectra from B6 ob/ob islets showed all the expected prominent signals corresponding to the main peptide hormones present in islets (glucagon, insulin, islet-amyloid polypeptide, and pancreatic polypeptide). As expected, the insulin signal was the most prominent (Figure 2B, left). In contrast, spectra from Sorcs1 KO ob/ob islets confirm the marked decrease in the magnitude of signal corresponding to insulin, and show that glucagon was the dominant hormone (Figure 2B, right). Therefore, the ratio of insulin to glucagon was greatly reduced in Sorcs1 KO ob/ob islets.
Figure 2. Deletion of Sorcs1 leads to severe depletion of islet insulin content and mature secretory granules (SGs).

(A–D) Brightfield illumination (A), MALDI/TOF spectra (B), dithizone staining (C), and β cell ultrastructure (D) of isolated B6 ob/ob and Sorcs1 KO ob/ob islets. (E) Quantification of SGs per β cell cytoplasm from B6 ob/ob and Sorcs1 KO ob/ob β cells. (F) Brightfield images after dithizone staining of islets from nondiabetic and diabetic B6 ob/ob and Sorcs1 KO ob/ob mice. Fasting plasma glucose (mg/dl) and insulin (ng/ml) of the mice are shown as glucose/insulin. (G) Double staining of insulin (red) and glucagon (green) of isolated B6 ob/ob and Sorcs1 KO ob/ob islets. Granule quantification was carried out from electron microscopy images from 3 mice per genotype and 20 β cell fields per mouse. Data are represented as mean ± SEM. EG, empty granules; IAPP, islet-amyloid polypeptide; IG, immature granules; MSG, mature secretory granules; PP, pancreatic polypeptide.
The SGs predominantly import Zn2+ through the β cell–specific zinc transporter ZnT8 (32). Mature insulin forms hexameric crystals that combine with Zn2+ to form the dense core of the SGs. We subjected B6 ob/ob and Sorcs1 KO ob/ob islets to dithizone staining, a measure of insulin-Zn2+ crystals. Control B6 ob/ob islets stained positively for dithizone (Figure 2C, left: red). However, Sorcs1 KO ob/ob islets stained negatively for dithizone (Figure 2C, right), consistent with the severe depletion of mature insulin detected by MALDI/TOF.
We employed electron microscopy to quantitate the content of SGs in the B6 ob/ob and Sorcs1 KO ob/ob β cells. Relative to B6 ob/ob β cells, Sorcs1 KO ob/ob β cells had a 75% reduction in SGs (Figure 2, D and E). Sorcs1 KO ob/ob β cells also had a significantly greater proportion of vesicles devoid of a dense core (Figure 2E).
Loss of SGs can occur as a consequence of diabetes (33). Approximately 12% of Sorcs1 KO ob/ob mice were not diabetic. This provided us with the opportunity to determine whether the loss of granules occurs as a direct consequence of loss of Sorcs1 or is a consequence of hyperglycemia. Nondiabetic Sorcs1 KO ob/ob islets had the same severe loss of SGs as did the islets from the diabetic Sorcs1 KO mice, as revealed by dithizone staining (Figure 2F).
The severe loss of insulin in Sorcs1 KO ob/ob islets was further supported by immunohistochemical analysis of islet sections, which showed significant abnormalities in islet architecture and islet cell composition. As expected, islets from B6 ob/ob mice were composed of a large and uniform insulin-positive β cell core surrounded by a small number of glucagon-positive α-cells on the periphery (Figure 2G, left). In contrast, Sorcs1 KO ob/ob islets had greatly reduced insulin-positive cells and a relative increase in the number of glucagon-positive cells, which were distributed throughout the entire islet (Figure 2G, right). In addition, the isolated islet preparation from Sorcs1 KO ob/ob mice contained more smaller-sized islets compared with those from the B6 ob/ob mice (Figure 2, A and G). We therefore investigated the role of Sorcs1 in islet mass, β cell proliferation, and apoptosis. Quantitative morphometry analysis showed that islet mass, β cell BrdU incorporation into DNA, and apoptosis were not different between Sorcs1 WT and KO ob/ob mice (Supplemental Figure 6, A–E). In fact, pancreatic sections from Sorcs1 KO mice had larger-sized islets than WT sections (see Supplemental Methods and Supplemental Figure 6, A and B). These larger-sized islets, however, appear very fragile and would possibly be disrupted during islet isolation and thus were underrepresented in the islet preparations. Islets from lean Sorcs1 KO mice do not have the SG depletion phenotype, as assessed by immunohistochemistry, electron microscopy, and MALDI/TOF analysis (Supplemental Figure 7).
Overexpressed Sorcs1 colocalizes with perinuclear Golgi stacks and some post-Golgi compartments.
To gain further insight into the function of Sorcs1, we examined the localization of inducible myc-tagged Sorcs1a. After a brief induction using doxycycline, Sorcs1a primarily localized to a juxtanuclear region that partially overlapped with the cis-Golgi matrix protein GM130 (r2 = 0.43 ± 0.19) and the trans-Golgi protein TGN38 (r2 = 0.73 ± 0.24; see Supplemental Methods and Figure 3, A and B), but not with a marker for the ER, ERP72 (Supplemental Figure 8A). To further demonstrate that Sorcs1a is enriched in the Golgi, we examined its sensitivity to brefeldin A (BFA), an agent that causes dissolution of the entire Golgi apparatus. When we treated cells with BFA (10 mg/ml) for 30 minutes, the perinuclear staining of Sorcs1a was absent (Figure 3C). These data confirm that Sorcs1a localizes to a BFA-sensitive compartment, strongly supporting its function at the Golgi apparatus. Further colocalization studies with post-TGN organelle-specific markers showed that Sorcs1a is also partially colocalized with an early endosomal marker (Rab5; Figure 3D) and an SG marker (ChrB; Figure 3E), but not to a late endosomal marker (Rab7; Supplemental Figure 8B). It is important to note that Sorcs1a colocalization with ChrB is restricted to the Golgi region.
Figure 3. Overexpressed Sorcs1a colocalizes with perinuclear Golgi stacks and some post-Golgi compartments.
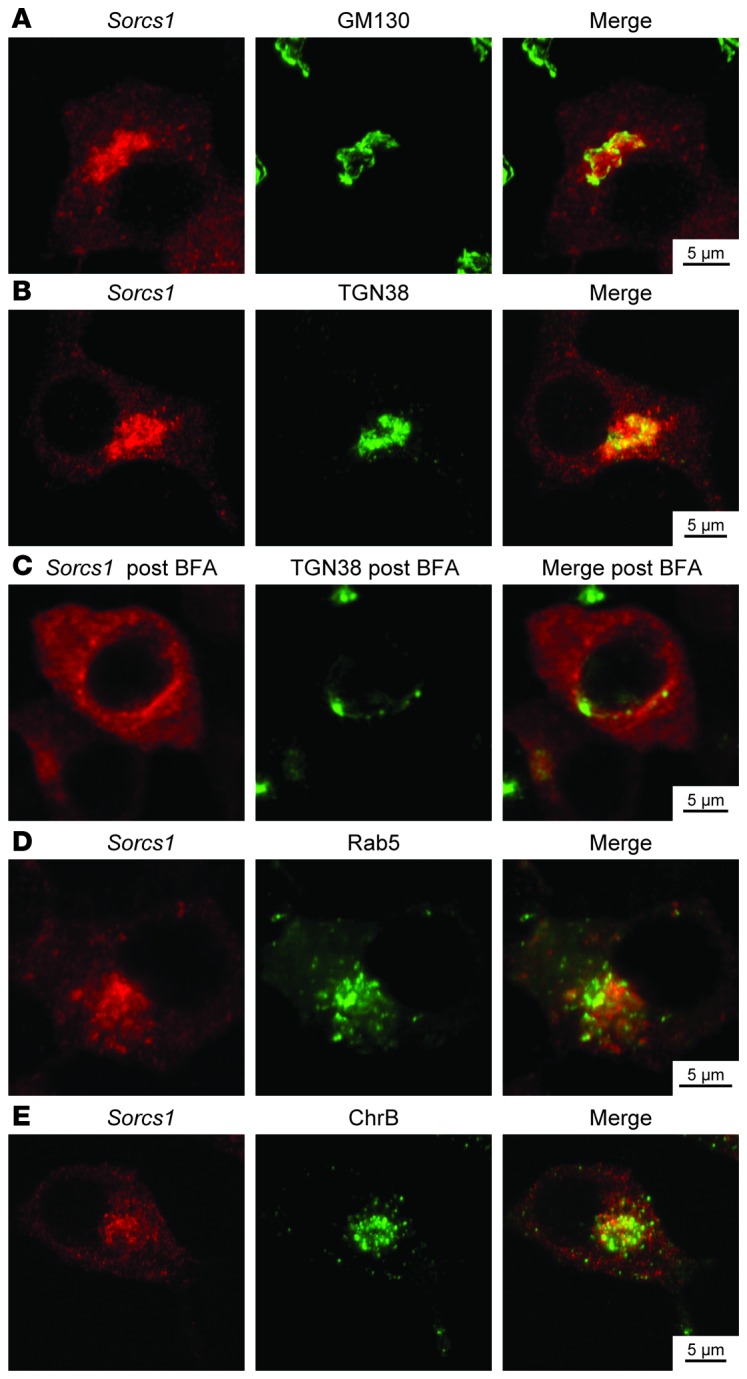
Double staining with myc-Sorcs1 (red) and either the cis-Golgi matrix protein GM130 (A), the trans-Golgi protein TGN38 before (B) or after (C) brefeldin A treatment, the early endosomal protein Rab5 (D), or the SG marker chromogranin B (E) (green) of INS1 832/13 cells stably transfected with myc-tagged inducible Sorcs1a plasmid 18 hours after induction with 25 ng/ml doxycycline.
Loss of Sorcs1 impairs proinsulin and proPC1/3 processing.
The severe loss of mature SGs suggests that Sorcs1 KO ob/ob β cells have a defect in SG formation or stability. These data predict that proinsulin should accumulate in a compartment preceding SGs. Immunohistochemical analysis of islet sections with an antibody that recognizes both proinsulin and the mature form of insulin (total insulin) shows that insulin does not colocalize with ERP72 (Supplemental Figure 9A) or GM130 (Supplemental Figure 9B) in B6 ob/ob or Sorcs1 KO ob/ob islets. Furthermore, insulin partially colocalized with TGN38, a TGN marker that cycles constitutively between the TGN and the plasma membrane (34) in B6 ob/ob islets (Figure 4A), indicating that under normal conditions, insulin is rapidly secreted through the ER and cis-Golgi to arrive at the TGN and post-Golgi SGs. In contrast, the vast majority of insulin colocalized with TGN38 around the perinuclear region in the Sorcs1 KO ob/ob islets (Figure 4A). Consistent with these findings, measurement of islet pro- and mature insulin content using mass spectrometry analysis showed severe depletion of mature insulin and an increase in islet proinsulin-to-insulin ratio in the Sorcs1 KO ob/ob islets (Figure 4, B and C).
Figure 4. Loss of Sorcs1 impairs proinsulin and proPC1/3 processing and increases islet insulin degradation.

(A) Double staining of islet cryosections for total insulin (red) and TGN38 (green) in B6 ob/ob and Sorcs1 KO ob/ob mice. (B and C) Mass spectrometry analysis of proinsulin and mature insulin content (B) and proinsulin-to-insulin ratio (C) in B6 ob/ob and Sorcs1 KO ob/ob islets. (D) Proinsulin processing in B6 ob/ob and Sorcs1 KO ob/ob islets. (E) Densitometric scanner analysis of the proinsulin and insulin bands in D. (F) Representative immunoblotting of freshly isolated B6 and Sorcs1 KO islet lysates probed for total PC1/3 and α-tubulin. (G) Quantitation of PC1/3 immunoblot as a ratio of proPC1/3 and des-PC1/3 to mature PC1/3. Data are represented as mean ± SEM.
To distinguish between decreased proinsulin biosynthesis and enhanced turnover of proinsulin and/or insulin, we performed pulse-chase experiments in isolated B6 ob/ob and Sorcs1 KO ob/ob islets. There was no defect in proinsulin synthesis or conversion to insulin in the Sorcs1 KO ob/ob islets. The major cause of the loss of insulin in Sorcs1 KO ob/ob islets is degradation (Figure 4, D and E). These results suggest that there is a pathway that can target insulin for degradation from an immature SG.
The key prohormone convertase, PC1/3, which regulates proinsulin conversion (35), like insulin, is made as a precursor protein, proPC1/3. Like proinsulin, it is processed at 2 cleavage sites. The first site is autocatalytically cleaved in the ER, generating a 75-kDa fragment from the 84-kDa precursor. The second site is cleaved in the immature granule and generates the mature 65-kDa product. Sorcs1 KO islets showed a 44% decrease in the conversion of the 75-kDa fragment to the mature product, helping to explain the slower rate of conversion of proinsulin to insulin (Figure 4, F and G).
Ectopic expression of the Sorcs1 luminal domain phenocopies the severe loss of SGs seen in the Sorcs1 KO β cells and thus acts as a dominant-negative.
Studies in 2 protozoan systems showed that their Vps10 proteins are essential for the formation of their secretory organelles (29, 30). In Toxoplasma, the Vps10 homolog TgSORTLR, when expressed in the absence of its cytoplasmic tails, acts as a dominant-negative and creates a secretory organelle deficit similar to the one seen with knockdown of TgSORTLR expression (30).
We stably expressed the luminal domain of SORCS1 (Lum-Sorcs1), which contains the Vps10 domain and the leucine-rich region in the mouse-derived MIN6 β cell line. As we observed in the Sorcs1 KO ob/ob β cells, the MIN6 cells expressing Lum-Sorcs1 showed a severe depletion of mature insulin and an increase in the proinsulin-to-insulin ratio, as measured by MALDI/TOF spectrometry (Figure 5A) and immunoblot (Figure 5B) analysis. Electron microscopy also shows an approximately 65% reduction in SG content in Lum-Sorcs1–expressing cells (Figure 5, C and D).
Figure 5. Lum-Sorcs1 acts as a dominant-negative.

(A–F) MALDI/TOF analysis (A), immunoblotting of proinsulin and mature insulin (B), β cell ultrastructure (C), quantitation of SGs per β cell cytoplasm (D), double staining of total insulin (red) and TGN38 (green) (E), and representative immunoblotting for TGN38 and β-actin (F) of control and Lum-Sorcs1–expressing MIN6 cells. (G) Quantitation of TGN38 immunoblot as a ratio of TGN38 to β-actin. EG, empty granules; IG, immature granules; MSG, mature secretory granules. Data are represented as mean ± SEM.
Lum-Sorcs1–expressing cells show perinuclear accumulation of total insulin, which colocalizes with TGN38 (Figure 5E). Whereas in the control MIN6 cells, total insulin staining extended throughout the cytoplasm and near the cell surface, insulin staining in the Lum-Sorcs1–expressing MIN6 cells was confined to the perinuclear region and colocalized with TGN38 (Figure 5E) and chromogranin B (Supplemental Figure 10). Chromogranin B in control cells typically accumulates in the TGN and SGs and occasionally colocalizes with insulin at the cell surface (Supplemental Figure 10). Total insulin, however, did not colocalize with ERP72 (Supplemental Figure 11A) or GM130 (Supplemental Figure 11B) in control or Lum-Sorcs1–expressing MIN6 cells. These data suggest that Sorcs1 plays a role in trafficking of SGs and/or their cargo and that Lum-Sorcs1 acts as a dominant-negative in a β cell line, replicating the phenotypes of metabolically stressed β cells from Sorcs1 KO ob/ob islets. In agreement with the perinuclear enrichment of TGN38 in the KO islets, immunoblotting analysis revealed an increase in TGN38 levels in the Lum-Sorcs1 cells (Figure 5, F and G), perhaps secondary to impaired vesicle transport.
To confirm that the perinuclear accumulation of insulin in Lum-Sorcs1–expressing cells reflects a failure to be secreted from the TGN, we triple-stained cells for total insulin, TGN38, and chromogranin B. In control MIN6 cells, insulin and chromogranin B were partially colocalized throughout the cytoplasm and at the cell surface, consistent with their distribution throughout the secretory pathway and SGs, as previously reported (36). By contrast, in Lum-Sorcs1–expressing cells, a major proportion of the insulin did not colocalize with chromogranin B (Figure 6). Rather, most of the insulin was stalled in the perinuclear region and colocalized with the TGN marker TGN38. This suggests a functional distinction between insulin-containing vesicles and those that contain chromogranin B; only the insulin vesicles depend on SORCS1.
Figure 6. Total insulin is stalled in the TGN in Lum-Sorcs1–expressing MIN6 cells.
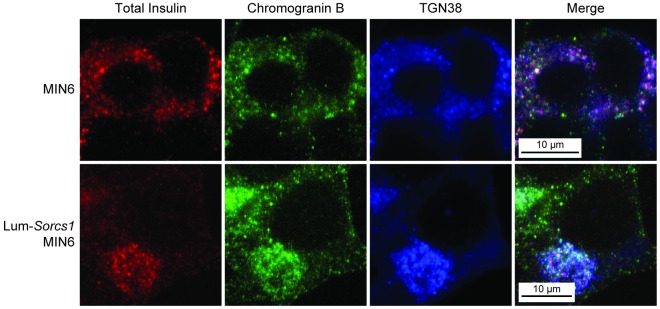
Triple staining of total insulin (red), chromogranin B (green), and TGN38 (blue) in control and Lum-Sorcs1–expressing MIN6 cells.
To examine whether Sorcs1 deficiency resulted in a general defect in post-Golgi vesicle biogenesis and trafficking, we investigated whether trafficking to the constitutive and to the lysosomal pathways were affected in Sorcs1 KO islets and in Lum-Sorcs1–expressing cells. Processing of the lysosomal enzyme procathepsin B to its mature form, cathepsin B, or trafficking of the insulin receptor to the surface membrane was not impaired in Sorcs1-deficient islets and in Lum-Sorcs1–expressing MIN6 cells (Supplemental Figure 12). Thus, the loss of Sorcs1 function selectively impairs the regulated secretory pathway.
Sorcs1 deletion specifically impairs insulin secretion under metabolic stress.
To explore the effects of Sorcs1 deletion on insulin secretion ex vivo, we isolated islets from B6 ob/ob and Sorcs1 KO ob/ob mice and measured insulin secretion after 1-hour static incubations in response to several secretagogues. As shown in Figure 7A, insulin secretion in response to KCl and 16.7 mM glucose was not significantly different between B6 ob/ob and Sorcs1 KO ob/ob islets. These results are consistent with the mild insulin secretion phenotype seen during the OGTT and clearly do not explain why these mice develop diabetes.
Figure 7. Sorcs1 deletion impairs insulin secretion under metabolic stress.

(A and B) Insulin secretion (A) and insulin content (B) in response to a single challenge of 1.7 mM glucose combined with 40 mM KCl or 16.7 mM glucose in B6 ob/ob (n = 5) or Sorcs1 KO ob/ob (n = 5) islets. (C) Representative immunoblotting of freshly isolated B6 ob/ob and Sorcs1 KO ob/ob islet lysates before (left) and 1 hour after (right) exposure to 16.7 mM glucose. Antibody against total insulin, which recognized both the pro- and the mature form of insulin, was used. (D and E) Insulin secretion (D) and insulin content (E) in B6 ob/ob (n = 5) and Sorcs1 KO ob/ob (n = 4) islets after 3 repeated secretagogue challenges. (F and G) Secreted insulin (F) and insulin content (G) from isolated islets of (n = 4) B6 and Sorcs1 KO lean mice cultured for 24 hours with 16.7 mM glucose. (H) Dithizone staining of B6 and Sorcs1 KO lean islets cultured for 18 hours with 16.7 mM glucose and 0.5 mM palmitate. (I and J) Secreted insulin (I) and insulin content (J) from isolated islets of (n = 4) B6 and Sorcs1 KO lean mice cultured for 24 hours with 16.7 mM glucose and 0.5 mM palmitate. Data are represented as mean ± SEM.
When challenged by a single exposure to an insulin secretagogue, β cells typically secrete 1%–5% of their insulin content. Thus, the single challenge of an OGTT (typically conducted after a fast) or ex vivo study using isolated islets might not be sufficient to reveal the limitations imposed by the defect in the formation of SGs in the Sorcs1 KO ob/ob mice. Following a 1-hour incubation in 16.7 mM glucose, the Sorcs1 KO ob/ob islets secreted insulin at a level comparable to that of B6 ob/ob islets, but were severely depleted of their mature insulin content (Figure 7C). We therefore predicted that in an intact obese animal, this would eventually deplete the pool of SGs that is preferentially recruited to secrete insulin, i.e., Sorcs1 KO ob/ob islets do not have an insulin secretory dysfunction per se. Rather, they are slow to replenish their SGs during chronic metabolic challenge.
To mimic the repeated metabolic challenge caused by the hyperphagia of the ob/ob mouse, we exposed islets from B6 ob/ob and Sorcs1 KO ob/ob mice to 3 cycles of secretagogue challenge and asked whether the resulting insulin depletion manifests itself in an insulin secretory dysfunction. Both B6 ob/ob and Sorcs1 KO ob/ob islets secreted less insulin after the third challenge, but the phenotype was far more profound in Sorcs1 KO ob/ob islets, where the relative decline in insulin secretion was approximately 3 times greater than in B6 ob/ob islets (P = 0.0007; Figure 7D).
We then investigated whether chronic exposure of islets from lean Sorcs1 KO mice to sustained metabolic challenge would lead to SG depletion and insulin secretory dysfunction. We therefore exposed islets to either 16.7 mM glucose or 16.7 mM glucose with 0.5 mM palmitate for 24 hours. We then assessed insulin content and insulin secretion in response to 16.7 mM glucose or 16.7 mM glucose plus a secretagogue cocktail (40 mM KCl, 15 mM carbachol, and 0.5 mM 3-isobutyl-1-methylxanthine [IBMX]) to induce a maximal secretory response. Following a 24-hour culture at 16.7 mM glucose, Sorcs1 KO lean islets secreted insulin at a level comparable to that of B6 lean islets (Figure 7F). Total insulin content was not different between WT and KO islets under these conditions (Figure 7G). However, 24-hour exposure of Sorcs1 KO lean islets to 16.7 mM glucose with 0.5 mM palmitate led to depletion of islet insulin content as assessed by dithizone staining (Figure 7H) and insulin ELISA (Figure 7J). This palmitate-induced depletion of insulin content in Sorcs1 KO islets resulted in approximately 50% reduction in insulin secretion in response to the secretagogue cocktail (Figure 7I).
Finally, we investigated insulin secretion in the β cell line expressing Lum-Sorcs1. Like the β cells from the Sorcs1 KO ob/ob mice, cells expressing Lum-Sorcs1 displayed a severe depletion of mature insulin and SGs (Figure 5). In response to 16.7 mM glucose or 40 mM KCl, the cells showed a severe defect in insulin secretion (Figure 8A). Taken together, these results indicate that loss of Sorcs1 function specifically depletes β cell insulin content under conditions of metabolic stress, leading to a defect in insulin secretion.
Figure 8. Loss of Sorcs1 action impairs insulin secretion.

Secreted insulin (A), insulin content (B), DNA content (C), and insulin/DNA content (D) in control MIN6 and Lum-Sorcs1 MIN6 cells (n = 3). Data are represented as mean ± SEM (*P < 0.05, **P < 0.005, ***P < 0.0001).
Cells expressing the Sorcs1 luminal domain have a defect in the formation of new SGs.
We hypothesized that the insulin secretion defect seen after chronic metabolic challenge was mainly due to the inability of Sorcs1 KO ob/ob β cells to replenish their SG content. We took advantage of an adenoviral construct, syncollin-dsRed5TIMER, a syncollin-GFP construct that can target GFP directly to the SG (37–39). The dsRed5TIMER is a coral fluorescent protein that changes its emission characteristics with time. When the granules are younger (approximately 12–18 hours) they appear green, and after 24–36 hours the granules are red, and thus the reporter serves as a live cell timer that enabled us to distinguish new versus old SGs. It is well documented that in insulin-secreting cells, there is preferential release of newly formed granules in response to a stimulus (40–44), which predicts that we should see selective depletion of green granules.
Approximately 36–48 hours after infection, we followed the fate of newly formed (green) SGs after exposure of the cells to basal (1.7 mM) or stimulatory (16.7 mM) glucose concentrations. After 30 minutes of incubation in 1.7 mM glucose, we observed a baseline cytoplasmic distribution of insulin-containing granules in both control and Lum-Sorcs1–expressing cells (Figure 9, A and B, left). In control cells, following 10 minutes of exposure to 16.7 mM glucose, there was a significant decrease in the green fluorescent signal, a consequence of glucose-stimulated exocytosis of newly formed insulin granules (Figure 9A, middle). The green fluorescent signal returned 50 minutes after glucose stimulation, indicating rapid SG replenishment (Figure 9A, right).
Figure 9. Lum-Sorcs1–expressing cells have a defect in mature secretory granule replenishment.

Confocal microscopy of control (A) and INS1 832/13 cells transiently transfected with luminal Sorcs1 (B) followed by adenoviral infection with syncollin-dsRed5TIMER. Cells were left to recover for 36–48 hours and analyzed after 30 minutes of exposure to 1.7 mM glucose (left) or 10 minutes (middle) or 50 minutes (right) of exposure to 16.7 mM glucose. Yellow arrows identify perinuclear accumulation of syncollin.
In Lum-Sorcs1–expressing cells, 10 minutes after glucose stimulation, most of the green fluorescent signal disappeared as it did in the normal MIN6 cells, indicating an intact insulin secretory pathway (Figure 9B, middle). The remaining green fluorescence was primarily confined to the perinuclear region, as in the β cells from Sorcs1 KO ob/ob islets (Figure 4A and Figure 5E), suggesting a delay or a defect in granule biogenesis. Fifty minutes after the glucose challenge, the Lum-Sorcs1–expressing cells were far less able to replenish their content of new SGs, continuing to display perinuclear accumulation of green fluorescence (Figure 9B, right). Quantitation of the images showed that there was a 4.5-fold higher proportion of the cells accumulating insulin in the perinuclear area among the Lum-Sorcs1 cells compared with the normal MIN6 cells (45% vs. 10% of cells). Taken together, these results indicate that loss of Sorcs1 function specifically impairs the ability of β cells to replenish their SG content under conditions of metabolic stress, leading to a defect in insulin secretion.
Overexpression of full-length Sorcs1a increases SGs and insulin content.
Loss of Sorcs1 function resulted in a severe loss of SGs, implying that in metabolically challenged cells, Sorcs1 is limiting for the production of new SGs. We sought to determine whether an increase in Sorcs1 would be sufficient to promote an increase in the formation of SGs. We employed electron microscopy to quantitate the content of SGs before and after induction of Sorcs1 expression with doxycycline. We observed that 18 hours after induction of Sorcs1 by doxycycline, there was a twofold increase in SG content (Figure 10, A and B). Consistent with these observations, insulin content, as measured by immunoblotting, was also increased in cells overexpressing Sorcs1a (Figure 10C). These data show that an increase in Sorcs1 expression, by itself, is sufficient to markedly increase SG content.
Figure 10. Overexpression of full-length Sorcs1a in INS 832/13 cells increases MSGs and insulin content.

(A) β Cell ultrastructure of INS 832/13 cells before and 18 hours after induction with 25 ng/ml doxycycline (Dox). (B) Quantitation of SGs per β cell cytoplasm. (C) Immunoblot analysis of total insulin in lysate from INS 832/13 cells before and 18 hours after induction with 25 ng/ml doxycycline. Data are represented as mean ± SEM. IG, immature granules; MSG, mature secretory granules.
Discussion
The formation of SGs begins in the TGN and involves the transport of cargo proteins into immature vesicles, a process that has been termed “sorting for entry” (45). Many cargo proteins tend to aggregate in the low-pH, high-Ca2+ environment of the SGs. It has been suggested that this aggregation process is sufficient for SG maturation, a process termed “sorting by retention” (24, 45–48). Genetic studies in Caenorhabditis elegans and Drosophila have shown that specific proteins are required for the sorting and aggregation of SGs (49, 50). In addition to trafficking proteins, there appear to be proteins involved in the budding process at the TGN that play a role in SG formation. Pick1 and ICA69 were recently shown to form a complex that is required for the maturation of SGs (26, 51). Loss of Pick1 causes β cells to produce and secrete less mature insulin, but more proinsulin, consistent with the failure to form the mature SGs needed to convert proinsulin to insulin (26).
The Vps10 protein was first discovered as essential for trafficking proteins to vacuoles in yeast (52). Its mammalian homolog, sortilin, plays a similar role and is apparently complementary to the mannose-6-phosphate lysosomal targeting pathway (53, 54). The sortilin cytoplasmic tail binds to several cytosolic proteins that are necessary for its targeting function, including GGA and the AP3 complex (55). More recent findings suggest that Vps10 proteins function in SG biogenesis and that these proteins interact with cargo and with cytosolic proteins that mediate vesicle trafficking. For example, brain-derived neurotrophic factor targeting depends on sortilin (56). In addition, the targeting of cathepsin H to SGs is entirely dependent on sortilin (15). In several protozoans, a Vps10 homolog has been shown to be essential for the formation of secreted organelles, similar to mammalian SGs (29, 30). It is interesting that in Toxoplasma, which does not have the mannose-6-phosphate sorting system, the loss of its Vps10 protein results in a complete deficiency of its secretory organelles (30).
We first identified a connection between Sorcs1 and insulin levels through a mouse genetics screen in an obese F2 sample derived from 2 mouse strains, C57BL/6 and BTBR (6). We followed up this clue by deriving mice deficient in Sorcs1. When made obese with the leptinob mutation, the mice became severely diabetic. The most prominent feature of these mice is their severe loss of SGs and mature insulin in their β cells. However, islets from these mice retained their ability to secrete insulin in response to a single secretagogue challenge. Indeed, the animals showed a nearly normal response to a single glucose challenge during an OGTT. In addition, the mice had fasting hyperglycemia several weeks before they showed a drop in fasting insulin (Figure 1, A and B). However, with multiple secretagogue challenges, the isolated islets showed a defect in insulin secretion that parallels their depletion of insulin and SGs (Figure 7D). We and others routinely subject mice to a 4-hour fast prior to the glucose tolerance test; thus the animals were not sufficiently metabolically stressed to elicit an insulin secretion defect. Perhaps the multiple-challenge protocol is a better mimic of chronic metabolic challenge.
These results have important implications for the identification and characterization of prediabetic humans. Typical glucose tolerance tests subject an individual to a single challenge by an insulin secretagogue, usually glucose. However, β cells need only secrete a small fraction of their insulin content to satisfy this challenge. Thus, with just a single challenge, a person with a defect in SG replenishment might appear normal. On the basis of our results, we suggest that when applied to human subjects, multiple secretagogue challenges might identify prediabetic individuals who would otherwise appear normal. In the context of genetic studies, this phenotype might reveal genetic variation in the formation and trafficking of SGs and thus help to fill the gap between known diabetes susceptibility genes and the estimated high heritability of human diabetes, known as the “hidden heritability.”
Deletion of Sorcs1 did not result in a discernible defect in SG biogenesis in lean mice or in mice fed a high-fat/high-carbohydrate diet. Leptin deficiency imposed a chronic stress that made SORCS1 essential for normal SG biogenesis. Leptin acts directly on β cells to inhibit insulin secretion (57) and insulin gene transcription (58). Thus, leptin deficiency might create an increased demand for SG formation.
Dyslipidemia is a common feature of prediabetes and often involves an elevation of FFAs. We exposed islets from lean Sorcs1 KO mice to high glucose and palmitate to investigate whether under these conditions, loss of Sorcs1 would mimic the β cell phenotypes seen in islets from leptin-deficient mice. Indeed, these islets had a loss of SGs and a defect in insulin secretion (Figure 7, H–J), showing that Sorcs1 is essential for SG replenishment under chronic metabolic challenge either by strong insulin secretagogues or leptin deficiency.
The hyperglycemia of the obese Sorcs1 KO mice preceded the drop in fasting insulin (Figure 1, A and B). The insulin tolerance tests show that the Sorcs1 KO ob/ob mice have a mild increase in insulin resistance. However, it is also possible that SORCS1 affects glucose homeostasis through its actions in other tissues. Sorcs1 is expressed most highly in the brain. We have found that SORCS1 affects the processing of vasopressin (unpublished observations). Thus, it is possible that it also affects the processing of peptide hormones in the brain that regulate insulin action or directly regulate glucose metabolism.
In protozoans, Vps10 homologs play a role in the function and biogenesis of their secretory organelles. In Tetrahymena, a Vps10 homolog, Sor4, is essential for the transport of at least 2 soluble cargo proteins, Grt1p and Igr1p, to the mucocyst, a secretory organelle (29). In a recent study, Sor4-deficient Tetrahymena had a complete absence of mucocyst discharge, and Grt1p was secreted via the constitutive pathway. Sor4 expression is induced in coordination with SG proteins upon discharge of the mucocyst. One of these proteins, AP3, has recently been shown to be essential for the regulated secretion of insulin in β cells; β cells deficient in AP3 secreted insulin through the constitutive pathway (59, 60). In Toxoplasma, deletion of the Vps10 homolog sortilin-like receptor (TgSORTLR) abolished the formation of its secretory organelles, rhoptries and micronemes. Similarly, expression of a C-terminally truncated TgSORTLR protein led to mistargeting of secretory organelle proteins (30). Together, the results from the protozoan studies show that Vps10 proteins must interact with particular cargo proteins and with cytosolic trafficking proteins for the proper formation of SGs.
We expressed a luminal domain of Sorcs1 in a β cell line. The cells showed a very severe loss of mature insulin. The remaining insulin was confined to a perinuclear area, consistent with the TGN. We were surprised by the severity of this phenotype. It is possible that in addition to Sorcs1, the luminal domain of Sorcs1 acted as a dominant-negative against other proteins, e.g., the other 4 members of the Vps10 family, and that these other proteins are also involved in the formation of SGs.
In both the Sorcs1 KO β cells and the β cell line expressing Lum-Sorcs1, insulin was stalled at the TGN. In contrast, in the β cell line, the SG marker chromogranin B was normally distributed. In the Sorcs1 KO islets, there was incomplete processing of PC1/3. From these studies, we propose that Sorcs1 is a receptor that is essential for SG biogenesis under conditions of increased insulin demand. The pulse-chase experiments show that most of the proinsulin is converted to insulin in the Sorcs1 KO islets. Yet most of the insulin is degraded. This suggests that SORCS1 is functioning at or beyond the immature SG and that within this compartment, insulin can be targeted for degradation.
Under ordinary circumstances, there must exist a mechanism for basal SG biogenesis, and thus loss of Sorcs1 does not lead to an insulin deficit. But, in the absence of Sorcs1, chronic stimulation of insulin secretion leads to depletion of the readily recruitable pool of SGs. This could explain how chronic food consumption or chronically elevated FFAs could lead to diabetes in subjects with a limited ability to replenish SGs. SG formation and function requires numerous proteins. Thus, in addition to Sorcs1, many other loci could produce a phenotype similar to that of the obese Sorcs1 KO mice and not be evident until subjected to a strong metabolic stress.
We asked whether Sorcs1 functions generally across both the constitutive and regulated secretory pathways. We examined the localization of the insulin receptor and the processing of cathepsin B, which occurs in the lysosomes. Both of these processes were normal in both the Sorcs1 KO β cells and the cell line expressing Lum-Sorcs1. Thus, SORCS1 appears to specifically function in the regulated secretory pathway.
Recent studies show that newly formed SGs are especially favored for recruitment into the readily releasable vesicle pool (40–44). Thus, a defect in the biogenesis of new SGs should result in a limited pool of these new vesicles. Using a “timer” fluorescent probe that changes color at 30 hours, we were able to ask whether there is a specific reduction in the pool of new SGs after insulin secretion in a β cell line expressing the dominant-negative Lum-Sorcs1. Our data show that there was indeed a reduction in the new (green fluorescent) vesicles, indicating that Sorcs1 is important for the replenishment of new SGs. When we overexpressed full-length SORCS1, we observed a large increase in the number of SGs, suggesting that the amount of SORCS1 in a cell is limiting for the number of SGs, and perhaps strategies to increase SORCS1 expression might provide a means to enhance the formation of SGs in people susceptible to diabetes.
In summary, we have shown that a member of the Vps10 gene family is involved in the biogenesis of SGs in mammalian cells. The phenotype of the Sorcs1 KO mice is not a classic diabetes phenotype. Although the mice are diabetic, conventional approaches to assess β cell function did not reveal insulin secretory abnormalities severe enough to explain their diabetes. Yet the β cells have a severe loss of SGs and mature insulin. Our characterization of β cells with loss of Sorcs1 function revealed that they have a defect in replenishment of SGs, and thus new protocols involving repeated secretagogue challenges were required to expose an insulin secretion defect.
Sorcs1 is part of an ancient gene family involved in vesicle trafficking. Its functions evolved from transport of specific proteins to lysosomes to SG biogenesis. This pathway is fundamental to a diversity of biological processes and thus explains why Sorcs1, in addition to diabetes, is associated with other diseases, including diabetes complications and Alzheimer’s disease (61–64).
Methods
Generation of Sorcs1 KO mice, breeding, and genotyping.
The strategy to generate conditional Sorcs1 KO mice is summarized in Supplemental Figure 1A. The procedure involved insertion of LoxP sites with a neomycin selection cassette downstream of exon 1 and within intron 1 of the gene. After homologous recombination in SV129-derived ES cells, and injection of recombinant cells into C57BL/6 (B6) blastocysts, homozygous floxed mice were mated with E2A-Cre–expressing B6 mice to generate heterozygous mice carrying the Sorcs1 KO allele. These mice were then backcrossed for at least 8 generations to B6 mice heterozygous for the leptin ob mutation (ob/+) to generate lean and obese whole-body B6 and Sorcs1 KO mice. B6 ob/+ mice were purchased from the Jackson Laboratory and bred at the University of Wisconsin Animal Care Facility.
To genotype the Sorcs1 KO alleles, 2 PCR reactions were performed. The first reaction contained Sorcs1-LoxP forward primer (Sorcs1-LoxPF) (GCAACTTTGTCCTGTCCTATCCTATC) and Sorcs1-LoxP reverse primer (Sorcs1-LoxPR1) (CGCTTGAAAGTGTTTGCTGTGGGAC), resulting in an 800-bp band indicating the presence of the WT (B6) allele. The second PCR contained Sorcs1-LoxPF and Sorcs1-LoxPR2 (GTCACTGGGATCTATCTATCTGATCT), where a 280-bp band signifies the KO allele. PCR conditions were as follows: 3 minutes at 95°C, followed by 35 cycles of 30 seconds at 95°C, 30 seconds at 59°C, and 30 seconds at 72°C, then 3 minutes at 72°C to a 4°C hold. The resulting PCR product is shown in Supplemental Figure 1B.
Animal procedures.
Mice were housed in an environmentally controlled facility (12-hour light and dark cycles) with free access to food (5008; Purina) and water. Only female mice were used in this study. Fasting blood glucose and insulin levels were measured weekly from 6 to 18 weeks of age. Mice were fasted from approximately 8 am until noon before blood collection from the retro-orbital sinus for plasma glucose and insulin measurements. Plasma glucose levels were measured using a commercially available kit (994-90902; Wako Chemicals). Plasma insulin was measured via ELISA using a matched rat insulin antibody pair (Fitzgerald Industries International Inc.). Glucose tolerance tests were performed on 20-week-old mice fasted for 4 hours (6 am–10 am). Glucose (2 mg per g of body weight in sterile saline) was administered orally. Blood samples (<50 μl) were drawn before glucose injection and at 5, 15, 30, 60, 120, 240, and 360 minutes (for the ob/ob mice) and at 5, 15, 30, 60, 120 (for the lean mice) after injection for glucose and insulin measurements. Insulin tolerance tests were performed on 12-week-old mice after a 4-hour fast. Blood samples were drawn before i.p. insulin injection (20 mU per g body weight in sterile saline; Humulin R, HI-210; Eli Lilly) and at 5, 30, 60, 120, and 150 minutes after injection for glucose measurements. Animals were allowed free access to water, but food was removed from the cages during both of these tests. The data in Figure 1 are from 2 different cohorts of mice. The mice used for the data shown in panels A and B were simply aged and not exposed to any other handling or treatment other than infrequent blood sampling to measure glucose and insulin levels. The second cohort was subjected to much more handling; i.e., glucose and insulin tolerance tests and weekly glucose and insulin levels. We believe the differences in the fasting glucose and insulin between the 2 cohorts of mice are therefore due to the extra handling stress in the second cohort.
For the high-fat diet studies, B6 lean and Sorcs1 KO lean mice were fed a 45%-kcal-fat diet (Teklad TD.08811; Harlan Laboratories), and their body weight was measured weekly. Sixteen weeks after the high-fat diet, OGTT was performed and insulin and glucose values measured as indicated above.
Isolation of mouse pancreatic islets.
Islets were isolated from mice using a collagenase digestion procedure with the following modifications (65): 0.6 mg/ml Type XI collagenase (Sigma-Aldrich) in HBSS (GIBCO) with 0.35 g/l sodium bicarbonate and 0.02% RIA grade BSA (Sigma-Aldrich) was injected into the common bile duct. The pancreas was removed and incubated at 37°C in a shaking water bath for 16 minutes. After 2 washes, the digested pancreas was passed through a 1,000-mm mesh and subjected to a Ficoll (Sigma-Aldrich) gradient. As a final purification, islets were hand-picked in HEPES Krebs buffer (20 mM HEPES, pH 7.4; 119 mM NaCl; 4.75 mM KCl; 2.54 mM CaCl2; 1.2 mM MgSO4; 1.18 mM KH2PO4; 5 mM NaHCO3) containing 5 mM glucose and 0.5% BSA. Islet brightfield illumination was evaluated with a cold light source (3,000 K) using a Leica MZ 95 dissection microscope at ×1. For ob/ob islet insulin secretion experiments, islets were cultured overnight in RPMI 1640 containing 11.1 mM glucose and 10% heat-inactivated FBS and penicillin/streptomycin.
For ex vivo chronic metabolic challenge experiments, islets isolated from lean Sorcs1 KO mice were cultured for 24 hours in RPMI 1640 containing 10% heat-inactivated FBS and penicillin/streptomycin and 16.7 mM glucose with or without 0.5 mM palmitate conjugated with BSA in a 3:1 molar ratio. Insulin secretion in response to either 16.7 mM glucose or 16.7 mM glucose plus a secretagogue cocktail (40 mM KCl, 15 μM carbachol, and 0.5 mM IBMX) was then performed as described below.
Islet insulin secretion.
Static insulin secretion assays were performed on preparations as previously described (65) with the following modifications. Three islets of equivalent size were placed in 12-by-75-mm glass tubes, where the bottom of the tube was formed by a 62-mm mesh (Tetko). The 12-by-75-mm tubes were transferred to 16-by-100-mm tubes containing 1 ml of HEPES Krebs buffer with 3 mM glucose and 0.5% BSA and preincubated at 37°C for 45 minutes. After the preincubation, the 12-by-75-mm tubes were transferred to a fresh 16-by-100-mm tube containing 1 ml HEPES Krebs buffer supplemented with 1.7 or 16.7 mM glucose with and without the indicated test compound. After a 15-minute (1.7 mM glucose + 40 mM KCl) or a 45-minute incubation period (16.7 mM glucose) at 37°C, the 12-by-75-mm tubes were transferred to a fresh tube containing 1 ml of HCl/ethanol/water (1:50:14) to extract cellular insulin from the islets. The incubation medium left in the 16-by-100-mm tube was collected and frozen for insulin determination by an in-house ELISA (Fitzgerald Industries International Inc.) as described in the Animal procedures section. For repeated secretagogue challenge experiments, islets were incubated for 45 minutes at 37°C in 3 mM glucose, followed by three 15-minute challenges (1.7 mM glucose with 40 mM KCl, 1.7 mM glucose with 40 mM KCl, and 16.7 mM glucose, respectively) with a 5-minute (3 mM glucose) recovery between challenges. Islets and media were treated as above.
Islet dithizone staining.
Islet dithizone staining was performed as previously described (66) with a 0.13-mM dithizone solution in PBS for 5 minutes at room temperature. Pictures were taken with a Leica MZ 95 Scope at ×6.
Islet immunofluorescence.
For immunohistochemistry, a minimum of 100 islets were fixed in 4% PFA for 3 hours at 4°C. Islets were centrifuged at 300 g for 3 minutes and the PFA aspirated. Fifty microliters of Affi-Gel blue bead slurry (BioRad) was added to islets to aid visualization during sectioning. Agar was gently added to the mixture and allowed to solidify. The agar was removed from the tube and embedded in paraffin. Five-micrometer serial sections were deparaffinized with xylene, rehydrated in a graded series of ethanol, and subjected to antigen retrieval in Antigen Unmasking Solution (Vector Laboratories) and blocked. Guinea pig antibody against insulin (1:500; I-8510; Sigma-Aldrich), mouse antibody against glucagon (1:100; G-2654; Sigma-Aldrich), rabbit antibody against ER marker ERP72 (1:250; 5033; Cell Signaling), mouse antibody against cis-Golgi marker GM130 (1:250; 610823; BD), and mouse antibody against trans-Golgi network marker TGN38 (1:250; a gift from Katherine Howell, University of Colorado, Denver, Colorado, USA) (67, 68) were added and incubated at 4°C overnight. Slides were washed with TBS containing 0.25% Triton X-100 before the addition of Cy3-conjugated donkey anti–guinea pig (1:500; 706-165-148; Jackson ImmunoResearch), Alexa Fluor 488–conjugated goat anti-mouse (1:500; A11001; Life Technologies), and Alexa Fluor 488–conjugated goat anti-rabbit (1:500; A-11008; Life Technologies) secondary antibodies. The slides were then incubated in the dark for 1 hour at room temperature, washed with TBS, and allowed to air-dry in the dark. Staining was preserved and nuclei identified by the addition of a drop of Vectashield with DAPI (H-1200; Vector Laboratories) to each tissue section before the addition of a cover slip. Images were acquired on a swept-field confocal microscope (Nikon Ti-E) equipped with a Roper CoolSnap HQ2 charge-coupled device (CCD) camera using a Nikon 60×, 1.4 numerical aperture Plan Apo oil objective lens. Acquisition parameters were controlled by Nikon Elements software.
Islet MALDI/TOF analysis.
MALDI/TOF analysis was performed as previously described (69). Freshly isolated islets (a single islet per well) were covered with matrix solution (7 mg/ml a-cyano-4-hydroxy-cinnamic acid in 50% acetonitrile, 0.05% trifluoroacetic acid [TFA]), and MALDI mass profiling of the islets was performed by Voyager DE-Pro mass spectrometer (Applied Biosystems) equipped with a nitrogen laser (337 nm) operating in positive-ion linear mode acquiring spectra in the mass range from m/z 2,000 to 6,000.
Islet Western blotting.
Total protein extracts were obtained from freshly isolated islets, which were lysed in 1× cell signaling lysis buffer (50 mM Tris, pH 8; 1% NP-40; 150 mM NaCl; 1 mM EDTA) containing protease inhibitors (Roche) and 1 mM PMSF. For total insulin analysis, islet extracts were analyzed on 16.5% Tris-tricine-urea-SDS-PAGE under nonreducing conditions (70). Anti–guinea pig insulin primary antibodies that recognized both pro- and mature insulin were used to probe the PVDF membranes after gel transfer (Sigma-Aldrich). For total cathepsin B analysis, islet lysates were analyzed on 12.5% SDS-PAGE and probed with an anti–rabbit cathepsin B antibody (Santa Cruz Biotechnology). For total PC1/3 analysis, islet lysates were analyzed on 7.5% SDS-PAGE and probed with an anti–rabbit PC1 antibody (a gift from Nabil G. Seidah, Clinical Research Institute of Montreal). For insulin receptor analysis, islet lysates were analyzed on 7.5% SDS-PAGE and probed with an anti–rabbit insulin receptor β-chain antibody (Santa Cruz Biotechnology). The full, uncut gels are shown in the supplemental material.
β cell ultrastructure.
Isolated islets were immersion-fixed in a solution of 2.5% glutaraldehyde, 2.0% PFA in 0.1 M sodium cacodylate buffer, pH 7.4, overnight at 4°C. The tissue was then postfixed in 1% osmium tetroxide in the same buffer for 2 hours at room temperature. Following osmium tetroxide postfixation, the samples were dehydrated in a graded ethanol series, then further dehydrated in propylene oxide and embedded in Epon epoxy resin. Samples were then sectioned for transmission electron microscopy (TEM) using a Leica UC6 Ultramicrotome and contrasted with Reynolds lead citrate and 8% uranyl acetate in 50% ethanol. Ultrathin sections were observed with a Philips CM120 electron microscope, and images were captured with a MegaView III side-mounted digital camera.
Islet proinsulin and mature insulin content analysis using mass spectrometry.
Islets were lysed by probe sonication in lysis buffer (50 mM Tris, pH 8; 4 M urea; phosphatase inhibitor tablet), and 30 mg of protein was used for each sample digest. AQUA QuantPro peptide standards (Thermo Scientific) for insulin [RGFFYTPK(13C615N2)S] and proinsulin [RGFFYTP(13C615N2)SRRE] were spiked into each digest at 1 ng and 100 fg per mg total protein. Samples were reduced with 5 mM DTT, alkylated with 15 mM iodoacetamide, and digested with Glu-C (1:50 enzyme/protein ratio) for 16 hours. Resultant peptides were desalted with Sep-Pak tC18 cartridges (Waters) and resuspended to a final concentration of 1 mg protein per 1 ml in 0.2% formic acid. Samples were loaded onto a 25-cm-long, 75-mm-diameter capillary column packed with 1.7-mm C18 particles in mobile phase A (0.2% formic acid, 5% DMSO in water). Peptides were eluted with mobile phase B (0.2% formic acid in acetonitrile) over a 100-minute gradient at a flow rate of 300 nl/min. Peptides were analyzed on an Orbitrap elite mass spectrometer with a collisional activation dissociation (ion trap CAD) method composed of an MS1 scan (at 30,000 resolution) followed by ion trap MS2 scans of the target peptide and AQUA peptide m/z. Target accumulation values were set to 1 × 10⁶ for MS1 and 4 × 10⁵ for MS2. Peptide identifications were confirmed by manual sequencing of spectra. Absolute quantitation was performed by normalization of analyte peak areas to respective standard peak areas.
Islet pulse-chase experiments.
Proinsulin biosynthesis and processing experiments were performed in islets recovered overnight in 11 mM glucose RPMI 1640 containing 10% FBS and antibiotics at 37°C. Batches of 100 islets were transferred into 1.5-ml tubes and washed with 0.5 ml of Krebs-Ringer bicarbonate HEPES (KRBH) containing 2.8 mM glucose. Islets were then pulse-radiolabeled for 30 minutes in 100 ml of 16.7 mM glucose KRBH containing 0.25 mCi of [35S]methionine. At the end of the pulse period, pulse medium was removed by centrifugation (800 g for 15 seconds), and islets were washed in 1 ml of 2.8 mM KRBH buffer and chased in the same medium containing 2 mM l-methionine for varying time. At the end of each chase period, the chase medium was removed by centrifugation (800 g for 15 seconds) and islets resuspended in 100 ml of lysis buffer (50 mM HEPES, pH 7.4, 1% Triton X-100 plus protease inhibitors) and sonicated in bath sonicator for 15 minutes. Islet lysates were centrifuged for 5 minutes at 10,000 g and supernatant collected. Islet lysates were then immunoprecipitated using anti–guinea pig insulin antibody and the IP product analyzed by 16.5%-7M urea gels. Gels were fixed in 10% acetic acid/25% isopropanol or methanol for 1 hour, treated with Amplify (NAMP100; GE Healthcare) for 30 minutes, dried, and exposed to Phosphor-screen (Amersham Biosciences) for at least a week. Labeled proinsulin and its conversion to mature insulin were detected using Typhoon PhosphoImager. The intensity of each band was quantified using ImageJ software.
Cell culture.
The glucose-responsive rat β cell line INS1 (832/13; a gift from Christopher Newgard, Duke University, Durham, NC) was cultured in RPMI 1640 medium containing 11 mM glucose supplemented with 10% heat-inactivated FBS, 2 mM l-glutamine, 1 mM sodium pyruvate, 10 mM HEPES, 100 U/ml of antibiotic-antimycotic, and 50 mM b-mercaptoethanol. Mouse MIN6 cells were maintained in DMEM containing 25 mM glucose supplemented with 15% FBS, 100 U/ml of penicillin, 100 mg/ml streptomycin, and 55 mM b-mercaptoethanol at 37°C and 5% CO2.
Plasmids.
The inducible myc-Sorcs1a expression vector was created by subcloning of the mouse C57BL/6J Sorcs1a cDNA into a pCDNA4TOMycHisA expression vector (Invitrogen). The luminal Sorcs1 plasmid (Lum-Sorcs1) was generated by subcloning of the VPS10 domain sequence including the leucine-rich region (3.3 kb) into a pcDNA4.6xHis (Invitrogen) vector.
Creation of stable cell lines.
To create tetracycline-inducible stable cells, linearized pCDNA4TOMycHisA-myc-Sorcs1a vector was transfected into INS1 832/13 cells with Lipofectamine 2000 and selected with zeocin. Lum-Sorcs1 stable cells were generated by transfection of linearized pcDNA4.6xHis-Lum-Sorcs1 vector and empty vector to MIN6 cells with Lipofectamine 2000 and selected with zeocin.
Cell immunofluorescence.
Cell monolayers were fixed with 4% PFA, washed with PBS containing 0.1% BSA and 0.1% sodium azide, permeabilized with 0.3% Triton X-100, blocked with 10% normal donkey serum, and incubated with guinea pig antibody against insulin (1:500; I-8510; Sigma-Aldrich), rabbit antibody against ER marker ERP72 (1:250; 5033; Cell Signaling), mouse antibody against cis-Golgi marker GM130 (1:250; 610823; BD), and mouse antibody against trans-Golgi network marker TGN38 (1:250; a gift from Katherine Howell, University of Colorado) (67, 68) or goat antibody against chromogranin B diluted in dilution buffer (1× PBS, 1% BSA, 1% normal donkey serum, 0.3% Triton X-100, and 0.01% sodium azide) and incubated at 4°C overnight. Cells were washed with wash buffer (0.1% BSA in PBS with 0.01% sodium azide) before the addition of fluorescent conjugated secondary antibodies and incubated for 1 hour at room temperature in the dark. Cells were then washed with TBS and allowed to air-dry in the dark. Staining was preserved and nuclei identified by addition of a drop of Vectashield with DAPI (H-1200; Vector Laboratories) before the addition of a cover slip. Images were acquired on a swept-field confocal microscope (Nikon Ti-E) equipped with a Roper CoolSnap HQ2 charge-coupled device (CCD) camera using a Nikon 60×, 1.4 numerical aperture Plan Apo oil objective lens. Acquisition parameters were controlled by Nikon Elements software. Sorcs1 colocalization with Rab5 and Rab7 was performed in cells infected with GFP-tagged Rab retrovirus. Fluorescently tagged Rab constructs (in the retroviral pBABE vector) were cotransfected with a plasmid expressing VSV-G into a 293GP packaging cell line to produce pseudotyped amphotropic retrovirus. Supernatant derived from transfected 293GP cells is used to infect INS1 832/13 cells stably expressing Sorcs1a in the presence of 10 mg/ml Polybrene. After infection, the cells were selected using 2 mg/ml puromycin before induction of Sorcs1a expression with doxycycline and immunofluorescence analysis.
Cell Western blotting.
Total protein extracts were obtained from cells using 1× cell signaling lysis buffer (50 mM Tris, pH 8; 1% NP-40; 150 mM NaCl; 1 mM EDTA) containing protease inhibitors (Roche) and 1 mM PMSF. For total insulin analysis, cell extracts were analyzed on 16.5% Tris-tricine-urea-SDS-PAGE under nonreducing conditions (70). Anti–guinea pig insulin primary antibodies that recognized both pro- and mature insulin were used to probe the PVDF membranes after gel transfer (Sigma-Aldrich). For total cathepsin B analysis, cell lysates were analyzed on 12.5% SDS-PAGE and probed with an anti–rabbit cathepsin B antibody (sc-13985; Santa Cruz Biotechnology). For insulin receptor and TGN38 analysis, cell lysates were analyzed on 7.5% SDS-PAGE and probed with an anti–rabbit insulin receptor b-chain antibody (sc-711; Santa Cruz Biotechnology) or anti–rabbit TGN38 antibody (T9826; Sigma-Aldrich). See complete uncut gels in the supplemental material.
Insulin secretion in MIN6.
MIN6 and Lum-Sorcs1 MIN6 cells were plated in 24-well plates. The night before secretion, fresh culture medium was placed on cells. The day of the secretion, cells were washed once in 1 ml KREB containing 3.57 mg/ml HEPES, 0.2% fatty acid–free BSA (Sigma-Aldrich), and 1.5 mM glucose. They were incubated for 2 hours in 0.5 ml of the same medium. Then the medium was changed to include 0.5 ml of either 1.5 mM glucose, 1.5 mM glucose with 40 mM KCl, 15 mM glucose, or 15 mM glucose with 40 mM KCl and incubated for 2 hours. After the 2-hour incubation, medium was removed, spun, and diluted 1:50 in PBS + 1% BSA for measurement via in-house insulin ELISA. Cells were lysed with 1 ml of 2% NP-40 lysis buffer containing 100 mM Tris-Cl, 300 mM NaCl, and protease inhibitors. DNA content was measured in straight lysates by Quant-iT PicoGreen (Invitrogen), and insulin content was measured in lysates diluted 1:500 in PBS + 1% BSA via in-house insulin ELISA.
Transient transfection with Lum-Sorcs1 plasmid and adenoviral infection with Ad-syncollin-dsRed5TIMER of INS 832/13 cells.
Seventy-five percent confluent INS1 832/13 cells cultured in 35 mm Poly-D-Lysine–coated glass-bottom FluoroDish (F035PDL; World Precision Instruments) were transiently transfected with 6 mg of plasmid containing the luminal domain of Sorcs1 or an empty vector using Lipofectamine 2000 (Invitrogen) for 6 hours in Opti-MEM media. At the end of the sixth hour, cells were infected for 2 hours with syncollin-dsRed5TIMER5 adenovirus and then cultured in compete medium for 36 hours. Cells were then examined by confocal microscopy after 30 minutes of exposure to 1.7 mM glucose, followed by 10 and 50 minutes of exposure to 16.7 mM glucose.
Cell MALDI/TOF analysis.
MALDI/TOF analysis was performed as previously described (69). Cell pellets were covered with matrix solution (7 mg/ml α-cyano-4-hydroxy-cinnamic acid in 50% acetonitrile, 0.05% TFA) and MALDI mass profiling of the cells was performed by Voyager DE-Pro mass spectrometer (Applied Biosystems) equipped with a nitrogen laser (337 nm) operating in positive-ion linear mode acquiring spectra in the mass range from m/z 2,000 to 10,000.
Statistics.
Statistical significance was determined with a 2-tailed Student’s t test. A P value of less than 0.05 was considered significant.
Study approval.
All protocols involving animals were approved by the University of Wisconsin-Madison IACUC.
Supplementary Material
Acknowledgments
This research was supported by NIDDK grants 58037, 66369, and 50610 (to C. Rhodes and A.D. Attie). M.A. Kebede was supported by an American Diabetes Association Mentor-Based Fellowship (7-11-MN-03). B.J. Floyd was supported by training grants T32DK007665 and T32GM008692. We thank Aaron Turkewitz for sharing his manuscript on his studies of Vps10 proteins in Tetrahymena before its publication. We thank Michele Solimena for his advice and suggestions. We thank Benjamin August from the University of Wisconsin electron microscopy facility for his expertise and help with islet electron microscopy. We also thank Laura Vanderploeg, University of Wisconsin Biochemistry Media Lab, for her tremendous help with assembly of the figures for the manuscript.
Footnotes
Conflict of interest: The authors have declared that no conflict of interest exists.
Reference information:J Clin Invest. 2014;124(10):4240–4256. doi:10.1172/JCI74072.
References
- 1.Groop L, Lyssenko V. Genetic basis of β-cell dysfunction in man. Diabetes Obes Metab. 2009;11(suppl 4):149–158. doi: 10.1111/j.1463-1326.2009.01117.x. [DOI] [PubMed] [Google Scholar]
- 2.Steiner DF. The proprotein convertases. Curr Opin Chem Biol. 1998;2(1):31–39. doi: 10.1016/S1367-5931(98)80033-1. [DOI] [PubMed] [Google Scholar]
- 3.Seidah NG, Prat A. The biology and therapeutic targeting of the proprotein convertases. Nat Rev Drug Discov. 2012;11(5):367–383. doi: 10.1038/nrd3699. [DOI] [PubMed] [Google Scholar]
- 4.Vindrola O, Lindberg I. Release of the prohormone convertase PC1 from AtT-20 cells. Neuropeptides. 1993;25(2):151–160. doi: 10.1016/0143-4179(93)90096-S. [DOI] [PubMed] [Google Scholar]
- 5.Benjannet S, Reudelhuber T, Mercure C, Rondeau N, Chretien M, Seidah NG. Proprotein conversion is determined by a multiplicity of factors including convertase processing, substrate specificity, and intracellular environment. Cell type-specific processing of human prorenin by the convertase PC1. J Biol Chem. 1992;267(16):11417–11423. [PubMed] [Google Scholar]
- 6.Clee SM, et al. Positional cloning of Sorcs1, a type 2 diabetes quantitative trait locus. Nat Genet. 2006;38(6):688–693. doi: 10.1038/ng1796. [DOI] [PubMed] [Google Scholar]
- 7.Goodarzi MO, et al. SORCS1: a novel human type 2 diabetes susceptibility gene suggested by the mouse. Diabetes. 2007;56(7):1922–1929. doi: 10.2337/db06-1677. [DOI] [PubMed] [Google Scholar]
- 8.Lazar J, et al. SORCS1 contributes to the development of renal disease in rats and humans. Physiol Genomics. 2013;45(16):720–728. doi: 10.1152/physiolgenomics.00089.2013. [DOI] [PMC free article] [PubMed] [Google Scholar]
- 9.Paterson AD, et al. A genome-wide association study identifies a novel major locus for glycemic control in type 1 diabetes, as measured by both A1C and glucose. Diabetes. 2010;59(2):539–549. doi: 10.2337/db09-0653. [DOI] [PMC free article] [PubMed] [Google Scholar]
- 10.Marcusson EG, Horazdovsky BF, Cereghino JL, Gharakhanian E, Emr SD. The sorting receptor for yeast vacuolar carboxypeptidase Y is encoded by the VPS10 gene. Cell. 1994;77(4):579–586. doi: 10.1016/0092-8674(94)90219-4. [DOI] [PubMed] [Google Scholar]
- 11.Hermey G, Keat SJ, Madsen P, Jacobsen C, Petersen CM, Gliemann J. Characterization of sorCS1, an alternatively spliced receptor with completely different cytoplasmic domains that mediate different trafficking in cells. J Biol Chem. 2003;278(9):7390–7396. doi: 10.1074/jbc.M210851200. [DOI] [PubMed] [Google Scholar]
- 12.Tall AR, Ai D. Sorting out sortilin. Circ Res. 2011;108(2):158–160. doi: 10.1161/RES.0b013e31820d7daa. [DOI] [PubMed] [Google Scholar]
- 13.Willnow TE, Kjølby M, Nykjaer A. Sortilins: new players in lipoprotein metabolism. Curr Opin Lipidol. 2011;22(2):79–85. doi: 10.1097/MOL.0b013e3283416f2b. [DOI] [PubMed] [Google Scholar]
- 14.Nykjaer A, Willnow TE. Sortilin: a receptor to regulate neuronal viability and function. Trends Neurosci. 2012;35(4):261–270. doi: 10.1016/j.tins.2012.01.003. [DOI] [PubMed] [Google Scholar]
- 15.Canuel M, Korkidakis A, Konnyu K, Morales CR. Sortilin mediates the lysosomal targeting of cathepsins D and H. Biochem Biophys Res Commun. 2008;373(2):292–297. doi: 10.1016/j.bbrc.2008.06.021. [DOI] [PubMed] [Google Scholar]
- 16.Shi J, Kandror KV. The luminal Vps10p domain of sortilin plays the predominant role in targeting to insulin-responsive Glut4-containing vesicles. J Biol Chem. 2007;282(12):9008–9016. doi: 10.1074/jbc.M608971200. [DOI] [PubMed] [Google Scholar]
- 17.Musunuru K, et al. From noncoding variant to phenotype via SORT1 at the 1p13 cholesterol locus. Nature. 2010;466(7307):714–719. doi: 10.1038/nature09266. [DOI] [PMC free article] [PubMed] [Google Scholar]
- 18.Strong A, et al. Hepatic sortilin regulates both apolipoprotein B secretion and LDL catabolism. J Clin Invest. 2012;122(8):2807–2816. doi: 10.1172/JCI63563. [DOI] [PMC free article] [PubMed] [Google Scholar]
- 19.Kjolby M, et al. Sort1, encoded by the cardiovascular risk locus 1p13.3, is a regulator of hepatic lipoprotein export. Cell Metab. 2010;12(3):213–223. doi: 10.1016/j.cmet.2010.08.006. [DOI] [PubMed] [Google Scholar]
- 20.Nykjaer A, et al. Sortilin is essential for proNGF-induced neuronal cell death. Nature. 2004;427(6977):843–848. doi: 10.1038/nature02319. [DOI] [PubMed] [Google Scholar]
- 21.Teng HK, et al. ProBDNF induces neuronal apoptosis via activation of a receptor complex of p75NTR and sortilin. J Neurosci. 2005;25(22):5455–5463. doi: 10.1523/JNEUROSCI.5123-04.2005. [DOI] [PMC free article] [PubMed] [Google Scholar]
- 22.Vaegter CB, et al. Sortilin associates with Trk receptors to enhance anterograde transport and neurotrophin signaling. Nat Neurosci. 2011;14(1):54–61. doi: 10.1038/nn.2689. [DOI] [PMC free article] [PubMed] [Google Scholar]
- 23.Willnow TE, Petersen CM, Nykjaer A. VPS10P-domain receptors — regulators of neuronal viability and function. Nat Rev Neurosci. 2008;9(12):899–909. doi: 10.1038/nrg2454. [DOI] [PubMed] [Google Scholar]
- 24.Chanat E, Huttner WB. Milieu-induced, selective aggregation of regulated secretory proteins in the trans-Golgi network. J Cell Biol. 1991;115(6):1505–1519. doi: 10.1083/jcb.115.6.1505. [DOI] [PMC free article] [PubMed] [Google Scholar]
- 25.Marsh BJ, et al. Regulated autophagy controls hormone content in secretory-deficient pancreatic endocrine β-cells. Mol Endocrinol. 2007;21(9):2255–2269. doi: 10.1210/me.2007-0077. [DOI] [PubMed] [Google Scholar]
- 26.Cao M, et al. PICK1 and ICA69 control insulin granule trafficking and their deficiencies lead to impaired glucose tolerance. PLoS Biol. 2013;11(4):e1001541. doi: 10.1371/journal.pbio.1001541. [DOI] [PMC free article] [PubMed] [Google Scholar]
- 27.Holst B, et al. PICK1 deficiency impairs secretory vesicle biogenesis and leads to growth retardation and decreased glucose tolerance. PLoS Biol. 2013;11(4):e1001542. doi: 10.1371/journal.pbio.1001542. [DOI] [PMC free article] [PubMed] [Google Scholar]
- 28.Huang XF, Arvan P. Formation of the insulin-containing secretory granule core occurs within immature β-granules. J Biol Chem. 1994;269(33):20838–20844. [PubMed] [Google Scholar]
- 29.Briguglio JS, Kumar S, Turkewitz AP. Lysosomal sorting receptors are essential for desnse core vesicle biogenesis in Tetrahymena. J Cell Biol. 2013;203(3):537–550. doi: 10.1083/jcb.201305086. [DOI] [PMC free article] [PubMed] [Google Scholar]
- 30.Sloves PJ, et al. Toxoplasma sortilin-like receptor regulates protein transport and is essential for apical secretory organelle biogenesis and host infection. Cell Host Microbe. 2012;11(5):515–527. doi: 10.1016/j.chom.2012.03.006. [DOI] [PubMed] [Google Scholar]
- 31.Peyot ML, et al. β-Cell failure in diet-induced obese mice stratified according to body weight gain: secretory dysfunction and altered islet lipid metabolism without steatosis or reduced β-cell mass. Diabetes. 2010;59(9):2178–2187. doi: 10.2337/db09-1452. [DOI] [PMC free article] [PubMed] [Google Scholar]
- 32.Chimienti F, Devergnas S, Favier A, Seve M. Identification and cloning of a β-cell-specific zinc transporter, ZnT-8, localized into insulin secretory granules. Diabetes. 2004;53(9):2330–2337. doi: 10.2337/diabetes.53.9.2330. [DOI] [PubMed] [Google Scholar]
- 33.Marselli L, et al. Are we overestimating the loss of β cells in type 2 diabetes? Diabetologia. 2014;57(2):362–365. doi: 10.1007/s00125-013-3098-3. [DOI] [PubMed] [Google Scholar]
- 34.Roquemore EP, Banting G. Efficient trafficking of TGN38 from the endosome to the trans-Golgi network requires a free hydroxyl group at position 331 in the cytosolic domain. Mol Biol Cell. 1998;9(8):2125–2144. doi: 10.1091/mbc.9.8.2125. [DOI] [PMC free article] [PubMed] [Google Scholar]
- 35.Rhodes CJ, Lincoln B, Shoelson SE. Preferential cleavage of des-31,32-proinsulin over intact proinsulin by the insulin secretory granule type II endopeptidase. Implication of a favored route for prohormone processing. J Biol Chem. 1992;267(32):22719–22727. [PubMed] [Google Scholar]
- 36.Giordano T, Brigatti C, Podini P, Bonifacio E, Meldolesi J, Malosio ML. β cell chromogranin B is partially segregated in distinct granules and can be released separately from insulin in response to stimulation. Diabetologia. 2008;51(6):997–1007. doi: 10.1007/s00125-008-0980-5. [DOI] [PubMed] [Google Scholar]
- 37.Hays LB, et al. Intragranular targeting of syncollin, but not a syncollinGFP chimera, inhibits regulated insulin exocytosis in pancreatic β-cells. J Endocrinol. 2005;185(1):57–67. doi: 10.1677/joe.1.05934. [DOI] [PubMed] [Google Scholar]
- 38.Ma L, et al. Direct imaging shows that insulin granule exocytosis occurs by complete vesicle fusion. Proc Natl Acad Sci U S A. 2004;101(25):9266–9271. doi: 10.1073/pnas.0403201101. [DOI] [PMC free article] [PubMed] [Google Scholar]
- 39.Wasle B, Hays LB, Rhodes CJ, Edwardson JM. Syncollin inhibits regulated corticotropin secretion from AtT-20 cells through a reduction in the secretory vesicle population. Biochem J. 2004;380(pt 3):897–905. doi: 10.1042/BJ20031726. [DOI] [PMC free article] [PubMed] [Google Scholar]
- 40.Duncan RR, et al. Functional and spatial segregation of secretory vesicle pools according to vesicle age. Nature. 2003;422(6928):176–180. doi: 10.1038/nature01389. [DOI] [PubMed] [Google Scholar]
- 41.Gold G, Gishizky ML, Grodsky GM. Evidence that glucose “marks” β cells resulting in preferential release of newly synthesized insulin. Science. 1982;218(4567):56–58. doi: 10.1126/science.6181562. [DOI] [PubMed] [Google Scholar]
- 42.Halban PA. Differential rates of release of newly synthesized and of stored insulin from pancreatic islets. Endocrinology. 1982;110(4):1183–1188. doi: 10.1210/endo-110-4-1183. [DOI] [PubMed] [Google Scholar]
- 43.Ivanova A, et al. Age-dependent labeling and imaging of insulin secretory granules. Diabetes. 2013;62(11):3687–3696. doi: 10.2337/db12-1819. [DOI] [PMC free article] [PubMed] [Google Scholar]
- 44.Michael DJ, Xiong W, Geng X, Drain P, Chow RH. Human insulin vesicle dynamics during pulsatile secretion. Diabetes. 2007;56(5):1277–1288. doi: 10.2337/db06-0367. [DOI] [PubMed] [Google Scholar]
- 45.Arvan P, Castle D. Sorting and storage during secretory granule biogenesis: looking backward and looking forward. Biochem J. 1998;332(pt 3):593–610. doi: 10.1042/bj3320593. [DOI] [PMC free article] [PubMed] [Google Scholar]
- 46.Arvan P, Halban PA. Sorting ourselves out: seeking consensus on trafficking in the β-cell. Traffic. 2004;5(1):53–61. doi: 10.1111/j.1600-0854.2004.00152.x. [DOI] [PubMed] [Google Scholar]
- 47.Kögel T, Gerdes HH. Maturation of secretory granules. Results Probl Cell Differ. 2010;50:1–20. doi: 10.1007/400_2009_31. [DOI] [PubMed] [Google Scholar]
- 48.Tooze SA. Biogenesis of secretory granules in the trans-Golgi network of neuroendocrine and endocrine cells. Biochim Biophys Acta. 1998;1404(1–2):231–244. doi: 10.1016/S0167-4889(98)00059-7. [DOI] [PMC free article] [PubMed] [Google Scholar]
- 49.Asensio CS, Sirkis DW, Edwards RH. RNAi screen identifies a role for adaptor protein AP-3 in sorting to the regulated secretory pathway. J Cell Biol. 2010;191(6):1173–1187. doi: 10.1083/jcb.201006131. [DOI] [PMC free article] [PubMed] [Google Scholar]
- 50.Edwards SL, Charlie NK, Richmond JE, Hegermann J, Eimer S, Miller KG. Impaired dense core vesicle maturation in Caenorhabditis elegans mutants lacking Rab2. J Cell Biol. 2009;186(6):881–895. doi: 10.1083/jcb.200902095. [DOI] [PMC free article] [PubMed] [Google Scholar]
- 51.Holst B, et al. PICK1 deficiency impairs secretory vesicle biogenesis and leads to growth retardation and decreased glucose tolerance. PLoS Biol. 2013;11(4):e1001542. doi: 10.1371/journal.pbio.1001542. [DOI] [PMC free article] [PubMed] [Google Scholar]
- 52.Bankaitis VA, Johnson LM, Emr SD. Isolation of yeast mutants defective in protein targeting to the vacuole. Proc Natl Acad Sci U S A. 1986;83(23):9075–9079. doi: 10.1073/pnas.83.23.9075. [DOI] [PMC free article] [PubMed] [Google Scholar]
- 53.Lefrancois S, Zeng J, Hassan AJ, Canuel M, Morales CR. The lysosomal trafficking of sphingolipid activator proteins (SAPs) is mediated by sortilin. EMBO J. 2003;22(24):6430–6437. doi: 10.1093/emboj/cdg629. [DOI] [PMC free article] [PubMed] [Google Scholar]
- 54.Coutinho MF, Prata MJ, Alves S. A shortcut to the lysosome: the mannose-6-phosphate-independent pathway. Mol Genet Metab. 2012;107(3):257–266. doi: 10.1016/j.ymgme.2012.07.012. [DOI] [PubMed] [Google Scholar]
- 55.Braulke T, Bonifacino JS. Sorting of lysosomal proteins. Biochim Biophys Acta. 2009;1793(4):605–614. doi: 10.1016/j.bbamcr.2008.10.016. [DOI] [PubMed] [Google Scholar]
- 56.Evans SF, et al. Neuronal brain-derived neurotrophic factor is synthesized in excess, with levels regulated by sortilin-mediated trafficking and lysosomal degradation. J Biol Chem. 2011;286(34):29556–29567. doi: 10.1074/jbc.M111.219675. [DOI] [PMC free article] [PubMed] [Google Scholar]
- 57.Kieffer TJ, Heller RS, Leech CA, Holz GG, Habener JF. Leptin suppression of insulin secretion by the activation of ATP-sensitive K+ channels in pancreatic β-cells. Diabetes. 1997;46(6):1087–1093. doi: 10.2337/diab.46.6.1087. [DOI] [PMC free article] [PubMed] [Google Scholar]
- 58.Seufert J, Kieffer TJ, Habener JF. Leptin inhibits insulin gene transcription and reverses hyperinsulinemia in leptin-deficient ob/ob mice. Proc Natl Acad Sci U S A. 1999;96(2):674–679. doi: 10.1073/pnas.96.2.674. [DOI] [PMC free article] [PubMed] [Google Scholar]
- 59.Sirkis DW, Edwards RH, Asensio CS. Widespread dysregulation of peptide hormone release in mice lacking adaptor protein AP-3. PLoS Genet. 2013;9(9):e1003812. doi: 10.1371/journal.pgen.1003812. [DOI] [PMC free article] [PubMed] [Google Scholar]
- 60.Suckow AT, Craige B, Faundez V, Cain WJ, Chessler SD. An AP-3-dependent mechanism drives synaptic-like microvesicle biogenesis in pancreatic islet β-cells. Am J Physiol Endocrinol Metab. 2010;299(1):E23–E32. doi: 10.1152/ajpendo.00664.2009. [DOI] [PMC free article] [PubMed] [Google Scholar]
- 61.He Y, Fang Z, Yu G. Sortilin-related VPS10 domain containing receptor 1 and Alzheimer’s disease-associated allelic variations preferentially exist in female or type 2 diabetes mellitus patients in southern Han Chinese. Psychogeriatrics. 2012;12(4):215–225. doi: 10.1111/j.1479-8301.2012.00405.x. [DOI] [PubMed] [Google Scholar]
- 62.Lane RF, et al. Diabetes-associated SorCS1 regulates Alzheimer’s amyloid-β metabolism: evidence for involvement of SorL1 and the retromer complex. J Neurosci. 2010;30(39):13110–13115. doi: 10.1523/JNEUROSCI.3872-10.2010. [DOI] [PMC free article] [PubMed] [Google Scholar]
- 63.Reitz C, et al. SORCS1 alters amyloid precursor protein processing and variants may increase Alzheimer’s disease risk. Ann Neurol. 2011;69(1):47–64. doi: 10.1002/ana.22308. [DOI] [PMC free article] [PubMed] [Google Scholar]
- 64.Xu W, et al. The genetic variation of SORCS1 is associated with late-onset Alzheimer’s disease in Chinese Han population. PLoS One. 2013;8(5):e63621. doi: 10.1371/journal.pone.0063621. [DOI] [PMC free article] [PubMed] [Google Scholar]
- 65.Rabaglia ME, Gray-Keller MP, Frey BL, Shortreed MR, Smith LM, Attie AD. α-Ketoisocaproate-induced hypersecretion of insulin by islets from diabetes-susceptible mice. Am J Physiol Endocrinol Metab. 2005;289(2):E218–E224. doi: 10.1152/ajpendo.00573.2004. [DOI] [PubMed] [Google Scholar]
- 66.Lemaire K, et al. Insulin crystallization depends on zinc transporter ZnT8 expression, but is not required for normal glucose homeostasis in mice. Proc Natl Acad Sci U S A. 2009;106(35):14872–14877. doi: 10.1073/pnas.0906587106. [DOI] [PMC free article] [PubMed] [Google Scholar]
- 67.Reaves B, Horn M, Banting G. TGN38/41 recycles between the cell surface and the TGN: brefeldin A affects its rate of return to the TGN. Mol Biol Cell. 1993;4(1):93–105. doi: 10.1091/mbc.4.1.93. [DOI] [PMC free article] [PubMed] [Google Scholar]
- 68.Stanley KK, Howell KE. TGN38/41: a molecule on the move. Trends Cell Biol. 1993;3(8):252–255. doi: 10.1016/0962-8924(93)90046-4. [DOI] [PubMed] [Google Scholar]
- 69.Stewart KW, Phillips AR, Whiting L, Jullig M, Middleditch MJ, Cooper GJ. A simple and rapid method for identifying and semi-quantifying peptide hormones in isolated pancreatic islets by direct-tissue matrix-assisted laser desorption ionization time-of-flight mass spectrometry. Rapid Commun Mass Spectrom. 2011;25(22):3387–3395. doi: 10.1002/rcm.5239. [DOI] [PubMed] [Google Scholar]
- 70.Liu M, et al. Mutant INS-gene induced diabetes of youth: proinsulin cysteine residues impose dominant-negative inhibition on wild-type proinsulin transport. PLoS One. 2010;5(10):e13333. doi: 10.1371/journal.pone.0013333. [DOI] [PMC free article] [PubMed] [Google Scholar]
Associated Data
This section collects any data citations, data availability statements, or supplementary materials included in this article.