

Abstract
A study of the use of short-stay hospitals in PSRO areas by Medicare enrollees aged 65 and over for the period 1974 through 1977 revealed that discharge rates increased, average length of stay (ALOS) decreased, and days-of-care rates remained relatively constant in nearly all of the PSRO areas. The data show large variations in hospital use in PSRO areas within States and HEW regions, and suggest that factors within the area are critical determinants of hospital utilization. This study presents important implications for PSRO program policy for it suggests that factors other than physician and hospital behavior should also be considered when setting objectives for reducing misutilization and improving the quality of health care.
For the growing segment of the population aged 65 and over, Medicare is by far the greatest source of protection against the costs of hospital care. An estimated 95 to 98 percent of this age group are covered by Medicare. In 1975 persons aged 65 years and over comprised 10.7 percent of the population, but accounted for 20 percent of total discharges and 33 percent of all days of care from short-stay hospitals, no doubt reflecting their greater health care needs.
Since the Medicare program began in 1966, striking variations in hospital use have been noted, raising questions about quality of care and appropriate levels of hospital use. Responding to concern about the sharp rise in hospital expenses and the quality of federally reimbursed care, the Congress set up, through the 1972 Social Security Amendments, the Professional Standards Review Organization (PSRO) program to monitor the quality of federally funded care and to assure its delivery in an efficient and economical manner. This law designated 203 PSRO areas throughout the Nation and mandated each to develop a PSRO to review care provided to Medicare, Medicaid, and Maternal and Child Health program patients.
This article discusses geographic variations in hospital use by Medicare enrollees aged 65 and over in PSRO areas during the period 1974 through 1977. Possible causal factors influencing these variations in hospital use are analyzed.
Knowledge of the extent and causes of variations in hospital use among PSRO areas is vital to the PSROs themselves and to others involved in the PSRO effort. It is basic to the setting of program objectives and to program evaluation. It is also of great interest to health care researchers and administrators for it illustrates the range of options in the way health care can be provided. Comparison of low and high use PSRO areas raises questions about the cost and appropriateness of hospital care and about access and equity in its delivery.
As the data will illustrate, in some PSRO areas, Medicare is paying for a volume of care (days of care per 1,000 enrollees) more than twice that in other areas. Some areas have a rate of hospitalization (discharges per 1,000 enrollees) twice that of others. In these PSRO areas, a significantly larger part of the area's Medicare enrollees are exposed to the benefits and risks of hospital care. In some areas, the average length of stay is considerably more than twice the average stay in other areas. These differences are focused upon in considerable detail.
Although the data presented here are aggregated by PSRO area, the purpose of this report is not to evaluate the effects of the PSRO program upon hospital use. Rather, these data are primarily intended to provide baseline and statistical information for both utilization review and health planning purposes and to furnish overall analysis of basic utilization trends. 1/
Data Sources
The figures presented here were developed from the Health Care Financing Administration's Medicare Statistical System. Data were derived primarily from three centrally maintained files: the master enrollment file, the hospital bill file, and the provider of service file. (For a fuller discussion of the data sources see the technical note, end of article.) This study is confined to Medicare enrollees; similar data are not yet available for Medicaid and Maternal and Child Health program enrollees.
Methodology
Traditionally, measures of hospital use by Medicare enrollees have been based on the experience of enrollees living in a defined area. These measures are referred to as beneficiary based because they depend solely upon where the beneficiary lives; the location of the hospital stay does not enter into the calculation. With the implementation of major areawide programs such as the PSRO and health planning 2/ programs, it was necessary to develop new measures based upon use in a specific group of hospitals located in a defined area. These rates are referred to as hospital based.
Hospital-based rates are constructed by including in the numerator all discharges or days of care which occur in a specific group of hospitals and including in the denominator the beneficiary population-at-risk for care in the group of hospitals.
The denominator used for beneficiary-based rates--the number of beneficiaries residing in an area--is not appropriate for hospital-based rates because some residents of an area use hospitals outside the area and some nonresidents use hospitals in the area.
The following table indicates that in 1977 for 21.8 percent of the PSRO areas, 20 percent or more of residents' hospital stays occurred outside their PSRO area.
| Percentage of discharges of residents of a PSRO area occurring outside the PSRO Area | Distribution of PSRO areas (percent) | |
|---|---|---|
|
|
|
|
| 0-9 | 27.6 | |
| 10-19 | 50.6 | |
| 20-29 | 15.6 | 21.8 |
| 30-39 | 4.2 | |
| 40-49 | 1.0 | |
| 50-59 | 1.0 | |
From the opposite perspective of patient flow, nonresidents come into a PSRO area for hospital services. The distribution of PSRO areas by the percentage of discharges that were for nonresidents in 1977 is given below:
| Percentage of discharges in the PSRO area for nonresidents | Distribution of PSRO areas (percent) | |
|---|---|---|
|
|
|
|
| 0-9 | 34.9 | |
| 10-19 | 47.4 | |
| 20-29 | 13.5 | 17.6 |
| 30-39 | 3.1 | |
| 40-49 | .5 | |
| 50-59 | .5 | |
The data indicate that in 17.6 percent of the PSRO areas, 20 percent or more of the hospital stays were for nonresidents. These facts led to the development of techniques to account for patient migration. The method used for this study estimates the number of beneficiaries-at-risk in a given PSRO area by allocating portions of Medicare enrollment from all PSRO areas based upon each PSRO's contribution to patient load in the given PSRO area. This method is an adaptation of one proposed by Bailey, 3/ which estimated the population-at-risk for a selected group of hospitals. The methodology developed for PSRO areas is presented in equation 1 below.
| Equation (1) |
where Ei = total number of Medicare beneficiaries-at-risk in the ith PSRO area
dij = number of discharges from hospitals in the ith PSRO area of patients who resided in the jth PSRO area
Dj = total number of discharges of patients who resided in the jth PSRO area
ej = Medicare enrollment in the jth PSRO area
n = total number of PSRO areas under consideration
(For illustration of this methodology and a discussion of its limitations, see the technical note at the end of this article.)
Findings
To provide background for the findings in this study, a summary of national trends in hospital use by Medicare beneficiaries for the period 1967 through 1977 is presented. Using the methodology described above, data are presented for (1) PSRO area trends, 1974 through 1977, (2) a cross-sectional analysis of Medicare utilization by PSRO area, and (3) correlation and regression analysis of the relationships between utilization and area characteristics.
National Trends, 1967 through 1977
During the period 1967-77, the discharge rate for Medicare patients in the Nation increased 28 percent, rising from 271 discharges per 1,000 enrollees in 1967 to 346 per 1,000 in 1977 (See fig. 1.)
Figure 1. U.S. Discharge rates, ALOS, and days-of-care rates for beneficiaries aged 65 and over, 1967-77.

Nationally, this rise in the discharge rate was offset by an opposite trend in the ALOS. As indicated in figure 1, ALOS was 13.8 days in 1967 and declined to 10.9 days by 1977. As a result of these opposing trends, the days-of-care rate has changed little over the 11-year interval, registering 3,740 days of care per 1,000 enrollees in 1967 and 3,767 in 1977. It should be noted, however, that during this period new technologies and services were introduced and the intensity and quantity of services changed. Thus, the “nature” of a day of care has changed over this period.
PSRO Area Trends, 1974 through 1977
The hospital-based measures generated for PSRO areas during 1974 through 1977 are listed within their HEW regions in table 1 (at end of article). 4/ (For boundaries of the 10 HEW regions, see fig. 2.) The national pattern of an increasing discharge rate and a decreasing ALOS was followed by nearly all PSRO areas during the period 1974-77. Figure 3 summarizes these changes and displays the distribution of PSRO areas by the percent change in these utilization measures. For the discharge rate, most of the PSRO areas are to the right of the “no change” or zero point of the horizontal axis, which illustrates that the discharge rate increased in most PSRO areas during this period. The figure shows that for 31 percent of the PSRO areas the discharge rate increased 5 to 7 percent and, for 23 percent of the PSRO areas, the discharge rate rose 8 to 10 percent.
TABLE 1. Hospital-based measures of short-stay hospitals use adjusted for patient origin, for Medicare beneficiaries, aged 65 and over, by PSRO area, State, and region, 1974-77.
| Region, State, and PSRO | Discharge rate (Per 1,000 enrollees) | Percent Change | Average length of stay (Days) | Percent Change | Days of care rate (Per 1,000 enrollees) | Percent Change | |||||||||
|---|---|---|---|---|---|---|---|---|---|---|---|---|---|---|---|
|
| |||||||||||||||
| 1974 | 1975 | 1976 | 1977 | 1974-77 | 1974 | 1975 | 1976 | 1977 | 1974-77 | 1974 | 1975 | 1976 | 1977 | 1974-77 | |
| ALL REGIONS | 326 | 330 | 341 | 346 | 6.1 | 11.6 | 11.4 | 11.2 | 10.9 | - 6.0 | 3,777 | 3,761 | 3,817 | 3,767 | - 0.3 |
|
|
|||||||||||||||
| BOSTON REGION | 299 | 302 | 316 | 320 | 7.0 | 12.6 | 12.4 | 12.3 | 12.0 | - 4.8 | 3,772 | 3,748 | 3,884 | 3,834 | l.6 |
|
|
|||||||||||||||
| Connecticut | 269 | 273 | 281 | 286 | 6.3 | 12.4 | 12.2 | 12.0 | 11.6 | - 6.5 | 3.334 | 3,328 | 3,368 | 3.315 | - 0.6 |
|
|
|||||||||||||||
| 1 Fairfield County | 279 | 283 | 299 | 307 | 10.0 | 12.9 | 12.6 | 12.4 | 12.1 | - 6.2 | 3,594 | 3,571 | 3,706 | 3,717 | 3.4 |
| 2 Area II | 258 | 260 | 265 | 269 | 4.3 | 12.6 | 12.5 | 12.3 | 11.9 | - 5.6 | 3,246 | 3,254 | 3,256 | 3,205 | - 1.3 |
| 3 Hartford Country | 270 | 275 | 283 | 287 | 6.3 | 12.5 | 12.2 | 12.1 | 11.6 | - 7.2 | 3,377 | 3,357 | 3,429 | 3,331 | - 1.4 |
| 4 Eastern Connecticut | 275 | 278 | 280 | 284 | 3.3 | 11.1 | 10.8 | 10.3 | 10.0 | - 9.9 | 3,047 | 3,005 | 2,888 | 2,841 | - 6.8 |
| Maine | 323 | 322 | 340 | 345 | 6.8 | 10.6 | 10.3 | 10.2 | 10.1 | - 4.7 | 3,422 | 3,315 | 3,466 | 3.479 | 1.7 |
|
|
|||||||||||||||
| Massachusetts | 307 | 309 | 325 | 329 | 7.2 | 13.5 | 13.4 | 13.3 | 13.1 | - 3.0 | 4.141 | 4,146 | 4,320 | 4,311 | 4.1 |
|
|
|||||||||||||||
| New Hampshire | 316 | 316 | 330 | 332 | 5.1 | 10.9 | 10.5 | 10.3 | 10.0 | - 8.3 | 3,446 | 3,320 | 3,397 | 3,321 | - 3.6 |
|
|
|||||||||||||||
| Rhode Island | 276 | 281 | 295 | 297 | 7.6 | 13.1 | 12.1 | 11.8 | 11.6 | -11.5 | 3,618 | 3,396 | 3,484 | 3,443 | - 4.8 |
|
|
|||||||||||||||
| Vermont | 348 | 358 | 373 | 367 | 5.5 | 10.9 | 10.6 | 11.0 | 10.8 | - 0.9 | 3,792 | 3,793 | 4,101 | 3,960 | 4.4 |
|
|
|||||||||||||||
| NEW YORK REGION | 272 | 278 | 290 | 296 | 8.8 | 15.3 | 15.3 | 15.1 | 14.4 | - 5.9 | 4,156 | 4,260 | 4,377 | 4,266 | 2.6 |
|
|
|||||||||||||||
| New Jersey | 273 | 280 | 291 | 299 | 9.5 | 13.9 | 14.1 | 13.9 | 13.8 | - 0.7 | 3,799 | 3,943 | 4,050 | 4,132 | 8.8 |
|
|
|||||||||||||||
| 1 Area I | 294 | 298 | 310 | 314 | 6.8 | 13.2 | 13.5 | 13.0 | 13.1 | - 0.8 | 3,881 | 4,029 | 4,027 | 4,114 | 6.0 |
| 2 Passaic Valley | 265 | 264 | 272 | 286 | 7.9 | 13.5 | 13.6 | 12.8 | 12.8 | - 5.2 | 3,574 | 3,583 | 3,477 | 3,657 | 2.3 |
| 3 Bergen County | 258 | 265 | 271 | 283 | 9.7 | 14.8 | 14.9 | 15.0 | 15.2 | 2.7 | 3,824 | 3,944 | 4,071 | 4,303 | 12.5 |
| 4 Essex Physicians Review | 290 | 296 | 307 | 320 | 10.3 | 14.8 | 14.6 | 14.4 | 14.1 | - 4.7 | 4,284 | 4,321 | 4,423 | 4,504 | 5.1 |
| 5 Hudson County | 262 | 275 | 293 | 308 | 17.6 | 15.8 | 15.6 | 15.3 | 15.3 | - 3.2 | 4,136 | 4,282 | 4,486 | 4,707 | 13.8 |
| 6 Union County | 276 | 278 | 296 | 301 | 9.1 | 13.1 | 13.5 | 13.2 | 13.0 | - 0.8 | 3,610 | 3,751 | 3,910 | 3,911 | 8.3 |
| 7 Area VII | 267 | 275 | 282 | 288 | 7.9 | 13.2 | 13.6 | 13.7 | 13.5 | 2.3 | 3,529 | 3,741 | 3,859 | 3,885 | 10.1 |
| 8 Southern New Jersey | 276 | 283 | 301 | 305 | 10.5 | 13.5 | 13.8 | 13.9 | 13.8 | 2.2 | 3,724 | 3,907 | 4,184 | 4,204 | 12.9 |
| New York | 276 | 283 | 295 | 303 | 9.8 | 16.0 | 16.1 | 15.9 | 15.0 | - 6.2 | 4,411 | 4.563 | 4,693 | 4.542 | 3.0 |
|
|
|||||||||||||||
| 1 Erie Region | 287 | 299 | 312 | 317 | 10.5 | 17.1 | 16.9 | 16.6 | 16.1 | - 3.8 | 4,915 | 5,044 | 5,174 | 5,108 | 3.9 |
| 2 Genesee Region | 278 | 287 | 305 | 303 | 9.0 | 13.1 | 13.1 | 13.1 | 12.9 | - 1.5 | 3,636 | 3,761 | 3,998 | 3,906 | 7.4 |
| 3 Central New York | 316 | 319 | 327 | 331 | 4.7 | 13.4 | 13.3 | 13.4 | 13.0 | - 3.0 | 4,234 | 4,240 | 4,375 | 4,303 | 1.6 |
| 4 Five-County Organization | 302 | 311 | 322 | 326 | 7.9 | 14.5 | 13.7 | 14.1 | 13.4 | - 7.6 | 4,380 | 4,257 | 4,535 | 4,365 | - 0.3 |
| 5 Adirondack | 357 | 350 | 365 | 377 | 5.6 | 14.8 | 14.6 | 14.6 | 13.6 | - 8.1 | 5,283 | 5,113 | 5,334 | 5,123 | - 3.0 |
| 6 Area VI | 294 | 301 | 312 | 316 | 7.5 | 14.0 | 14.2 | 14.4 | 14.6 | 4.3 | 4,109 | 4,274 | 4,488 | 4,616 | 12.3 |
| 7 Eastern New York | 305 | 312 | 324 | 331 | 8.5 | 15.0 | 15.0 | 14.9 | 14.3 | - 4.7 | 4,573 | 4,685 | 4,833 | 4,730 | 3.4 |
| 8 Area 8 | 302 | 313 | 326 | 335 | 10.9 | 14.2 | 13.9 | 13.8 | 13.7 | - 3.5 | 4,592 | 4,344 | 4,492 | 4,584 | 6.8 |
| 9 Area 9 | 284 | 286 | 297 | 311 | 9.5 | 14.9 | 14.7 | 14.5 | 13.8 | - 7.4 | 4,234 | 4,200 | 4,310 | 4,286 | 1.2 |
| 10 Rockland | 285 | 289 | 314 | 331 | 16.1 | 13.4 | 13.8 | 12.9 | 12.0 | -10.4 | 3,816 | 3,988 | 4,048 | 3,968 | 4.0 |
| 11 New York County | 261 | 271 | 282 | 291 | 11.5 | 18.3 | 18.0 | 17.7 | 16.2 | -11.5 | 4,784 | 4,876 | 4,998 | 4,721 | - 1.3 |
| 12 Richmond County | 259 | 274 | 291 | 317 | 22.4 | 17.4 | 17.1 | 17.3 | 15.3 | -12.1 | 4,510 | 4,678 | 5,026 | 4,848 | 7.5 |
| 13 Kings County | 247 | 258 | 266 | 275 | 11.3 | 18.4 | 20.4 | 19.9 | 17.1 | - 7.1 | 4,544 | 5,259 | 5,292 | 4,704 | 3.5 |
| 14 Queens County | 255 | 255 | 269 | 273 | 7.1 | 17.2 | 16.9 | 16.9 | 15.9 | - 7.6 | 4,379 | 4,311 | 4,553 | 4,347 | - 0.7 |
| 15 Nassau Physicians Organization | 263 | 272 | 279 | 287 | 9.1 | 14.6 | 14.8 | 15.0 | 14.6 | 0.0 | 3,846 | 4,019 | 4,186 | 4,184 | 8.8 |
| 16 Bronx Medical Services | 270 | 280 | 282 | 292 | 8.1 | 17.1 | 17.3 | 16.9 | 16.4 | - 4.1 | 4,619 | 4,842 | 4,757 | 4,789 | 3.7 |
| 17 Suffolk Physicians Review | 265 | 273 | 295 | 304 | 14.7 | 12.8 | 13.0 | 13.4 | 13.7 | 7.0 | 3,395 | 3,554 | 3,947 | 4,170 | 22.8 |
| Puerto Rico | 227 | 228 | 237 | 228 | 0.4 | 12.5 | 11.8 | 11.3 | 10.4 | -16.2 | 2.834 | 2,694 | 2,680 | 2,374 | -16.2 |
|
|
|||||||||||||||
| Virgin Islands | 248 | 231 | 285 | 391 | 57.7 | 17.1 | 20.7 | 17.7 | 16.5 | -3.5 | 4,236 | 4,787 | 5,044 | 6,446 | 23.2 |
|
|
|||||||||||||||
| PHILADELPHIA REGION | 296 | 305 | 317 | 322 | 8.2 | 13.0 | 12.6 | 12.5 | 12.3 | -5.4 | 3,852 | 3,845 | 3.961 | 3,960 | 3.8 |
|
|
|||||||||||||||
| Delawre | 260 | 267 | 281 | 290 | 11.5 | 13.3 | 12.6 | 13.0 | 12.5 | -6.0 | 3,459 | 3,361 | 3,651 | 3,630 | 4.9 |
|
|
|||||||||||||||
| District of Columbia | 249 | 256 | 269 | 273 | 9.6 | 14.2 | 14.7 | 14.3 | 13.7 | -3.5 | 3,530 | 3,757 | 3,849 | 3,738 | 5.9 |
|
|
|||||||||||||||
| Maryland | 257 | 265 | 280 | 289 | 12.5 | 13.2 | 13.2 | 13.2 | 12.9 | -2.3 | 3,386 | 3,496 | 3,689 | 3,725 | 10.0 |
|
|
|||||||||||||||
| 1 Western Maryland | 282 | 295 | 305 | 311 | 10.3 | 12.2 | 12.4 | 11.9 | 11.9 | -2.5 | 3,434 | 3,663 | 3,627 | 3,701 | 7.3 |
| 2 Baltimore City | 244 | 256 | 270 | 281 | 15.2 | 14.7 | 14.8 | 15.2 | 14.8 | 0.7 | 3,590 | 3,781 | 4,106 | 4,153 | 15.7 |
| 3 Montgomery County | 274 | 258 | 281 | 287 | 4.7 | 12.2 | 11.9 | 12.1 | 11.7 | -4.1. | 3,343 | 3,074 | 3,403 | 3,362 | 0.6 |
| 4 Prince George's Foundation | 261 | 291 | 312 | 326 | 24.9 | 13.4 | 13.0 | 12.8 | 13.3 | -0.7 | 3,496 | 3,787 | 3,995 | 4,334 | 24.0 |
| 5 Central Maryland | 244 | 255 | 267 | 269 | 10.2 | 12.9 | 12.9 | 12.8 | 12.5 | -3.1 | 3,150 | 3,294 | 3,419 | 3,360 | 6.7 |
| 6 Southern Maryland | 280 | 281 | 290 | 302 | 7.9 | 11.4 | 11.4 | 11.2 | 11.0 | -3.5 | 3,195 | 3,207 | 3,253 | 3,321 | 3.9 |
| 7 Delmarva Foundation | 265 | 269 | 284 | 305 | 15.1 | 11.0 | 11.2 | 10.8 | 10.7 | -2.7 | 2,919 | 3,018 | 3,062 | 3,150 | 11.7 |
| Pennsylvania | 291 | 301 | 312 | 319 | 9.6 | 13.3 | 12.8 | 12.7 | 12.5 | -6.0 | 3,868 | 3,849 | 3,962 | 3,984 | 3.0 |
|
|
|||||||||||||||
| 1 Northwestern Pennsylvania | 325 | 343 | 359 | 360 | 10.0 | 12.2 | 11.8 | 11.8 | 11.6 | -4.9 | 3,961 | 4,050 | 4,233 | 3,490 | 5.4 |
| 2 Central Pennsylvania | 317 | 332 | 339 | 339 | 6.9 | 11.4 | 10.8 | 10.4 | 10.3 | -9.6 | 3,612 | 3,585 | 3,528 | 3,490 | -3.4 |
| 3 Northeastern Pennsylvania | 281 | 294 | 304 | 315 | 12.1 | 13.0 | 12.4 | 12.6 | 12.7 | -2.3 | 3,650 | 3,640 | 3,835 | 4,003 | 9.7 |
| 4 Eastern Pennsylvania | 244 | 261 | 276 | 284 | 16.4 | 14.1 | 13.5 | 13.2 | 12.5 | -11.3 | 3,442 | 3,519 | 3,641 | 3,544 | 3.0 |
| 5 Midwestern Pennsylvania | 339 | 346 | 363 | 370 | 9.1 | 10.6 | 10.4 | 10.4 | 10.4 | -1.9 | 3,595 | 3,594 | 3,771 | 3,848 | 7.0 |
| 6 Alleghney | 312 | 322 | 326 | 330 | 5.8 | 13.4 | 13.0 | 12.9 | 12.9 | -3.7 | 4,174 | 4,180 | 4,202 | 4,254 | 1.9 |
| 7 Southwestern Pennsylvania | 324 | 327 | 346 | 356 | 9.9 | 12.2 | 11.8 | 11.8 | 11.3 | -7.4 | 3,950 | 3,853,4 | 4,081 | 4,023 | 1.8 |
| 8 Highlands | 331 | 341 | 345 | 352 | 6.3 | 12.3 | 11.9 | 12.0 | 11.7 | -4.9 | 4,071 | 4,054 | 4,134 | 4,122 | 1.3 |
| 9 Southcentral Pennsylvania | 257 | 262 | 273 | 279 | 8.6 | 13.9 | 13.1 | 12.9 | 12.6 | -9.4 | 3,565 | 3,434 | 3,518 | 3,509 | -1.6 |
| 10 Delaware-Chester | 274 | 283 | 301 | 307 | 12.0 | 14.2 | 13.5 | 13.4 | 12.8 | -9.9 | 3,894 | 3,822 | 4,028 | 3,924 | 0.8 |
| 11 Montgomery/Bucks | 265 | 283 | 294 | 303 | 14.3 | 13.2 | 12.5 | 12.3 | 12.1 | 3.3. | 3,501 | 3,541 | 3,614 | 3,660 | 4.5 |
| 12 Philadelphia | 281 | 289 | 301 | 312 | 11.0 | 15.0 | 14.8 | 14.8 | 14.9 | -0.7 | 4,213 | 4,276 | 4,460 | 4,644 | 10.2 |
| Virginia | 317 | 325 | 333 | 337 | 6.3 | 13.0 | 12.3 | 12.3 | 11.9 | -8.5 | 4,118 | 3.998 | 4,101 | 4,013 | -2.5 |
|
|
|||||||||||||||
| 1 Shenandoah Foundation | 318 | 321 | 337 | 335 | 5.3. | 12.5 | 11.6 | 11.6 | 11.4 | 8.8 | 3,974 | 3,728 | 3,906 | 3,823 | -3.8 |
| 2 Northern Virginia | 296 | 294 | 304 | 313 | 5.7 | 12.6 | 12.2 | 11.9 | 11.3 | -10.3 | 3,727 | 3,586 | 3,622 | 3,540 | 5.0 |
| 3 Southwest Virginia | 349 | 364 | 366 | 372 | 6.6 | 12.5 | 11.8 | 11.6 | 11.4 | -8.2 | 4,367 | 4,095 | 4,247 | 4,241 | 2.9 |
| 4 Southcentral | 300 | 315 | 318 | 324 | 8.0 | 13.7 | 12.8 | 13.2 | 13.0 | -5.1 | 4,110 | 4,027 | 4,197 | 4,207 | 3.4 |
| 5 Colonial Virginia | 300 | 304 | 318 | 320 | 6.7 | 13.8 | 12.9 | 12.9 | 12.1 | -12.3 | 4,143 | 3,917 | 4,105 | 3,871 | -6.6 |
| West Virginia | 380 | 385 | 400 | 390 | 2.6 | 11.5 | 10.9 | 10.8 | 10.5 | -2.7 | 4,360 | 4,199 | 4,325 | 4,099 | -6.2 |
|
|
|||||||||||||||
| ATLANTA REGION | 337 | 343 | 356 | 365 | 8.3 | 10.6 | 10.3 | 10.2 | 10.0 | - 5.7 | 3,573 | 3,531 | 3,628 | 3,651 | 2.2 |
|
|
|||||||||||||||
| Alabama | 362 | 363 | 382 | 394 | 8.8 | 10.3 | 10.1 | 9.9 | 9.5 | - 7.8 | 3,723 | 3,665 | 3,779 | 3,738 | 0.4 |
|
|
|||||||||||||||
| Florida | 315 | 322 | 338 | 345 | 9.5 | 10.3 | 10.1 | 10.0 | 9.8 | - 4.9 | 3,242 | 3,253 | 3,379 | 3,383 | 4.3 |
|
|
|||||||||||||||
| 1 Foundation for PSR | 394 | 392 | 419 | 433 | 9.9 | 9.1 | 8.8 | 8.8 | 8.7 | - 4.4 | 3,584 | 3,450 | 3,689 | 3,765 | 5.1 |
| 2 Community Medical Services | 319 | 336 | 345 | 350 | 9.7 | 9.6 | 9.3 | 9.3 | 8.9 | - 7.3 | 3,058 | 3,122 | 3,209 | 3,119 | 2.0 |
| 3 Jacksonville Area | 346 | 352 | 368 | 386 | 11.6 | 10.5 | 10.2 | 10.2 | 9.9 | - 5.7 | 3,632 | 3,585 | 3,753 | 3,825 | 5.3 |
| 4 Finalles County | 264 | 268 | 290 | 301 | 14.0 | 11.0 | 11.0 | 11.0 | 10.6 | - 3.6 | 2,906 | 2,943 | 3,185 | 3,185 | 9.6 |
| 5 Professional Foundation | 310 | 313 | 320 | 322 | 3.9 | 10.2 | 10.0 | 9.7 | 9.6 | - 5.9 | 3,161 | 3,131 | 3,102 | 3,094 | -2.1 |
| 6 Polk-Highlands-Hardee | 320 | 334 | 347 | 351 | 9.7 | 9.9 | 9.7 | 9.6 | 9.3 | - 6.1 | 3,163 | 3,243 | 3,327 | 3,259 | 3.0 |
| 7 Central Florida | 345 | 350 | 362 | 370 | 7.2 | 10.0 | 9.9 | 9.8 | 9.3 | - 7.0 | 3,451 | 3,466 | 3,549 | 3,437 | -0.4 |
| 8 Bravard-Valusia | 326 | 326 | 333 | 337 | 3.4 | 10.7 | 10.4 | 10.4 | 10.2 | - 4.7 | 3,484 | 3,391 | 3,462 | 3,438 | -1.3 |
| 9 West Central Florida | 286 | 296 | 310 | 311 | 8.7 | 10.5 | 10.2 | 10.2 | 9.8 | - 6.7 | 3,005 | 3,014 | 3,159 | 3,044 | 1.3 |
| 10 Foundation for Medical Care | 265 | 274 | 290 | 294 | 10.9 | 9.4 | 9.2 | 9.3 | 9.2 | - 2.1 | 2,490 | 2,520 | 2,692 | 2,705 | 8.6 |
| 11 Broward-Collier | 307 | 321 | 337 | 348 | 13.4 | 10.1 | 9.9 | 9.8 | 9.6 | - 5.0 | 3,096 | 3,182 | 3,307 | 3,341 | 7.9 |
| 12 Dade Monroe | 354 | 362 | 381 | 387 | 9.3 | 10.8 | 10.6 | 10.5 | 10.4 | - 3.7 | 3,827 | 3,832 | 4,005 | 4,028 | 5.3 |
| Georgia | 342 | 344 | 357 | 374 | 9.4 | 9.6 | 9.2 | 9.0 | 8.9 | - 7.3 | 3,285 | 3,163 | 3,216 | 3.325 | 1.2 |
|
|
|||||||||||||||
| Kentuchy | 351 | 358 | 370 | 378 | 7.7 | 10.3 | 10.3 | 10.2 | 10.0 | - 2.9 | 3,616 | 3,684 | 3,770 | 3.784 | 4.6 |
|
|
|||||||||||||||
| Mississipi | 417 | 426 | 434 | 446 | 7.0 | 10.3 | 10.0 | 10.1 | 10.0 | - 2.9 | 4,298 | 4,263 | 4,387 | 4.458 | 3.7 |
|
|
|||||||||||||||
| North Carolina | 315 | 324 | 331 | 336 | 6.7 | 12.3 | 11.7 | 11.5 | 11.3 | - 8.1 | 3,879 | 3,786 | 3,806 | 3,800 | -2.0 |
|
|
|||||||||||||||
| 1 Western North Carolina | 341 | 369 | 372 | 371 | 8.8 | 11.8 | 10.8 | 10.5 | 10.4 | -11.9 | 4,025 | 3,981 | 3,910 | 3,857 | -4.2 |
| 2 Piedmont Medical Foundation | 330 | 330 | 337 | 342 | 3.6 | 12.5 | 11.7 | 11.4 | 11.3 | - 9.6 | 4,128 | 3,857 | 3,843 | 3,867 | -6.3 |
| 3 North Central | 276 | 273 | 282 | 297 | 7.6 | 12.2 | 11.5 | 11.8 | 11.4 | - 6.6 | 3,363 | 3,143 | 3,323 | 3,389 | 0.8 |
| 4 Central Piedmont | 287 | 281 | 292 | 302 | 5.2 | 11.7 | 11.7 | 11.6 | 11.5 | - 1.7 | 3,358 | 3,293 | 3,383 | 3,475 | 3.5 |
| 5 Capital Area | 322 | 331 | 344 | 341 | 5.9 | 13.8 | 13.5 | 12.5 | 12.9 | - 6.5 | 4,448 | 4,471 | 4,305 | 4,400 | -1.1 |
| 6 Northeastern North Carolina | 309 | 322 | 333 | 341 | 10.4 | 11.7 | 11.3 | 11.3 | 11.1 | - 5.1 | 3,616 | 3,640 | 3,764 | 3,787 | 4.7 |
| 7 Metrolina | 311 | 321 | 327 | 330 | 6.1 | 12.1 | 11.6 | 11.3 | 11.1 | - 8.3 | 3,767 | 3,726 | 3,694 | 3,666 | -2.7 |
| 8 Southeastern North Carolina | 326 | 332 | 335 | 343 | 5.2 | 12.6 | 12.5 | 12.3 | 12.0 | - 4.8 | 4,105 | 4,150 | 4,123 | 4,115 | 0.2 |
| South Carolina | 305 | 310 | 315 | 326 | 6.9 | 10.9 | 10.8 | 10.6 | 10.8 | - 0.9 | 3,329 | 3.351 | 3.342 | 3.525 | 5.9 |
|
|
|||||||||||||||
| Tennessee | 356 | 363 | 376 | 389 | 9.3 | 11.1 | 10.8 | 10.6 | 10.3 | - 7.2 | 3,955 | 3.917 | 3.987 | 4.005 | 1.3 |
|
|
|||||||||||||||
| 1 Mid-South Foundation | 325 | 331 | 345 | 356 | 9.5 | 12.3 | 12.0 | 11.8 | 11.5 | - 6.5 | 4,001 | 3,977 | 4,068 | 4,092 | 2.3 |
| 2 Tennessee Foundation | 367 | 374 | 387 | 400 | 9.0 | 10.8 | 10.4 | 10.2 | 9.9 | - 8.3 | 3,965 | 3,886 | 3,948 | 3,963 | 0.1 |
| CHICAGO REGION | 330 | 334 | 344 | 347 | 5.2 | 12.4 | 12.0 | 11.8 | 11.5 | -7.3 | 4,087 | 4,011 | 4,064 | 3,995 | -2.3 |
|
|
|||||||||||||||
| Illinois | 339 | 342 | 355 | 359 | 5.9 | 12.8 | 12.3 | 12.2 | 11.9 | -7.0 | 4,334 | 4,204 | 4,326 | 4,274 | -1.4 |
|
|
|||||||||||||||
| 1 Northern Illinois | 331 | 328 | 338 | 335 | 1.2 | 10.5 | 10.3 | 10.2 | 9.7 | -7.6 | 3,471 | 3,381 | 3,447 | 3,251 | -6.3 |
| 2 Crescent Counties Foundation | 307 | 312 | 320 | 325 | 5.9 | 12.1 | 11.8 | 11.5 | 11.1 | -8.3 | 3,710 | 3,683 | 3,684 | 3,603 | -2.9 |
| 3 Chicago Foundation | 309 | 316 | 331 | 336 | 3.7 | 14.3 | 14.0 | 14.1 | 13.6 | -4.9 | 4,412 | 4,425 | 4,672 | 4,571 | 3.6 |
| 4 Quad River Foundation | 329 | 335 | 342 | 354 | 7.6 | 14.2 | 12.2 | 12.5 | 12.1 | -14.8 | 4,667 | 4,085 | 4,270 | 4,285 | -8.2 |
| 5 Mid-State Foundation | 377 | 377 | 388 | 397 | 5.3 | 12.3 | 11.5 | 11.4 | 11.0 | -10.6 | 4,633 | 4,338 | 4,425 | 4,364 | -5.8 |
| 6 East Central Illinois Foundation | 377 | 369 | 376 | 381 | 1.1 | 10.7 | 10.2 | 10.1 | 9.9 | -7.5 | 4,036 | 3,765 | 3,799 | 3,769 | -6.6 |
| 7 | 405 | 398 | 412 | 415 | 2.5 | 11.9 | 11.2 | 10.8 | 10.9 | -8.4 | 4,819 | 4,457 | 4,454 | 4,518 | -6.2 |
| 8 Southern Illinois | 388 | 390 | 404 | 409 | 5.4 | 11.0 | 10.5 | 10.2 | 10.3 | -6.4 | 4,264 | 4,096 | 4,119 | 4,208 | -1.3 |
| Indiana | 319 | 324 | 337 | 341 | 6.9 | 12.4 | 12.1 | 11.9 | 11.4 | -8.1 | 3,956 | 3,923 | 4,008 | 3,891 | -1.6 |
|
|
|||||||||||||||
| 1 Calumet | 306 | 301 | 314 | 321 | 4.9 | 12.5 | 12.1 | 12.3 | 11.9 | -4.8 | 3,827 | 3,644 | 3,862 | 3,819 | -0.2 |
| 2 Area II - South Bend | 325 | 322 | 337 | 333 | 2.5 | 12.0 | 12.1 | 11.7 | 11.4 | -5.0 | 3,904 | 3,900 | 3,947 | 3,801 | -2.6 |
| 3 Area III - Fort Wayne | 297 | 309 | 310 | 317 | 6.7 | 13.4 | 12.8 | 12.1 | 11.1 | -17.2 | 3,976 | 3,957 | 3,756 | 3,517 | -11.5 |
| 4 Area IV - Newcastle | 324 | 323 | 338 | 340 | 4.9 | 12.6 | 12.7 | 12.0 | 11.7 | -7.1 | 4,083 | 4,098 | 4,052 | 3,977 | -2.6 |
| 5 Area V - Indianapolis | 306 | 320 | 333 | 342 | 11.6 | 12.7 | 12.3 | 12.2 | 11.6 | -3.7 | 3,883 | 3,934 | 4,067 | 3,971 | 2.3 |
| 6 Area VI - Terre Haute | 350 | 353 | 369 | 363 | 3.7 | 11.0 | 10.6 | 10.7 | 10.3 | -6.4 | 3,845 | 3,740 | 3,950 | 3,738 | -2.8 |
| 7 Southwest Indiana | 348 | 358 | 371 | 385 | 10.6 | 12.4 | 11.8 | 11.7 | 11.4 | -3.1 | 4,311 | 4,225 | 4,340 | 4,392 | 1.9 |
| Michigan | 316 | 327 | 338 | 344 | 3.9 | 12.7 | 12.3 | 12.0 | 11.7 | -7.9 | 4,016 | 4,024 | 4,053 | 4,026 | 0.3 |
|
|
|||||||||||||||
| 1 Upper Penisula | 374 | 378 | 392 | 378 | 1.1 | 12.3 | 11.9 | 11.4 | 11.1 | -9.8 | 4,596 | 4,496 | 4,466 | 4,194 | -3.7 |
| 2 Area II | 350 | 355 | 358 | 364 | 4.0 | 11.3 | 11.0 | 10.7 | 10.4 | -3.0 | 3,931 | 3,904 | 3,830 | 3,781 | -4.3 |
| 3 Western Michigan | 290 | 302 | 313 | 320 | 10.3 | 11.4 | 10.9 | 10.6 | 10.1 | -11.4 | 3,301 | 3,289 | 3,316 | 3,231 | -2.1 |
| 4 Area IV - Saginaw | 337 | 347 | 354 | 354 | 5.0 | 11.4 | 11.1 | 10.8 | 10.3 | -9.6 | 3,841 | 3,857 | 3,824 | 3,647 | -5.1 |
| 5 GLSC - Flint | 344 | 348 | 365 | 366 | 6.4 | 13.8 | 13.1 | 12.9 | 12.5 | -9.4 | 4,749 | 4,559 | 4,712 | 4,575 | -3.7 |
| 6 Central Michigan Medical Care | 320 | 321 | 331 | 335 | 4.7 | 11.9 | 11.8 | 10.9 | 10.9 | -8.4 | 3,811 | 3,782 | 3,611 | 3,651 | -4.2 |
| 7 Area VII - Ann Arbor | 318 | 332 | 343 | 350 | 10.1 | 11.5 | 11.3 | 11.3 | 11.2 | -2.6 | 3,657 | 3,753 | 3,876 | 3,922 | 7.2 |
| 8 Southeastern Michigan | 300 | 315 | 330 | 339 | 13.0 | 14.3 | 14.0 | 13.6 | 13.4 | -6.3 | 4,289 | 4,414 | 4,483 | 4,542 | 5.9 |
| 9 Oakland-Macomb | 305 | 316 | 318 | 333 | 9.3 | 13.2 | 12.9 | 12.6 | 12.2 | -7.6 | 4,023 | 4,079 | 4,009 | 4,057 | 0.3 |
| 10 Area X - Kalamazoo | 334 | 342 | 351 | 356 | 6.6 | 11.3 | 10.9 | 10.8 | 10.2 | -9.7 | 3,779 | 3,724 | 3,790 | 3,635 | -3.6 |
| Minnesota | 379 | 375 | 384 | 371 | -2.1 | 11.1 | 10.9 | 10.5 | 10.0 | -9.9 | 4,205 | 4,084 | 4,032 | 3,710 | -11.8 |
|
|
|||||||||||||||
| 1 | 398 | 393 | 397 | 393 | -1.3 | 10.6 | 10.3 | 10.0 | 9.4 | -11.3 | 4,222 | 4,051 | 3,973 | 3,690 | 12.6 |
| 2 Foundation for Health Care | 390 | 382 | 394 | 368 | -5.6 | 11.7 | 11.6 | 11.3 | 10.8 | -7.7 | 4,559 | 4,434 | 4,453 | 3,977 | -12.8 |
| 3 Quality Council | 345 | 347 | 357 | 354 | 3.6 | 10.7 | 10.4 | 10.0 | 9.5 | -11.2 | 3,696 | 3,604 | 3,572 | 3,365 | -9.0 |
| Ohio | 310 | 319 | 327 | 333 | 7.4 | 12.6 | 12.3 | 12.2 | 11.9 | -5.6 | 3,906 | 3,918 | 3,985 | 3,959 | 1.4 |
|
|
|||||||||||||||
| 1 Medco Peer Review | 296 | 308 | 313 | 324 | 9.5 | 13.6 | 13.0 | 12.8 | 12.4 | -8.8 | 4,030 | 4,006 | 4,009 | 4,022 | -0.2 |
| 2 Area II - Dayton | 287 | 293 | 308 | 318 | 10.8 | 12.7 | 12.5 | 12.3 | 11.7 | -7.9 | 3,645 | 3,656 | 3,792 | 3,726 | 2.2 |
| 3 Region III - Findlay | 337 | 343 | 352 | 352 | 4.5 | 11.0 | 10.5 | 10.6 | 10.4 | -5.5 | 3,709 | 3,602 | 3,734 | 3,659 | -1.3 |
| 4 Fourth Ohio Area - Sylvania | 330 | 347 | 349 | 358 | 8.5 | 11.7 | 11.3 | 11.3 | 11.0 | -6.0 | 3,862 | 3,919 | 3,939 | 3,943 | 2.1 |
| 5 Region V - Paineaville | 312 | 333 | 331 | 341 | 9.3 | 11.6 | 11.3 | 11.1 | 11.0 | -5.2 | 3,622 | 3,759 | 3,671 | 3,745 | 3.4 |
| 6 Region VI - Akron | 310 | 310 | 323 | 324 | 4.5 | 12.7 | 12.4 | 12.4 | 12.1 | -4.7 | 3,930 | 3,846 | 4,003 | 3,917 | -0.3 |
| 7 Area VII - Martins Ferry | 356 | 370 | 381 | 383 | 7.6 | 11.2 | 11.2 | 11.2 | 11.3 | 0.9 | 3,981 | 4,140 | 4,264 | 4,324 | 8.6 |
| 8 Area VIII - Zanesville | 331 | 345 | 343 | 353 | 6.6 | 12.2 | 12.0 | 12.0 | 11.4 | -6.6 | 4,042 | 4,137 | 4,120 | 4,024 | -0.4 |
| 9 Region IX - Portsmouth | 370 | 362 | 374 | 370 | 0.0 | 12.0 | 11.6 | 11.7 | 11.5 | -4.2 | 4,436 | 4,196 | 4,375 | 4,260 | -4.0 |
| 10 Region X - Columbus | 288 | 306 | 317 | 325 | 12.8 | 12.7 | 12.7 | 12.6 | 12.3 | -3.1 | 3,662 | 3,885 | 3,988 | 4,000 | 9.2 |
| 11 Area XI - Ashland | 337 | 352 | 347 | 359 | 6.5 | 11.4 | 10.9 | 10.7 | 10.6 | -7.0 | 3,841 | 3,840 | 3,708 | 3,804 | -1.0 |
| 12 Physicians' Peer Review | 296 | 299 | 310 | 312 | 5.4 | 13.7 | 13.6 | 13.7 | 13.2 | -3.6 | 4,055 | 4,064 | 4,242 | 4,121 | 1.6 |
| Wisconsin | 337 | 335 | 342 | 342 | 1.5 | 11.9 | 11.4 | 10.9 | 10.7 | -10.1 | 4,013 | 3,819 | 3,723 | 3,659 | -8.3 |
|
|
|||||||||||||||
| 1 Wisconsin Review Organization | 357 | 353 | 361 | 357 | 0.0 | 11.3 | 10.8 | 10.3 | 10.0 | -11.5 | 4,030 | 3,807 | 3,719 | 3,573 | -11.3 |
| 2 Southeastern Wisconsin | 301 | 302 | 305 | 313 | 4.0 | 13.3 | 12.8 | 12.4 | 12.1 | -9.0 | 3,997 | 3,859 | 3,782 | 3,788 | -5. |
| DALLAS REGION | 389 | 389 | 400 | 406 | 4.4 | 9.9 | 9.6 | 9.5 | 9.3 | - 6.1 | 3,847 | 3.730 | 3,802 | 3,772 | - 2.0 |
|
|
|||||||||||||||
| Arkansas | 405 | 405 | 420 | 431 | 6.4 | 9.6 | 9.3 | 9.0 | 8.8 | - 8.3 | 3,884 | 3,764 | 3,781 | 3,788 | - 2.5 |
|
|
|||||||||||||||
| Louisiana | 373 | 373 | 386 | 394 | 5.6 | 9.9 | 9.7 | 9.7 | 9.6 | - 3.0 | 3.694 | 3,616 | 3,739 | 3,783 | 2.4 |
|
|
|||||||||||||||
| 1 North Louisiana | 407 | 408 | 421 | 426 | 4.7 | 8.9 | 8.7 | 8.7 | 8.6 | - 3.4 | 3,626 | 3,550 | 3,664 | 3,661 | 1.0 |
| 2 Southwest Louisiana | 431 | 430 | 442 | 452 | 4.9 | 8.7 | 8.5 | 8.4 | 8.3 | - 4.6 | 3,748 | 3,657 | 3,709 | 3,753 | 0.1 |
| 3 Louisiana Medical Standards | 394 | 395 | 402 | 408 | 3.6 | 9.2 | 8.9 | 8.9 | 8.9 | - 3.3 | 3,626 | 3,512 | 3,581 | 3,631 | 0.1 |
| 4 Southeast Louisiana | 302 | 301 | 315 | 329 | 8.9 | 12.5 | 12.4 | 12.4 | 12.0 | - 4.0 | 3,773 | 3,729 | 3,904 | 3,945 | 4.6 |
| New Mexico | 336 | 341 | 351 | 346 | 3.0 | 9.0 | 9.0 | 9.0 | 8.5 | - 5.6 | 3,028 | 3,072 | 3,157 | 2,945 | - 2.7 |
|
|
|||||||||||||||
| Oklahoma | 401 | 394 | 401 | 397 | -1.0 | 9.3 | 9.0 | 8.9 | 8.9 | - 4.3 | 3,730 | 3,549 | 3,569 | 3,531 | - 5.3 |
|
|
|||||||||||||||
| Texas | 390 | 391 | 403 | 410 | 5.1 | 10.2 | 9.9 | 9.8 | 9.4 | - 7.8 | 3,976 | 3,873 | 3,953 | 3,854 | - 3.1 |
|
|
|||||||||||||||
| 1 | 453 | 446 | 457 | 468 | 3.3 | 9.7 | 9.3 | 9.2 | 8.9 | - 8.2 | 4,393 | 4,148 | 4,203 | 4,165 | - 5.2 |
| 2 | 372 | 374 | 381 | 397 | 6.7 | 10.3 | 9.8 | 9.7 | 9.4 | - 8.7 | 3,835 | 3,669 | 3,697 | 3,735 | -,2.6 |
| 3 | 355 | 359 | 372 | 376 | 5.9 | 10.5 | 10.3 | 10.1 | 9.8 | - 6.7 | 3,726 | 3,695 | 3,752 | 3,682 | - 1.2 |
| 4 | 435 | 432 | 445 | 450 | 3.4 | 9.8 | 9.3 | 9.2 | 8.9 | - 9.2 | 4,263 | 4,019 | 4,090 | 4,006 | - 6.0 |
| 5 | 407 | 402 | 416 | 422 | 3.7 | 9.8 | 9.6 | 9.5 | 9.0 | - 8.2 | 3,985 | 3,863 | 3,953 | 3,802 | - 4.6 |
| 6 | 365 | 375 | 384 | 387 | 6.0 | 10.3 | 9.8 | 9.7 | 9.2 | -10.7 | 3,761 | 3,674 | 3,726 | 3,557 | - 5.4 |
| 7 | 386 | 387 | 403 | 408 | 5.7 | 10.9 | 10.6 | 10.5 | 10.4 | - 4.6 | 4,212 | 4,104 | 4,226 | 4,244 | 0.8 |
| 8 | 400 | 414 | 409 | 421 | 5.3 | 11.4 | 11.1 | 10.7 | 10.0 | -12.3 | 4,554 | 4,598 | 4,380 | 4,206 | - 7.6 |
| 9 | 358 | 362 | 378 | 385 | 7.5 | 10.2 | 9.9 | 9.9 | 9.5 | - 6.9 | 3,652 | 3,583 | 3,746 | 3,653 | 0.03 |
| KANSAS CITY REGION | 378 | 382 | 395 | 399 | 5.6 | 11.7 | 11.5 | 11.3 | 10.8 | - 7.7 | 4,426 | 4,391 | 4,461 | 4,311 | - 2.6 |
|
|
|||||||||||||||
| Iowa | 375 | 378 | 388 | 388 | 3.5 | 11.2 | 11.2 | 10.8 | 10.0 | -10.7 | 4,202 | 4,234 | 4,190 | 3,883 | - 7.6 |
|
|
|||||||||||||||
| Kansas | 414 | 419 | 438 | 440 | 6.3 | 11.7 | 11.6 | 11.5 | 11.2 | - 4.3 | 4,838 | 4,857 | 5,032 | 4,932 | 1.9 |
|
|
|||||||||||||||
| Missouri | 357 | 362 | 374 | 384 | 7.6 | 12.3 | 12.1 | 11.9 | 11.4 | - 7.3 | 4,387 | 4,381 | 4,444 | 4,379 | 0.2 |
| 1 Northwest Missouri | 359 | 368 | 374 | 381 | 6.1 | 12.0 | 12.1 | 11.7 | 11.4 | - 3.0 | 4,305 | 4,458 | 4,375 | 4,341 | 0.8 |
| 2 Mid Missouri | 382 | 398 | 405 | 417 | 9.2 | 12.1 | 11.7 | 11.7 | 10.8 | -10.7 | 4,626 | 4,652 | 4,734 | 4,504 | - 2.6 |
| 3 Central Eastern Missouri | 325 | 329 | 346 | 360 | 10.7 | 14.0 | 13.5 | 13.3 | 12.8 | - 8.6 | 4,543 | 4,437 | 4,600 | 4,604 | 1.3 |
| 4 MOAF | 360 | 359 | 371 | 379 | 5.1 | 10.9 | 10.8 | 10.6 | 10.1 | -7.3 | 3,925 | 3,877 | 3,928 | 3,829 | - 2.4 |
| 5 Southeast Missouri | 431 | 424 | 442 | 453 | 5.1 | 10.4 | 10.2 | 10.2 | 9.9 | - 4.8 | 4,480 | 4,322 | 4,509 | 4,481 | 0.02 |
| Nebraska | 402 | 399 | 414 | 410 | 2.0 | 10.7 | 10.2 | 9.9 | 9.7 | - 9.3 | 4,303 | 4.072 | 4,098 | 3,972 | - 7.7 |
|
|
|||||||||||||||
| DENVER REGION | 382 | 378 | 388 | 385 | 0.8 | 9.7 | 9.6 | 9.4 | 9.0 | - 7.2 | 3,706 | 3,628 | 3,650 | 3,468 | - 6.4 |
|
|
|||||||||||||||
| Colorado | 369 | 369 | 378 | 377 | 2.2 | 9.8 | 10.0 | 9.9 | 9.5 | - 3.1 | 3,614 | 3,685 | 3,744 | 3,580 | - 0.9 |
|
|
|||||||||||||||
| Montana | 422 | 413 | 423 | 413 | -2.1 | 9.0 | 8.9 | 8.4 | 8.0 | -11.1 | 3,798 | 3,673 | 3,550 | 3,35 | - 13.0 |
|
|
|||||||||||||||
| North Dakota | 441 | 436 | 450 | 443 | 0.5 | 10.5 | 10.2 | 9.9 | 9.5 | - 9.5 | 4,625 | 4,446 | 4,457 | 4,209 | - 9.0 |
|
|
|||||||||||||||
| South Dakota | 422 | 417 | 430 | 429 | 1.7 | 10.0 | 10.0 | 9.7 | 9.1 | - 9.0 | 4,223 | 4,169 | 4,173 | 3,905 | - 7.5 |
|
|
|||||||||||||||
| Utah | 290 | 288 | 295 | 296 | 2.1 | 8.6 | 8.3 | 8.2 | 8.0 | - 7.0 | 2,492 | 2,387 | 2,420 | 2,370 | - 4.9 |
|
|
|||||||||||||||
| Wyoming | 395 | 380 | 392 | 389 | -1.5 | 9.6 | 9.1 | 9.0 | 8.6 | -10.4 | 3.792 | 3,453 | 3,529 | 3,348 | - 11.7 |
|
|
|||||||||||||||
| SAN FRANCISCO REGION | 310 | 312 | 317 | 319 | 2.9 | 9.6 | 9.3 | 9.3 | 9.1 | - 5.2 | 2,972 | 2,899 | 2,951 | 2,905 | - 2.3 |
|
|
|||||||||||||||
| Arizona | 315 | 316 | 317 | 321 | 1.9 | 10.6 | 10.5 | 10.4 | 10.0 | - 5.7 | 3,339 | 3,313 | 3,300 | 3,211 | - 3.8 |
|
|
|||||||||||||||
| 1 Northern Arizona | 305 | 310 | 312 | 314 | 3.0 | 10.5 | 10.4 | 10.3 | 9.8 | - 6.7 | 3,202 | 3,219 | 3,213 | 3,080 | - 3.8 |
| 2 Greatern Southern | 338 | 330 | 330 | 338 | 0.0 | 10.9 | 10.7 | 10.6 | 10.3 | - 5.5 | 3,687 | 3,525 | 3,493 | 3,477 | - 5.7 |
| California | 310 | 312 | 318 | 320 | 3.2 | 9.5 | 9.2 | 9.2 | 8.9 | - 6.3 | 2,940 | 2,870 | 2,925 | 2,847 | - 3.2 |
|
|
|||||||||||||||
| 1 Redwood Coast Region | 311 | 322 | 328 | 321 | 3.2 | 7.5 | 7.2 | 7.3 | 7.2 | - 4.0 | 2,331 | 2,316 | 2,393 | 2,314 | - 0.7 |
| 2 Superior California | 357 | 347 | 357 | 351 | - 1.7 | 8.3 | 7.8 | 8.0 | 7.7 | - 7.2 | 2,963 | 2,705 | 2,856 | 2,704 | - 8.7 |
| 3 North Bay | 301 | 295 | 308 | 304 | 1.0 | 9.1 | 9.2 | 8.9 | 8.8 | - 3.3 | 2,737 | 2,711 | 2,741 | 2,673 | - 2.3 |
| 4 Greater Sacramento | 301 | 307 | 308 | 303 | 0.7 | 8.6 | 8.4 | 8.2 | 8.0 | - 7.0 | 2,590 | 2,579 | 2,525 | 2,426 | - 6.3 |
| 5 San Francisco Peer Review Organization, Inc | 305 | 308 | 313 | 317 | 3.9 | 10.7 | 10.7 | 10.9 | 10.4 | - 2.8 | 3,266 | 3,295 | 3,409 | 3,298 | - 1.0 |
| 6 Mid-peninsula | 284 | 292 | 294 | 301 | 6.0 | 10.0 | 9.8 | 9.7 | 9.7 | - 3.0 | 2,836 | 2,861 | 2,853 | 2,917 | 2.9 |
| 7 East Bay | 292 | 294 | 305 | 312 | 6.8 | 8.9 | 8.8 | 8.7 | 8.8 | - 1.1 | 2,595 | 2,586 | 2,655 | 2,742 | 5.2 |
| 8 San Joaquin Area | 304 | 301 | 310 | 308 | 1.3 | 7.7 | 7.6 | 7.8 | 7.8 | 1.3 | 2,343 | 2,284 | 2,416 | 2,400 | 2.4 |
| 9 Santa Clara Valley | 271 | 270 | 279 | 280 | 3.3 | 9.1 | 8.9 | 9.0 | 8.7 | - 4.4 | 2,462 | 2,401 | 2,509 | 2,433 | - 1.2 |
| 10 Stanislaus-Merced-Mariposa | 323 | 329 | 343 | 335 | 3.7 | 8.9 | 8.6 | 8.7 | 8.4 | - 5.6 | 2,871 | 2,829 | 2,980 | 2,814 | - 2.0 |
| 11 Fresno Madera | 265 | 274 | 283 | 285 | 7.5 | 7.7 | 7.1 | 7.3 | 7.1 | - 7.8 | 2,037 | 1,948 | 2,064 | 2,022 | - 0.7 |
| 12 Monterey Bay Area | 275 | 272 | 281 | 280 | 1.8 | 8.2 | 8.1 | 8.1 | 7.9 | -3.7 | 2,254 | 2,205 | 2,272 | 2,208 | - 2.0 |
| 13 PSRO of Tulare - Kings Counties | 319 | 314 | 324 | 324 | 1.6 | 7.9 | 7.5 | 7.4 | 7.3 | - 7.6 | 2,518 | 2,351 | 2,398 | 2,362 | - 6.2 |
| 14 Kern County | 331 | 343 | 343 | 351 | 6.0 | 8.3 | 8.0 | 8.0 | 7.6 | - 8.4 | 2,748 | 2,740 | 2,746 | 2,667 | 2.9 |
| 15 Professional Standards | 325 | 327 | 328 | 322 | - 0.9 | 9.4 | 9.1 | 9.0 | 8.8 | - 6.4 | 3,052 | 2,978 | 2,955 | 2,831 | - 7.2 |
| 16 Santa Barbara/San Luis Obispo Counties | 324 | 321 | 317 | 302 | - 6.8 | 9.0 | 8.6 | 8.6 | 8.5 | - 5.6 | 2,915 | 2,760 | 2,728 | 2,566 | - 12.0 |
| 17 Ventura Area | 313 | 322 | 315 | 332 | 6.1 | 8.3 | 7.9 | 8.1 | 7.9 | - 4.8 | 2,594 | 2,542 | 2,552 | 2,619 | - 1.0 |
| 18 Area XVIII | 322 | 327 | 334 | 340 | 5.6 | 10.3 | 10.0 | 10.1 | 9.7 | - 5.8 | 3,319 | 3,269 | 3,373 | 3,296 | - 0.7 |
| 26 | 314 | 322 | 325 | 330 | 5.1 | 9.5 | 9.2 | 9.3 | 9.0 | - 5.3 | 2,986 | 2,962 | 3,023 | 2,965 | - 0.7 |
| 27 Riverside County | 324 | 315 | 317 | 305 | - 5.9 | 8.9 | 8.6 | 8.6 | 8.2 | - 7.9 | 2,881 | 2,708 | 2,726 | 2,504 | - 13.1 |
| 28 San Diego/Imperial | 286 | 282 | 288 | 294 | 2.8 | 8.0 | 8.6 | 8.6 | 8.6 | 7.5 | 2,575 | 2,422 | 2,474 | 2,528 | - 1.8 |
| Hawaii | 263 | 263 | 258 | 257 | - 2.3 | 10.2 | 9.7 | 9.5 | 9.8 | - 3.9 | 2,680 | 2,550 | 2,446 | 2,514 | - 6.2 |
|
|
|||||||||||||||
| Nevada | 345 | 345 | 372 | 361 | 4.6 | 9.6 | 9.5 | 9.6 | 8.9 | - 7.3 | 3,312 | 3,279 | 3,566 | 3,211 | - 3.0 |
|
|
|||||||||||||||
| SEATLE REGION | 324 | 323 | 328 | 326 | 0.6 | 8.6 | 8.1 | 8.0 | 7.9 | - 8.1 | 2,785 | 2,614 | 2,621 | 2,575 | - 7.5 |
|
|
|||||||||||||||
| Alaska | 332 | 288 | 312 | 322 | - 3.0 | 8.0 | 7.5 | 8.0 | 8.3 | 3.8 | 2,654 | 2,156 | 2,499 | 2,670 | 0.6 |
|
|
|||||||||||||||
| Idaho | 358 | 358 | 366 | 357 | - 0.3 | 8.7 | 8.3 | 8.2 | 8.0 | - 8.0 | 3,111 | 2,970 | 2,998 | 2,859 | - 8.1 |
|
|
|||||||||||||||
| Oregon | 316 | 311 | 317 | 316 | 0.0 | 9.8 | 8.7 | 8.4 | 8.3 | - 15.3 | 3,092 | 2,708 | 2,663 | 2,622 | - 15.2 |
|
|
|||||||||||||||
| 1 Multnomah Foundation | 311 | 312 | 322 | 320 | 2.9 | 11.0 | 9.9 | 9.6 | 9.3 | - 15.5 | 3,422 | 3,090 | 3,089 | 2,978 | - 13.0 |
| 2 Greater Oregon | 318 | 311 | 315 | 314 | - 1.3 | 9.2 | 8.0 | 7.9 | 7.8 | - 15.2 | 2,923 | 2,486 | 2,486 | 2,448 | - 16.3 |
| Washington | 323 | 325 | 328 | 327 | 12.4 | 7.8 | 7.6 | 7.6 | 7.6 | - 2.6 | 2,517 | 2,466 | 2,491 | 2,484 | - 1.3 |
Office of Research
Office of Research, Demonstrations, and Statistics
Health Care Financing Administration
Figure 2. HEW Regional Boundaries.

Figure 3. Percent Distributions of PSRO Areas by Change in Discharge Rates, Average Length of Stay, and Days-of-Care Rates, for Medicare Beneficiaries, aged 65 and over, 1974-77.

In contrast, for average length of stay, most of the PSRO areas are to the left of the “no change” point, showing that average length of stay decreased in nearly all PSRO areas. The figure indicates that for 32 percent of the PSRO areas, ALOS decreased 5 to 7 percent and, for 33 percent of the PSRO areas, ALOS decreased 8 to 13 percent.
The result of these opposite trends are reflected in the days-of-care rate, with the last graph in figure 3 illustrating the relatively even distribution of PSRO areas around the “no change” point. The figure shows that for 22 percent of the PSRO areas the days-of-care rate changed 1 percent or less and for 57 percent of the PSRO areas the days-of-care rate changed 4 percent or less.
It has sometimes been hypothesized that the greatest declines in utilization are more likely to occur in areas where utilization is highest and the least declines in areas where utilization is lowest. Analysis of the data for all PSRO areas for each of the three utilization measures show mixed results. For the discharge rate--which did not decrease but increased in most areas--the hypothesis is somewhat confirmed. The discharge rate for the Nation in 1974 was 326 discharges per 1,000 enrollees with the rate ranging in the Nation from a high of 453 to a low of 244. The 20 PSRO areas with the greatest declines (or smallest rises) during the period 1974-77 had an average discharge rate of 355 in 1974 whereas the 20 areas, with the least declines (or greatest rises) in the discharge rate had an average of only 274 discharges in 1974.
For ALOS, the hypothesis does not appear to hold true. The average length of stay in the Nation was 11.6 days in 1974, ranging from a high of 18.4 to a low of 7.5 days. The 20 PSRO areas with the greatest declines during this period had an average stay in 1974 of 12.3 days, a figure that was identical to the average for the 20 PSRO areas with the least declines during this period.
The changes in the days-of-care rate for this period do not confirm the hypothesis either. The days-of-care rate for the Nation in 1974 was 3,777 days per 1,000 enrollees, with the rate ranging from a high of 5,283 days to a low of 2,037 days. The 20 PSRO areas with the greatest declines during this period averaged 3,797 days per 1,000 in 1974 compared to the 20 PSRO areas with the least declines (or greatest rises) which averaged 3,583 days per 1,000--rates that are not notably different from the mean for the Nation. Further, two PSRO areas in the United States that experienced decreases of 16 percent and 13 percent in the days-of-care rate (the greatest declines recorded) had rates in 1974 that were 2,923 and 2,881 days per 1,000 respectively. These figures were considerably below the mean that year.
Cross-sectional Analysis of Hospital Utilization by PSRO Area, 1977
Also studied were 1977 utilization rates at the PSRO level. Analysis of the data indicated a dramatic range in all three measures of use.
Discharge Rates
An examination of discharge rates by PSRO area (table 1) revealed almost a two-fold difference between the lowest rate of 257 per 1,000 enrollees in the Pacific PSRO in Hawaii 5/ and the highest discharge rate of 468 per 1,000 enrollees in Texas PSRO area 1. Table 2 shows the 20 PSRO areas with the highest and the 20 with the lowest discharge rates in 1977. The PSRO areas with the highest discharge rates are predominantly large rural areas located in the central and southern parts of the country. Of the 20 PSRO areas with the lowest discharge rates, 15 are in the Northeast and include the PSRO areas consisting of the cities of Baltimore and Washington, D.C., the boroughs of Brooklyn and Queens, the Hartford metropolitan area, and two PSRO areas in northern New Jersey.
TABLE 2. Discharge rates in short-stay hospitals for Medicare beneficiaries aged 65 and over, in highest- and lowest-ranking PSRO areas, 1977.
| (Hospital-based data adjusted for patient origin) | ||
|---|---|---|
| No. | PSRO Area Name and State |
Discharge rate (Per 1,000 enrollees) |
| Highest ranking | ||
| 4501 | Texas 1/ | 468 |
| 2605 | Southeast Missouri, Missouri | 453 |
| 1902 | Southwest Louisiana, Lousiana | 452 |
| 4504 | Texas 1/ | 450 |
| 2500 | Mississippi Foundation, Mississippi. | 446 |
| 3500 | North Dakota Health Care Review, North Dakota | 443 |
| 1700 | Kansas Foundation, Kansas | 440 |
| 1001 | Foundation for PSR, Florida, | 433 |
| 0400 | Arkansas Foundation, Arkansas | 431 |
| 4300 | South Dakota Foundation, South Dakota | 429 |
| 1901 | North Lousiana, Lousina | 426 |
| 4505 | Texas 1/ | 422 |
| 4508 | Texas 1/ | 421 |
| 2602 | Mid-Missouri, Missouri | 417 |
| 1407 | Illinois 1/ | 415 |
| 2700 | Montana Foundation, Montana | 413 |
| 2800 | Nebraska 1/ | 410 |
| 1408 | Southern Illinois Illinois | 409 |
| 4507 | Texas 1/ | 408 |
| 1903 | Louisiana Medical Standards, Louisiana | 408 |
| Lowest ranking | ||
| 4000 | Foundation of Peurto Rico, Puerto Rico | 228 |
| 1200 | Pacific PSRO, Hawaii | 257 |
| 2105 | Central Maryland, Maryland | 269 |
| 0702 | Area II PSRO, Connecticut | 269 |
| 0900 | National Capital, District of Columbia | 273 |
| 3314 | Queens County New York | 273 |
| 3313 | Kings County, New York | 275 |
| 3909 | South Central Pennsylvania, Pennsylvania | 279 |
| 0512 | Monterey Bay Area, California | 280 |
| 0509 | Santa Clara Valley, California | 280 |
| 2102 | Baltimore City, Maryland | 281 |
| 3103 | Bergen County, New Jersey | 283 |
| 3904 | Eastern Pennsylania, Pennsylvania | 284 |
| 0704 | Eastern Connecticut, Conecticut | 284 |
| 0511 | Fresno-Madera, California | 285 |
| 3102 | Passaic Valley, New Jersey | 286 |
| 3315 | Nassau Physicians Review, New York… | 287 |
| 0703 | Hartford Physicians Review, New York | 287 |
| 2103 | Montgomery County, Maryland | 287 |
| 3107 | Area 7 Physicians Review, New Jersey | 288 |
PSRO contract not yet awarded.
To determine the amount of variation within HEW regions, the data in table 3 were assembled to show the range in the utilization measures. Within each region, the values for the PSRO areas with the highest and lowest discharge rate, average length of stay, and days-of-care rate are shown.
TABLE 3. Short-stay hospital use by Medicare beneficiaries aged 65 and over, by HEW region, 1977.
| (Hospital-based data adjusted for patient origin) | ||||
|---|---|---|---|---|
|
| ||||
| Region and PSRO | Discharge rate (Per 1,000 enrollees) | Average length of stay (Days) | Days of care rate (Per 1,000 enrollees) | |
| Total U.S. | 346 | 10.9 | 3.767 | |
|
|
||||
| Boston | 320 | 12.0 | 3,834 | |
| Highest PSRO | 367 | 13.1 | 4,311 | |
| Lowest PSRO | 269 | 10.0 | 2,841 | |
| New York | 1/ 296 | 14.4 | 4,266 | |
| Highest PSRO | 377 | 17.1 | 5,123 | |
| Lowest PSRO | 273 | 12.0 | 3,657 | |
| Philadelphia | 322 | 12.3 | 3,960 | |
| Highest PSRO | 390 | 14.9 | 4,644 | |
| Lowest PSRO | 269 | 10.3 | 3,260 | |
| Atlanta | 365 | 10.0 | 3,651 | |
| Highest PSRO | 446 | 12.9 | 4,458 | |
| Lowest PSRO | 294 | 8.7 | 2,705 | |
| Chicago | 347 | 11.5 | 3,995 | |
| Highest PSRO | 415 | 13.6 | 4,575 | |
| Lowest PSRO | 312 | 9.4 | 3,231 | |
| Dallas | 406 | 9.3 | 3,772 | |
| Highest PSRO | 468 | 12.0 | 4,243 | |
| Lowest PSRO | 329 | 8.3 | 2,945 | |
| Kansas City | 399 | 10.8 | 4,311 | |
| Highest PSRO | 453 | 12.8 | 4,932 | |
| Lowest PSRO | 360 | 9.7 | 3,829 | |
| Denver | 385 | 9.0 | 3,468 | |
| Highest PSRO | 443 | 9.5 | 4,209 | |
| Lowest PSRO | 296 | 8.0 | 2,370 | |
| San Francisco | 319 | 9.1 | 2,905 | |
| Highest PSRO | 372 | 10.4 | 3,477 | |
| Lowest PSRO | 257 | 7.1 | 2,022 | |
| Seattle | 326 | 7.9 | 2,575 | |
| Highest PSRO | 357 | 9.3 | 2,978 | |
| Lowest PSRO | 314 | 7.6 | 2,448 | |
Excludes Puerto Rico and Virgin Islands
The data in table 3 indicate that the variations in the discharge rate within regions are similar to the differences across regions. Within region 6 (Dallas), the difference in the discharge rate between the lowest and highest PSRO areas was 139 discharges per 1,000 enrollees. In region 2 (New York) the range was 104 discharges. By way of comparison, the difference in the regional discharge rate between the lowest region (New York) and the highest region (Dallas) was 110 discharges per 1,000.
Average Length of Stay
Observation of individual PSRO area measurements reveals that the highest average length of stay occurred in PSRO area 13 in New York (17.1 days) and was almost 2.5 times greater than the lowest rate of 7.1 days in PSRO area 11 in Central California (table 1). Nineteen of the 20 PSRO areas with the highest values of ALOS are in the Northeast and 19 of the 20 PSRO areas with the lowest values are in the West (table 4). Six areas (National Capital PSRO, Queens County PSRO, Kings County PSRO, Baltimore City PSRO, Bergen County PSRO, Nassau Physician Review PSRO) were in the group of 20 PSRO areas with the lowest values of discharge rates, as well as the 20 areas with the highest values of ALOS reflecting the fact that an inverse relationship often exists between the two measures.
TABLE 4. Average length of stay in short-stay hospitals for Medicare beneficiaries ages 65 and over, in highest- and lowest-ranking PSRO areas, 1977.
| (Hospital-based data) | ||
|---|---|---|
| No. | PSRO Area Name and State |
Average length of stay (in days) |
| Highest ranking | ||
| 3313 | Kings County, New York | 17.1 |
| 4800 | Virgin Islands Medical Institute | 16.5 |
| 3316 | Bronx Medical Services, New York | 16.4 |
| 3311 | New York County, New York | 16.2 |
| 3301 | Erie Region, New York | 16.1 |
| 3314 | Queens County, New York | 15.9 |
| 3105 | Hudson County, New Jersey | 15.3 |
| 3312 | Richmond County, New York | 15.3 |
| 3103 | Bergen County, New Jersey | 15.2 |
| 3912 | Philadephia, Pennsylvania | 14.9 |
| 2102 | Baltimore City, Maryland | 14.8 |
| 3315 | Nassau Physicians Review, New York | 14.6 |
| 3306 | Area VI of New York, New York | 14.6 |
| 3307 | Eastern New York, New York | 14.3 |
| 3104 | Essex Physicians Review, New Jersey | 14.1 |
| 3108 | Southern New Jersey, New Jersey | 13.8 |
| 3309 | Area 9, New York, | 13.8 |
| 0900 | National Capital, District of Columbia | 13.7 |
| 3317 | Suffolk Physicians Review, New York | 13.7 |
| 3308 | Area 8, New York | 13.7 |
| Lowest Ranking | ||
| 0511 | Fresno-Madera, California | 7.1 |
| 0501 | Redwood Cost Region, California | 7.2 |
| 0513 | Tulare-Kings, California | 7.3 |
| 5000 | Washington State, California | 7.6 |
| 0514 | Kern County, California | 7.6 |
| 0502 | Superior California, California | 7.7 |
| 3802 | Greater Oregon, Oregon | 7.8 |
| 0508 | San Joaquin Area, California | 7.8 |
| 0512 | Monterey Bay Area, California | 7.9 |
| 0517 | Ventura Area, California | 7.9 |
| 4600 | Utah PSRO, Utah | 8.0 |
| 2700 | Montana Foundation, Montana | 8.0 |
| 0504 | Greater Sacramento California | 8.0 |
| 1300 | Idaho PSRO, Idaho | 8.0 |
| 0527 | Riverside County, California | 8.2 |
| 1902 | Southwest Lousiana, Lousiana | 8.3 |
| 0200 | Alaska PSRO, Alaska | 8.3 |
| 0510 | Stanislaus-Merced-Mariposa, California | 8.4 |
| 0516 | Santa Barbara/San Louis Obispo, California | 8.5 |
| 3200 | New Mexico PSRO, New Mexico | 8.5 |
The data indicate that large variations in ALOS also occur within regions (table 3). In the New York region--with the greatest variation--the difference in ALOS between the lowest and highest PSRO area was 5.1 days. This difference was nearly as great as the 6.5 day difference between the ALOS values for the New York region and the Seattle region. In eight of the ten regions, differences in ALOS between the lowest and highest PSRO areas were 31 percent or more.
Days-of-Care Rates
The highest rate of days of care for an individual PSRO area was 5,123 per 1,000 enrollees in the Adirondack PSRO area--a rate more than 2.5 times greater than the lowest rate of 2,022 in PSRO area 11 in Central California (table 1). Nine of the 20 highest days-of-care rates occur in PSRO areas in New York State and 17 are east of the Mississippi River (table 5). The lowest rates of days of care are found, with only one exception, in PSRO areas in the West. PSRO areas in California alone account for 14 of the 20 lowest rates.
TABLE 5. Days-of-care rate in short stay hospitals for Medicare beneficiaries aged 65 and over, in highest- and lowest-ranking PSRO areas, 1977.
| (Hospital-based data adjusted for patient origin) | ||
|---|---|---|
| No. | PSRO Area Name and State |
Days-of-care rate (per 1,000 enrollees) |
| Highest ranking | ||
| 4800 | Virgin Islands Medical Institute | 6,446 |
| 3305 | Adirondack, New York | 5,123 |
| 3301 | Erie Region, New York | 5,108 |
| 1700 | Kansas Foundation, Kansas | 4,932 |
| 3312 | Richmond County, New York | 4,848 |
| 3316 | Bronx Medical Service, New York | 4,789 |
| 3307 | Eastern New York, New York | 4,730 |
| 3311 | New York County, New York | 4,721 |
| 3105 | Hudson County, New Jersey | 4,707 |
| 3313 | Kings County, New York | 4,704 |
| 3912 | Philadelphia, Pennsylvania | 4,644 |
| 3306 | Area VI, New York | 4,616 |
| 2603 | Central Eastern Missouri, Missouri | 4,604 |
| 3308 | Area 8, New York | 4,584 |
| 2305 | Professional Review--GLSC, Michigan | 4,575 |
| 1403 | Chicago Foundation, Illinois | 4,571 |
| 2308 | Southeastern Michigan, Michigan | 4,542 |
| 1407 | Illinois 1/ | 4,518 |
| 2602 | Mid-Missouri, Missouri | 4,504 |
| 3104 | Essex Physician Review, New Jersey | 4,504 |
| Lowest ranking | ||
| 0511 | Frenso-Madera, California | 2,022 |
| 0512 | Monterey Bay Area, Calfornia | 2,208 |
| 0501 | Redwood Coast region, California | 2,314 |
| 0513 | Tulare-Kings, California | 2,362 |
| 4600 | Utah PSRO, Utah | 2,370 |
| 4000 | Puerto Rico Foundation, Puerto Rico | 2,374 |
| 0508 | San Joaquin Area, California | 2,400 |
| 0504 | Greater Sacramento, California | 2,426 |
| 0509 | Santa Clara Valley, California | 2,433 |
| 3802 | Greater Oregon Oregon | 2,448 |
| 5000 | Washington State PSRO, Washington | 2,484 |
| 0527 | Riverside County, California | 2,504 |
| 1200 | Pacific PSRO, Hawaii | 2,514 |
| 0528 | Dan Diego/Imprial, California | 2,528 |
| 0516 | Santa Barbara/San Luis Obispo, California | 2,566 |
| 0517 | Ventura Area, California | 2,619 |
| 0514 | Kern County California | 2,667 |
| 0200 | Alaska PSRO, Alaska | 2,670 |
| 0503 | North Bay, California | 2,673 |
| 0502 | Superior, California | 2,704 |
PSRO contract not yet awarded.
Large variations in the days-of-care rate across PSRO areas occur within regions (table 3). Region 8 (Denver) had the greatest variation, ranging from 2,370 days per 10,000 enrollees in the lowest PSRO area to 4,209 days per 1,000 in the highest PSRO area. The days-of-care rate reflects the discharge rate and the average length of stay. Wennberg analyzed the importance of variations in the discharge rate compared to variations in the average length of stay in determining the consumption of patient days. The data studied were for 13 hospital service areas in Vermont and for the population under 21 years of age. He found that variations in the incidence of hospitalization, that is, variations in the discharge rate, for most pediatric conditions were more important than length of stay variations in determining the days-of-care rate. 6/
Medicare data for the aged population lead to opposite conclusions. The variation in length of stay is the more important factor in determining days of care used for the population aged 65 years and over. Of the 20 PSRO areas with the highest days-of-care rate (table 5), 11 were among the areas with extremely high ALOS (table 4). Similarly, of the 20 PSRO areas with the lowest days-of-care rate, 15 were among the areas with extremely low ALOS. Clearly, extremes in average length of stay have a strong impact on the days-of-care rate for the aged population. The same strong influence on the days-of-care rate is not found for extremes in the discharge rates. Areas with the highest (or lowest) discharge rates (table 2) are not frequently found to be the same areas with the highest (or lowest) days-of-care rates.
PSRO area 13 in New York illustrates the effect that extremes in average length of stay can have. Despite the fact that the discharge rate in PSRO area 13, New York, was among the lowest in the Nation, the impact of its high average length of stay places this area among the highest in the days-of-care rate.
In further support of this point, coefficients of determination (R2) were computed using Medicare data from each of the PSRO areas. The discharge rate was found to explain only 9 percent of the variation in days-of-care whereas ALOS explained 52 percent of the variation.
Relationships Between Utilization and Area Characteristics
Previous analyses of Medicare data have indicated that patient characteristics of age, sex, and race influence short-stay hospital utilization, with age being one of the strongest factors.
The rate of discharge and the average length of stay both increase substantially with age. Men have a slightly higher discharge rate compared to women, but men have a lower average length of stay. White persons have a higher discharge rate compared to persons of all other races, but white persons have a lower average length of stay.
Medicare data also have shown that population density tends to be related to hospital utilization. In general, discharge rates are higher in sparsely populated areas compared to more densely populated areas, although sparsely populated areas tend to have lower average lengths of stay.
Many investigators have examined area resource factors to determine if there are relationships between the supply of health care resources and utilization. Factors that are often considered are the supply of short-stay hospital beds as well as hospital occupancy rates, the supply of long-term beds, the supply of physicians, and the presence of teaching or specialty hospitals.
Given these considerations, nine factors were selected to determine their influence on PSRO area hospital utilization. The variables selected were (1) proportion of enrollees aged 75 and over; (2) proportion of female enrollees; (3) proportion of nonwhite enrollees; (4) population density; (5) short-stay hospital bed supply; (6) nursing home bed supply; (7) physician supply; (8) influence of teaching hospitals; and (9) hospital occupancy rates.
Partial Correlation
Table 6 shows partial correlation coefficients derived from the regression models for ALOS, discharge rate, and days-of-care rate. 7/ Blank cells indicate that the partial correlation coefficients were not statistically significant at the 95 percent level.
TABLE 6. Partial Correlation Coefficients 1/ of ALOS, Discharge Rate, Days-of-Care Rate with Independent Variables for all PSRO Areas, 1976.
| ALOS | Discharge Rate | Days-of-Care Rate | |
|---|---|---|---|
| Age (percent 75 and Over) | r=.24 (t=3.3) | .15 (2.0) | .30 (4.3) |
| Race (percent Nonwhite) | |||
| Population Density (per sq. mi.) | .38 (5.5) | .26 (3.7) | |
| Nursing Home Beds (per 1000 enrollees) | |||
| Physicians (per 1000 enrollees) | -.30 (-4.3) | -.30 (-4.3) | |
| Teaching Hospitals (percent admission) | .16 (2.2) | ||
| Occupancy (percent) | .73 (14.6) | -.26 (-3.7) | .48 (7.5) |
The partial correlation coefficients were calculated from the formula:
Where vxi · T denotes the partial correlation of y and xi; i = 1,2,…7 and T denotes the full subset of the remaining 6 variables whose values are held fixed.
t is given by b̂i/σ̂bi where b̂i are the regression coefficients in the model with all variables entered and σ̂bi are their associated standard errors.
n is the number of independent observations (n = 190).
The proportion of enrollees over age 75 correlated positively with all three measures of use (though only minimally with discharge rate). These results were expected and confirmed earlier findings from Medicare data. Population density correlated highly with ALOS and days-of-care rate suggesting that in more densely populated areas--where ambulatory services are generally available--a higher proportion of hospitalized patients have more severe illnesses, requiring longer stays. In sparser populated areas, the shorter ALOS suggests that a higher proportion of patients are hospitalized with less severe illnesses--that would have been treated on an outpatient basis had those services been available.
Although it has often been suggested that a low supply of nursing home beds results in longer hospital stays, the absence of any correlation between the supply of nursing home beds and ALOS may indicate that this explanation for longer stays in some areas does not hold.
The supply of physicians in a PSRO area correlated inversely with the discharge rate and days-of-care rate, suggesting the effect of the availability of alternatives to inpatient care upon hospitalization rates.
The percentage of admissions to teaching hospitals was slightly correlated with ALOS which may indicate the combined effects of more complicated case load and training programs upon duration of inpatient stays.
Hospital occupancy rates correlated positively with ALOS and days-of-care rate and correlated negatively with discharge rate. By far these were the most significant correlations observed.
The demographic and health resource variables explained 76 percent of the variation in ALOS, 49 percent of the variation in discharge rate, and 60 percent of the variation in days-of-care rate. Demographic variables (age, sex, race, population density) accounted for two-thirds of the explained variation in ALOS but only one-third of the explained variation in discharge rate and days-of-care rate.
Predictions
Data presented earlier in this report indicate that ALOS values in PSRO areas in the northeastern HEW regions are significantly higher than those in the western HEW regions. Prediction models for ALOS in these two areas were developed and appear in table 7. (The northeastern area includes HEW regions 1, 2, and 3; the western area includes HEW regions 8, 9, and 10.) The model for the Northeast has an R2 value of .67, a maximum residual value of 3.2 days, and an average residual value of .8 days and may be used to predict ALOS in the Northeast.
Table 7. Prediction Models for ALOS in the Northeast and West (Regression Coefficient and t values).
| Explanatory Variable | Northeast HEW Region 1-2-3 | West HEW Region 8-9-10 |
|---|---|---|
| Age (percent 75 and Over) | 18.4483 (1.5) | -18.9338 (-1.8) |
| Sex (percent Female) | 15.0974 (1.1) | 25.3719 (2.7) |
| Race (percent Nonwhite) | 5.2844 (1.8) | 2.4790 (1.7) |
| Population Density (per sq. mi.) | .00009 (4.5) | .00008 (.8) |
| Short Stay Beds (per 1000 enrollees) | .1017 (.8) | .4645 (3.1) |
| Nursing Home Beds (per 1000 enrollees) | .1037 (.8) | .0064 (.1) |
| Physicians (per 1000 enrollees) | -.3953 (-1.4) | -.4918 (-1.3) |
| Teaching Hospital (ercent admissions) | -.0060 (-.7) | .0081 (1.1) |
| Occupancy (percent) | .2214 (5.4) | .0469 (1.3) |
| Constant | -21.9396 | -3.2408 |
| R2 | .67 | .67 |
| F | 11.3 | 6.0 |
| N | 61 | 36 |
Three arbitrarily selected PSRO areas in the West (Redwood Coast Region, Superior California, Tulane-Kings Counties) each had low values of ALOS in 1976 (7.3 days, 8.0 days, 7.4 days). If the values of the nine independent variables for each of these three PSRO areas are entered into the model for the Northeast, predicted values of ALOS are 7.1 days, 7.3 days, and 7.7 days. Thus, these areas, if hypothetically placed into the northeastern regional grouping, would still have low values of ALOS. Actual ALOS values in the Northeast range from 10.2 to 19.9 days, considerably higher than any of these predicted by the model.
The same phenomenon occurs if characteristics of PSRO areas in the Northeast are substituted into the regression model for the West. The model for the West has an R2 value of .67, a maximum residual value of 1.0 days, and an average residual value of .5 days. Again, three PSRO areas were selected: New York County with an actual ALOS of 17.7 days; National Capital with an ALOS of 14.3 days; Philadelphia with an ALOS of 14.8 days. Predicted values of ALOS using the regression model for the West are 16.5 days, 13.6 days, and 12.7 days, respectively. In comparison to the range of ALOS values in the West (7.3 to 10.9 days), the predicted values indicate that these PSRO areas would also have high values of ALOS in the West.
These illustrations indicate that PSRO areas have high (or low) values of ALOS not necessarily because of their geographic location, but in large measure because of the characteristics of the area. The examples illustrate extreme cases, but emphasize the importance of the area-specific characteristics in explaining variations in ALOS.
Summary and Discussion
For some time it has been known that Medicare utilization in short-stay hospitals varies considerably by geographic area. The development of utilization data by PSRO area along with a method to estimate the population-at-risk for using services in a defined group of hospitals enabled the present analyses to be made.
Study of utilization measures over the period 1974 to 1977 indicates that the national pattern of an increasing discharge rate and a decreasing ALOS, established in the early years of the Medicare program, has been followed by individual PSRO areas. In the great majority of PSRO areas, the discharge rate rose while ALOS fell. Overall the days-of-care rate remained steady. This steadiness implies that the large rise in Medicare hospital expenditures has not been due to an increase in the use of hospital days, but to input price increases and changes in the nature of hospital services.
The reasons for the steady rise in the discharge rate and the steady decline in ALOS are not well understood. Other investigations with Medicare data are examining the roles of increases in the rate of persons using hospital care, increases in the rate of multiple hospitalizations, shifts in the distribution of discharges by length of stay interval and changes in case mix over time as possible contributing factors.
A tendency was noted for the smallest increases in the discharge rate to occur in areas that already had high rates. However, for ALOS there was no relation between initial value of ALOS and change in ALOS during the study period--some areas with low ALOS displayed large percentage decreases in ALOS.
Analysis also revealed that the days-of-care rate among PSRO areas was closely correlated with ALOS but not with the discharge rate. Areas with extreme values of days-of-care were likely to have extreme values of ALOS, while there was no relation between extremes in the days-of-care rate and extremes in the discharge rate. This finding on the importance of ALOS in determining consumption of hospital days, coupled with the finding of great variation in ALOS among PSRO areas, may indicate that increased emphasis should be placed on review of length of stay in high ALOS areas. Considerably fewer hospital days would be used if the ALOS in areas with very high values could be brought closer to the national average (while, of course, holding the discharge rate constant).
Area characteristics expected to have some relation to hospital use were examined as possible factors contributing to variations in hospital use measures. The results of correlation and regression studies indicate that variations in population density, physician supply, and a supply measure related to population density--short-stay hospital bed supply--are associated with variations in measures of hospital use. The demographic characteristics of Medicare enrollees, the influence of teaching hospitals, and hospital occupancy rates in PSRO areas are also related to hospital use.
The significant relationships found between hospital utilization and supply of health services have important implications for PSRO program policy. The main components of PSRO activity--concurrent review of hospital cases, retrospective review of care via medical care evaluation studies (MCEs) and profile analyses--have focused on physician and hospital behavior in order to reduce misutilization and improve the quality of health care. The present study seems to show that changes in the supply variables and changes in occupancy rate can also have a great impact on levels of hospital utilization. Thus, PSROs in areas greatly above or below the utilization norms should look to variations in supply variables, as well as to physician practice patterns, for explanation. Where problems in utilization patterns are uncovered, attention should be given to alterations in the availability of services. This means that PSROs need to work closely with other programs, such as the Health Planning Program, whose purpose is to rationalize the amount and types of health facilities and services.
Technical Note
Included here are information on data sources used, an example illustrating the methodology for estimating population-at-risk, a discussion of its limitations, and the formula for the sampling error associated with hospital-based rates.
Data Sources
Medicare data used in this report were derived primarily from three basic files maintained centrally in the Medicare Statistical System:
The master enrollment file contains information about all Medicare enrollees including age, sex, race, and state and county of residence.
The hospital bill file contains information taken from the claim submitted for payment, including dates of admission and discharge.
The provider file contains information about certified Medicare providers such as the location of the hospital, number of beds, and teaching status.
For 100 percent of hospital stays in the Nation, one record was created that contained information taken from all three files listed above. Two additional data elements were incorporated into the record to indicate (1) the PSRO area where the patient resided and (2) the PSRO area where the hospital stay occurred.
All hospital stays that occurred in the period 1974 through 1977 and processed centrally as of March 1978 were included in the file. The file contains about 95 percent of all hospital stays in a year within 3 months after the end of the year and about 98 to 99 percent within 15 months after the end of the year. Although there was only a small shortfall in the file, another more current file (query file) was used to correct the shortfall. The query file comes from the system employed by fiscal intermediaries to query the Medicare central office on eligibility and benefits available to Medicare patients admitted to a hospital. This file, which contains nearly a complete count of all admissions within a month after they occur, was used in conjunction with the hospital bill file to obtain complete counts of hospital stays.
Example Illustrating Adjustment for Patient Migration
The diagram below represents a hypothetical configuration using only four PSRO areas. The number of enrollees-at-risk to hospital care in PSRO area 1 is calculated by allocating a portion of the enrollees from each of the four PSRO areas. The proportion is based upon the fraction of total discharges for residents of each of the four PSRO areas which occurred in hospitals in PSRO area 1.
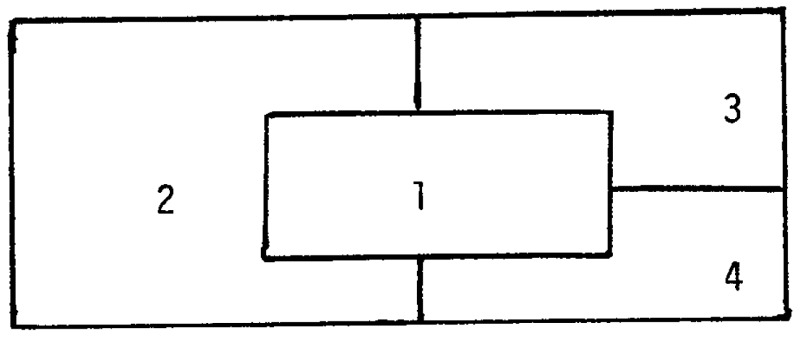
The patient origin matrix below shows the total number of discharges for residents of each of four PSRO areas and the location of the hospitals in which the discharges occurred. Suppose for residents of area 1 there were a total of 32,500 discharges of which 30,000 were from hospitals located in area 1; 500 discharges from hospitals in area 2; 1,250 discharges from hospitals in area 3; and 750 discharges from hospitals in area 4. Similarly, for residents of area 4, there were a total of 30,250 discharges of which 4,000 were from hospitals in area 150 from hospitals in area 2; 100 from hospitals in area 3; and 26,000 from hospitals in area 4.
| PSRO Area Where Discharge Occurred | Discharges for Residents of PSRO Areas | |||
|---|---|---|---|---|
|
|
|
|||
| PSRO 1 | PSRO 2 | PSRO 3 | PSRO 4 | |
|
|
||||
| PSRO 1 | 30,000 | 6,000 | 5,000 | 4,000 |
| PSRO 2 | 500 | 5,750 | 500 | 150 |
| PSRO 3 | 1,250 | 1,000 | 20,000 | 100 |
| PSRO 4 | 750 | 250 | 200 | 26,000 |
|
| ||||
| Total | 32,500 | 13,000 | 25,700 | 30,250 |
To estimate the beneficiaries-at-risk in PSRO area 1, the proportion of total discharges from hospitals in PSRO area 1 is determined for each possible PSRO area of residence. A fraction of enrollment from each area is then allocated to PSRO area 1 based upon the fraction of discharges that occurred in PSRO area 1. The calculation is demonstrated in the following chart.
Patient Origin Matrix.
| (1) | (2) | (3) | (4) (3)÷(2) |
(5) | (6) (4)×(5) |
|---|---|---|---|---|---|
| Residence of beneficiary | Total Discharges | Discharges from hospitals in PSRO 1 | Proportion of total discharges from hospitals in PSRO 1 | Medicare enrollment | Enrollment allocated to PSRO 1 |
| PSRO 1 | 32,500 | 30,000 | .92 | 75,000 | 69,000 |
| PSRO 2 | 13,000 | 6,000 | .46 | 30,000 | 13,800 |
| PSRO 3 | 25,700 | 5,000 | .19 | 30,000 | 5,700 |
| PSRO 4 | 30,250 | 4,000 | .13 | 50,000 | 6,500 |
|
| |||||
| Total | 101,450 | 45,000 | 185,000 | 95,000 | |
Limitations in Methodology to Produce Hospital-Based Rates
The need to develop information to compare the rate of hospital use in one area with the rate of hospital use in another area, as well as to analyze changes over time, led to the development of a method to produce hospital-based measures. The validity of this method depends upon its basic assumption that a population-at-risk can be constructed by observing where the patients come from. Although future efforts could refine the calculation, for example, by taking into account the characteristics of the patients, such as age, sex, and race, and relating them to the allocation of enrollees, there would remain some limitations that are inherent in the basic approach.
One inherent limitation is that hospital-based rates as constructed here are subject to a “dampening” phenomenon. If, for example, the number of discharges in a specific PSRO area is reduced due to PSRO review--while the number of hospital stays remains constant in all other areas--the new discharge rate for the second year in the PSRO area in which utilization was reduced will register a smaller reduction than actually occurred. This result stems from the methods used to generate the denominator for the rate. Because the proportion of total discharges received in the PSRO area declined, the number of enrollees allocated to the population-at-risk to services in the PSRO area automatically declines. At the same time, the other PSRO areas are necessarily allocated more enrollees, thus falsely decreasing their discharge rate.
Another limitation of the methodology is that different estimates for population-at-risk result when different geographic units are used. For example, the population-at-risk for a particular PSRO area will be different depending on whether data on patient origin are aggregated by PSRO area or country.
Sampling Errors
In the calculation of enrollees-at-risk required for hospital-based rates, the information contained in the patient-origin matrix is based upon a 20 percent sample file of inpatient bills. Thus, there is a sampling error associated with the estimated number of enrollees-at-risk in each PSRO area. The error is given by the following formula:
Where Ei = Estimated total number of Medicare enrollees at risk in the ith PSRO area
dij = Number of discharges from hospitals in the ith PSRO area of patients who resided in the jth PSRO area
Dj = Total number of discharges of patients who resided in the jth PSRO area
ej = Medicare enrollment in the jth PSRO area
n = Total number of PSRO areas
Since the denominator used for the rate calculation (enrollees-at-risk) is an estimate, the rate itself is an estimate whose standard error is given by
Where K in the numerator of the expression above is either discharges of days-of-care. Table T1 which contains the standard errors for both the discharge rate and days-of-care rate for all PSRO areas is available upon request.
Acknowledgments
Many individuals in the Office of Statistics and Data Management contributed to the design and development of data used in this report. Special acknowledgments are made to Irving Goldstein, who designed a major modification to the flow of data resulting in the timely production of hospital data by PSRO area, and to Carol Walton, who contributed to the design of computer techniques for generating patient origin and destination data.
Nathaniel M. Pigman, Jr., and James C. Beebe of the Statistical and Research Services Branch provided statistical consultation, advice, and assistance in developing hospital-based rates and in computing their standard errors.
The Statistical Services Unit in the Office of Research, supervised by Kathryn D. Barrett, provided considerable assistance in producing the data presented in this article.
References
- 1/.Tables similar to those presented in this report by PSRO area have been developed by health service area and will be made available to all Health Systems Agencies.
- 2/.The “Health Planning and Resources Development Act of 1974” authorized the creation of Health Systems Agencies (HSAs) in about 200 Health Service Areas Nation-wide to carryout various health planning functions in their areas.
- 3/.Bailey Norman TJ. Statistics in Hospital Planning and Design. Applied Statistics. 1965 Nov;:146–157. [Google Scholar]
- 4/.The data presented in this article were also used as the basic data set in the 1978 PSRO evaluation study. It is important to note that in the PSRO evaluation study, regression analysis techniques were used to focus on changes in utilization from 1974 to 1977, after adjusting for variables (e.g., hospital bed supply) which might affect PSRO impact. Consequently, actual changes in use rates shown in table 1 will differ from the regression result of the PSRO evaluation study. These differences are also discussed on page 67 of the 1978 PSRO evaluation study (HEW Pub. No. HCFA-03000, Jan. 1979).
- 5/.Only PSRO areas in the 50 States were considered.
- 6/.Wennberg John E. A Small Area Epidemiologic Approach to Health Care Data. Proceedings of the Public Health Conference on Records and Statistics; June 14-16, 1976; pp. 334–351. [Google Scholar]
- 7/.To check for multicollinearity, all explanatory variables were entered stepwise into the regression model and successive lists of regression coefficients were examined for stability. Two variables--short-stay bed supply and proportion of female enrollees--were correlated with other variables causing unstable regression coefficients. The r-values in table 6 are derived from regression models which do not include these two variables.