Abstract
Prospective reimbursement (PR) programs attempt to restrain increases in hospital expenditures by establishing, in advance of a hospital's fiscal year, limits on the reimbursement the hospital will receive for the services it provides to patients. We used data compiled from a sample of approximately 2700 community hospitals in the U.S. for each year from 1969 to 1978 to estimate the effects of prospective reimbursement programs on hospital expenditures per patient day, per admission, and, to a lesser extent, per capita.
The statistical evidence indicates that some PR programs have been successful in reducing hospital expenditures per patient day, per admission, and per capita. Eight programs—in Arizona, Connecticut, Maryland, Massachusetts, Minnesota, New Jersey, New York, and Rhode Island—have reduced the rate of increase in expenses by 2 percentage points or more per year and, in some cases, by as much as 4 to 6 percentage points. There are indications, although less strong, that PR programs also reduced expenses in Indiana, Kentucky, Washington, western Pennsylvania, and Wisconsin. There are no indications of cost reductions for programs in Colorado and Nebraska.
An analysis of the relative effectiveness of the various programs suggests that mandatory programs have a significantly higher probability of influencing hospital behavior than do voluntary programs. Some voluntary programs, however, are shown to be effective.
The continuing high rate of inflation in hospital expenditures is a serious national economic problem. Between 1965 and 1979, hospital expenses per day of inpatient services rose at an average rate of 12.6 percent per year, more than twice the average rate of increase in consumer prices for other goods and services. An average patient day cost $44 in 1965; the corresponding cost in 1979 was $260, almost six times higher.1 The extraordinary increase in hospital expenditures imposes a large burden on society—in the form of higher taxes to pay for the Medicare and Medicaid programs, higher employer contributions for health insurance benefits, and higher out-of-pocket expenditures by consumers. Consumers would now be saving, directly or indirectly, $34 billion per year, or 1.4 percent of the Gross National Product, if some cost containment program had existed to eliminate just half the 1965-1979 differential in inflation rates between the hospital industry and other sectors of the economy. The need to restrain further excessive increases in hospital expenditures is clear, but the best mechanism for achieving this important objective is the subject of considerable debate.
Prospective reimbursement (PR) programs are promising mechanisms for controlling hospital expenditures. Approximately 30 PR programs are currently in operation, run by State agencies, Blue Cross Plans, or State hospital associations. Their importance rests on their ability to establish prospective limits on the hospitals' budgets or the reimbursements they receive for their services. In the absence of such progams, most hospital reimburement is determined retrospectively, to cover the costs that hospitals have actually incurred. Theoretically, PR programs put hospitals at risk for uncontrollable increases in cost by reimbursing for only those cost increases that have been approved in advance.
Impetus for PR programs came from both the State and Federal levels. In the late 1960s, a number of States placed ceilings on year-to-year increases in rates charged for hospital care. These state-wide uniform limits were too inflexible to deal with the special problems of individual hospitals and were inconsistent with Federal regulations for reimbursement under Medicare and Medicaid. With Federal support authorized by Section 222(a) of the 1972 amendments to the Social Security Act and by earlier legislation, or with their own funding, several State-operated PR programs were introduced. Blue Cross Plans and State hospital associations also initiated voluntary programs, designed to help hospitals improve their fiscal management and planning.
In 1974, the Office of Research and Statistics of the Social Security Administration funded evaluations of several of the early prospective reimbursement programs.2 The results of these studies were ambiguous. Lack of maturity of the programs; methodological limitations of the evaluations; and the confounding, if not dominating, influence of the Economic Stabilization Program hampered detection of any impact programs might have had on hospital expenditures and revenue (Hellinger, 1978). The usefulness of the early evaluations has been further reduced by important changes in PR programs which attempted to rectify the shortcomings of early programs, by experimenting with new approaches to budget review and reimbursement controls; and by giving significantly greater legal authority to the PR programs. Thus, current PR programs do not resemble the programs that were evaluated in 1974 and 1975.
In 1978, the Health Care Financing Administration (HCFA) funded a new evaluation of PR programs, the National Hospital Rate-Setting Study (NHRS). That year the NHRS prepared case studies3 of nine PR programs, detailing the evolution, organizational structure, budget-review and rate-setting procedures, and administrative costs of PR programs in nine locations: Arizona, Connecticut, Maryland, Massachusetts, Minnesota, New York, New Jersey, western Pennsylvania, and Washington.
Preliminary evaluations of the effects of these nine programs on various aspects of hospital operations will be reported in a series of research papers. The study ultimately will estimate the effects of these programs on: hospital expenditure, revenue, and financial status; volume and composition of patient services; use of capital and labor, wage rates, and productivity; availability of special facilities and services, and investment in plant and equipment; various process measures and health outcomes thought to be related to quality of care; and accessibility of hospital services to the elderly and other economically disadvantaged groups. The NHRS will give primary attention to the effects of programs on cost, quality, and access.4
The objective of this paper is to provide preliminary estimates of the effects of PR programs on hospital expenditures. The first section (Hypothesized Relative Effectiveness of Different Types of Prospective Reimbursement Programs) provides a brief summary of the characteristics of the PR programs being studied and presents an hypothesized ranking of their relative effectiveness. The second section (Statistical Methodology) describes the statistical methods used to measure program effects. The sources and quality of the data used in the analysis are discussed in the third section (Data: Source and Quality). The last two sections (Econometric Results; and Elaboration and Discussion of the Estimated Effects of Prospective Reimbursement) present the study's results and discuss their implications and limitations.
Hypothesized Relative Effectiveness of Different Types of Prospective Reimbursement Programs
The nine PR programs selected by the Health Care Financing Administration for detailed evaluation in the NHRS represent a broad cross-section of programs currently in existence (see Table 1). Although some programs have been in existence for nine or ten years, most were initiated in 1974 or 1975. The programs are operated by independent public commissions, agencies within State Departments of Health, a hospital association, and a Blue Cross Plan.
Table 1. Comparison of Basic Program Characteristics Among NHRS Primary Study Group States.
| STATE/AREA | YEAR IMPLEMENTED | TYPE OF AGENCY | DATE AND NATURE OF MAJOR CHANGES | TYPE OF REVIEW |
|---|---|---|---|---|
| Arizona | 1972 | Department of Health and Health Systems Agencies | 1976: uniform financial reporting implemented | Subjective review; few standardized guidelines and criteria; substantial negotiation; hearings |
| Connecticut | 1974 | independent Commission | 1976: new methodology much more systematic; use of interhospital comparisons | Review with standardized guidelines and criteria; negotiation; hearings; detailed review by exception |
| Maryland | 1974 | Independent Commission | 1976: rates for some hospitals set on basis of cost per case by diagnosis; 1977: Medicaid and Medicare added to program | Review with standardized guidelines and criteria; negotiation; hearings; automatic inflation adjustment unless hospital requests detailed review |
| Massachusetts | 1974 | Independent Commission | 1975: prospective reimbursement introduced for commercially insured and uninsured; 1978: new methods for commercially insured and uninsured | Medicaid: totally formulary rate-setting; no hearing or negotiation; Charge-based Revenue: review with standardized guidelines and criteria; hearings; negotiation |
| Minnesota | 1974 | Hospital Association with Department of Health oversight | 1977: review became mandatory for all hospitals; oversight by Department of Health begun | Subjective review; few standardized guidelines and criteria; negotiations; hearings |
| New Jersey | 1969 | Department of Health | 1974: State took over operation from hospital association; 1976: new, very detailed and systematic review procedures begun | Review with standardized guidelines and criteria; negotiation; no hearings; detailed review by exception |
| New York | 1970 | Department of Health and Blue Cross | 1976: disallowances, from inter-hospital comparisons, tightened; 1977: length of stay penalty adopted; 1978: charge rate controls begun | Blue Cross/Medicaid: totally formulary rate-setting; no hearing or negotiation; Charge-based Revenue: maximum percentage increase in charge rates |
| Western Pennsylvania | 1971 | Blue Cross | 1973: hospitals could choose to have Medicare reimbursement controlled; 1976: new methods, Medicaid included | Subjective review; few standardized guidelines and criteria; negotiation; no hearings |
| Washington | 1975 | Independent Commission | 1977: new methods; experiment with alternative payment mechanisms; Medicare and Medicaid included in program | Review with standardized guidelines and criteria; negotiation; hearings; detailed review by exception |
All nine programs have undergone one or more major changes during their history. In some cases, legal authority to enforce PR controls has been increased, and programs have been given authority to review and control reimbursement from additional payors (for example, Medicare and Medicaid). In most programs, the methods used to review hospital budgets and to establish reimbursement limits have changed over time, but substantial diversity still exists. Some programs review hospital budgets in considerable detail; other programs do not. Some programs establish prospective limits through face-to-face negotiations with hospitals; other programs conduct no negotiations and use mathematical formulas and automatic disallowances of certain expenditures in establishing reimbursement limits. The diversity that exists among the nine programs makes them an ideal group to use to study the relative effects of alternative approaches to PR.
The NHRS has collected a substantial amount of qualitative information on the operating characteristics of the nine PR programs being evaluated. This information provides a basis for a priori ranking of the relative effectiveness of the nine programs in reducing the rate of inflation in hospital expenditures. Later in this paper, the qualitative ranking developed in this section is subjected to an empirical test against data for the period 1969 to 1978.
Several characteristics of PR programs are likely to affect the relative impact of the programs on hospital behavior. The following characteristics are among the most important.
Legal Authority
Mandatory programs are those with legal authority to require hospitals to submit to review and to force hospitals to comply with program rulings. A program is categorized as voluntary when either participation or compliance (or both) is left to the discretion of hospitals. If operating characteristics (for example, methods for reviewing budgets) are the same, mandatory programs are likely to be more stringent than voluntary programs. Voluntary programs are likely to have relatively little influence on hospital behavior unless public pressure is applied to produce high rates of participation and compliance. If negotiation is used to set prospective budgets, negotiators for mandatory programs do not have to balance efforts at cost containment against the chances that hospitals will refuse to comply with strict reimbursement controls. Such tradeoffs are important considerations to negotiators for voluntary programs.
Unit of Revenue Prescribed
Dowling et al. (1974) have argued that the unit of payment specified in the recommendations or rulings of PR agencies has an important influence on the incentives created by the programs. Programs that limit the total revenue of a hospital, rather than establish per diem or per case payment rates, create less incentive for hospitals to try to circumvent the system by increasing admissions and length of stay. Programs that control total revenue usually set a target level of revenue for the year and rely on hospitals to adjust charges so that the target is met. Unless compliance is assessed more than once a year in such systems, hospitals keep any excess revenue they generate from overcharging until the excess is deducted retroactively from a subsequent year's approved revenue allocation. Programs that set payment rates affect cash flow of the hospital immediately, without the lag usually generated by total revenue control programs. The most effective programs would limit total revenue but also set interim payment rates based on the approved budget.
Types of Revenue Directly Controlled
Most PR programs have legal authority over revenue received from some classes of patients only. Reimbursement from Medicare, for example, is covered by PR only in Maryland, Washington, and the 23 hospitals participating in the PR program in western Pennsylvania. The more classes of revenue controlled directly by the program (that is, the higher the percentage of hospital revenue covered), the lower the ability of the hospital to circumvent revenue controls for some classes of patients by raising prices charged to other, noncovered classes of patients. Some programs have legal authority over revenue received from only some classes of patients but place limits on the hospital's total revenue.5 To the extent that revenue controls in such programs cause hospitals actually to curtail expenditures, revenues from noncovered patients are likely to be affected indirectly.
Detail of Analysis
In many hospitals, high cost in one department may be offset by low cost in another department. For total expenses, the hospital's cost may be average for hospitals of its type. PR programs that screen costs at the department level may cut costs in such a hospital by excluding excess cost in the high-cost department while accepting current cost in the low-cost department. PR programs that screen costs only at an aggregate level might not cut cost in such a hospital at all. Thus, if the PR staff performs a detailed analysis, the potential is increased for disapproving some part of hospitals' budget requests. It is an empirical question whether the possibility of restraining revenue by using a detailed review outweighs the high administrative cost of such extensive review procedures.
Inclusion of Utilization Controls
Empty beds and excessive length of stay raise hospital costs. If PR programs set a per diem payment rate, hospitals attempting to maximize revenue may respond by increasing average length of stay. Programs that impose utilization penalties on hospitals, in the form of lower approved budgets or per unit rates, are likely to curtail revenues more than programs that do not impose such controls. In addition, such penalties provide relatively direct incentives for hospitals to increase bed use and reduce excessive length of stay, thereby restraining cost.
Scrutiny of Base Year Cost
Virtually all PR programs evaluate the reasonableness of proposed rate increases or proposed prospective budgets by comparing them to rates or expenditures in a base year. The most stringent PR programs first scrutinize base year spending to screen out excessive or unallowable (for reimbursement) expenditures. The more rigorous the scrutiny of base year spending, the lower the revenue or rate increase the program is likely to allow. Most programs assess base year spending by comparing spending in one hospital to spending in similar types of hospitals in the State or area. Two programs (New Jersey and Massachusetts) include an additional step: comparing screened base year actual spending to previously approved base year spending and then taking the lower of the two figures and adjusting for inflation to the year for which rates or budgets must next be approved. The least stringent programs perform no systematic scrutiny of base year spending before an inflation adjustment is applied.
Enforcement Mechanisms
Programs that permit voluntary compliance must rely on public pressure and the cooperation of hospitals to achieve implementation of their recommendations. A few systems with legal authority to enforce compliance make relatively little effort to do so. Others enforce compliance by retrospectively deducting excess revenue or spending from approved budgets or rates in subsequent years. Such programs may affect revenue with a lag (impact delayed one or more years). Programs that set payment rates based on their cost/revenue analysis produce compliance automatically, in the sense that hospitals' cash flows are immediately affected. The determination of payment rates is the surest and most immediate enforcement mechanism.
The nine PR programs included in the NHRS differ widely on the set of characteristics described above. Table 2 provides a comparative summary of the nine programs with respect to these characteristics.
Table 2. Comparison of Program Characteristics Affecting Rigor and Effectiveness.
| State/Area | Legal Authority | Unit of Revenue Prescribed | Type of Revenue Directly Controlled | Detail of Analysis | Inclusion of Utilization Control | Scrutiny of Base Year Cost | Enforcement Mechanism |
|---|---|---|---|---|---|---|---|
| Arizona | Review is mandatory; compliance is not required by law or contract | Total patient revenue and selected charge rates | Blue Cross Commercial Insurance Uninsured (No Medicaid program) | Aggregate measures and selected charge rates | No explicit limits or penalties | Not systematic; minimal use of interhospital comparisons to screen out excess base year cost; no retrospective comparison of base year cost and approved base year budget | No legal sanctions or retrospective deduction of excess revenue; bring public pressure to bear to produce voluntary compliance |
| Connecticut | Review and compliance required by law | Total patient revenue less contractual allowances | Commercial Insurance Uninsured | Review by exception to departmental cost level | No explicit limits or penalties | Use interhospital comparisons (criterion 110% of median for group) to screen out excess base year cost; apply inflation adjustment to lower of screened actual base year cost and inflation adjusted actual cost one year earlier | Legal sanctions available; deduct excess revenue from subsequent year's approved revenue |
| Maryland | Review and compliance required by law | Unit revenue by department or reimbursement per discharge by diagnosis | All patient revenue | Departmental level or average charge per discharge by diagnosis by payor category | No explicit limits or penalties | Interhospital comparisons (criterion, 80th percentile for group) to screen out excess base year cost; apply inflation adjustment to screened actual cost even if approved budget was lower | Legal sanctions possible; deduct excess revenue plus penalty from subsequent year's approved unit revenue |
| Massachusetts | Review is mandatory; Medicaid: ability to set rates allowed by law; Charge-Based Revenue: compliance is mandatory | Medicaid: per diem rate Charge-Based: total patient revenue | Medicaid Commercial Insurance Uninsured | Capital budgets, working capital and 16 functional categories of operating cost | Minimum occupancy rates built into Medicaid per diem rate | No interhospital comparisons for screening out excess cost; apply inflation adjustment to lower of base year actual cost and inflation-adjusted actual cost one or two years earlier | Medicaid: set payment rate; Charge-based legal sanctions possible to prevent further overcharging, but no ability to make retrospective deduction of excess revenue from subsequent year's approved revenue |
| Minnesota | Mandatory review; compliance not required by law but by Blue Cross contract for some hospitals | Total patient revenue | Blue Cross Commercial Insurance Uninsured | Aggregate measures and 16 functional cost categories | No explicit limits or penalties | Not systematic; interhospital comparisons for identification of potential problem areas; no comparison of actual and approved base year cost | No legal sanctions or retrospective deduction of excess revenue; public pressure for voluntary compliance |
| New Jersey | Review and compliance required by law | All-inclusive per diem rate | Medicaid Blue Cross | Review by exception to departmental cost level | No explicit limits or penalties | Interhospital comparisons (criterion, 110-150% of group median, depending on department); apply inflation adjustment to lower of screened actual and approved base year cost | Legal sanctions possible; set payment rate; deduct excess spending from subsequent year's approved rate |
| New York | Review and compliance required by law | Medicaid/Blue Cross: per diem rate; Charge-based; Increase in charge rates | All patient revenue except Medicare | Routine and ancillary cost | Minimum occupancy rates and maximum length of stay to Blue Cross/Medicaid rates | Interhospital comparisons (criterion, 100% of mean) to screen out excess base year cost; apply inflation adjustment to screened actual cost even if approved expenditure was lower | Legal sanctions possible; Medicaid/Blue Cross: set payment rate |
| Western Pennsylvania | Review and compliance required by contract with Blue Cross for hospitals that voluntarily choose to participate | Total revenue, but set per diem payment rate | Blue Cross, Medicaid and Medicare | Departmental costs | No explicit limits or penalties | Use statistical model fit to prior years' data to determine reasonableness of prospective budget; no retrospective comparison of actual and approved base year cost | Legal enforcement of contract possible; set payment rate; deduct 50% of excess spending from subsequent year's payment rate; increase future payment rate for 50% of underspending |
| Washington | Review and compliance required by law | Total patient revenue, but set payment rates for two-thirds of hospitals | All patient revenue | Review by exception to departmental cost level | No explicit limits or penalties | Interhospital comparisons (criterion, 70th percentile for group) to screen out excess rate year cost | Legal sanctions possible; set payment rates for two-thirds of hospitals; deduct excess revenues from subsequent year's approved revenues and payment rate |
The information provided in Table 2 provides a strong basis for assessing the relative potential of the nine PR programs for controlling hospitals' revenue or expenditures. The New York program appears to be relatively rigorous and stringent on most of the criteria identified. It is mandatory, covers all classes of revenue except Medicare, imposes very stringent interhospital cost comparisons, achieves relatively quick and automatic enforcement (by setting a prospective payment rate), and avoids the incentive to increase length of stay inherent in the per diem rate approach by imposing strong utilization controls. Maryland, New Jersey, and Washington as a group rank second on the set of criteria identified. Each has one or more areas in which its revenue controls are not as strong as those of other states (lower revenue coverage in New Jersey, failure to compare actual spending and the approved budget in the base year in Maryland, and emphasis on total rather than department-level cost review in Washington), but each has certain strengths that at least partially offset its weaknesses (for example, stringent scrutiny of base year spending in Washington land New Jersey, and quarterly compliance checks in Maryland). Connecticut and Massachusetts rank third as a group: Connecticut directly covers a relatively low percentage of revenue; Massachusetts performs relatively less detailed analysis than other states and has no power (for charge-based revenue) to retrospectively recoup excess revenue from approved budgets in subsequent years. In terms of apparent stringency of control, Arizona, Minnesota, and western Pennsylvania rank fourth as a group—because they are voluntary programs, perform only relatively aggregate cost/revenue analysis (except for western Pennsylvania) and perform only limited or nonsystematic scrutiny of base year spending.
Other factors may affect the outcome of empirical tests of relative program impact. Programs that are relatively stringent on qualitative criteria, but which have only recently been implemented, are likely to have less effect on hospital behavior than do somewhat less stringent but older programs. The initial characteristics of the hospital industry will also be important, for a modest program may have a larger effect on an initially high inflation rate than a stringent program will have on an initially low inflation rate. Finally, intangible qualitative factors—the forcefulness of program administrators and the power of the hospital industry—are not included in the basis of the rankings given above but are likely to exert a strong influence on empirical results.
Although the NHRS will focus on the nine programs discussed above, six other programs have been included in most of the statistical analyses to expand the range of program characteristics studied. These other programs are in: Colorado, Indiana, Kentucky, Nebraska, Rhode Island, and Wisconsin.
Of these six programs, three are voluntary (Indiana, Kentucky, and Nebraska); for the others, participation in the review process and compliance with PR limits are required by law for all hospitals (see Table 3). Because case studies have not been undertaken for these six programs, information about their operating characteristics has been obtained from secondary sources.6
Table 3. Comparison of Basic Program Characteristics Among NHRS Secondary Study Group States.
| STATE/AREA | YEAR IMPLEMENTED | TYPE OF AGENCY | DATE AND NATURE OF MAJOR CHANGES | TYPE OF REVIEW |
|---|---|---|---|---|
| Colorado | 1971 | Department of Social Services Blue Cross Colorado Hospital Commission | 1974: Blue Cross began a voluntary budget review and negotiation program; 1978: mandatory program under Colorado Hospital Commission begun; Blue Cross Program ended | Medicaid: Review and compliance required by law; budget review; negotiation; payment rate set; Blue Cross: voluntary participation; review with standardized guidelines; negotiation; interim payment rates set Commission: review and compliance required by law; budget review; negotiation |
| Nebraska | 1972 | Hospital Association | 1977: program ended | Voluntary review and compliance; department-level budget review without screens |
| Indiana | 1959 | Blue Cross Review Committee | Voluntary review and compliance; budget and review; individual contracts negotiated | |
| Rhode Island | 1971 | State Budget Office Department of Health Hospital Assoc. Blue Cross | 1972: state law enacted 1974: more stringent system instituted; adjusted for volume variance initiated |
Review and compliance required by law and by contract with Blue Cross; budget review; negotiations potentially extending through binding arbitration |
| Kentucky | 1974 | Blue Cross | Voluntary review; compliance required by Blue Cross contract; budget review; negotiation | |
| Wisconsin | 1974 | Department of Health Blue Cross Hospital Assoc. | Review and compliance required by law and by contract with Blue Cross; budget review; negotiations |
Statistical Methodology
The objective of the analysis presented here is to determine the effect of PR programs on hospital expenditures and to measure the relative effects of different programs. The analysis is preliminary, since the compilation of the final NHRS data base has not yet been completed (see discussion of data below). The method we used to test for program effects is as simple and straightforward as possible, to avoid an analysis more sophisticated than available data would support.
Several recent papers (for example, Biles et al., 1980) have purported to show the effects of PR programs on hospital expenditures by comparing the average annual inflation rate for hospital expenditures in States with PR programs to the corresponding rate for all States without PR programs. This method is not used here for several reasons. First, it provides no basis for determining whether interstate variations in inflation rates are due to the presence or absence of PR programs or to interstate differences in other factors that may influence hospital expenditures (for example, regional differences in health insurance coverage, physician/population ratios, and socioeconomic characteristics of the population). Since these interstate differentials are not statistically controlled, simple comparison of means may considerably overstate or understate the effects of PR. Second, simple cross-state tabulations provide no basis for determining the statistical significance of observed differences in average inflation rates across States. Without data on individual hospitals, one cannot determine whether inflation rates are consistently lower for hospitals covered by PR or whether the pattern is so inconsistent that interstate differences in average inflation rates could be due to chance. Finally, simple tabulations cannot be used to isolate the effects of PR programs from the effects of other regulatory programs imposed on hospitals. A set of cross-state comparisons of average inflation rates might be used by one person to show the effects of PR programs but interpreted by another person as indicating the effects of Certificate of Need legislation or utilization review programs.
At the other end of the methodological spectrum, behavioral equations can be derived from fundamental assumptions about hospital technology and objectives, estimated with two-stage least squares or another technique that accounts for simultaneous equations bias, and used to estimate the effects of PR programs. We will estimate such equations during the final phase of the NHRS, when the complete data base is available. These equations are not used in this preliminary analysis, primarily because they provide estimates of only the partial (direct) effect of PR programs on hospital expenditures. Since some of the explanatory variables they contain (such as, volume of services, and wage rate for hospital staff) are likely to be influenced by a strong PR program, the fact that these variables are “held constant” in the process of estimating the coefficients of variables measuring PR means that the indirect effects of PR on expenditures (for example, by downward pressure on hospital wages) are not reflected in the estimates obtained. Estimation of a set of behavioral equations is particularly useful when one is trying to determine how PR programs affect expenditures but is a cumbersome mechanism for determining whether or not an effect exists. The entire set of equations would have to be specified, estimated, and then solved simultaneously to determine the size of the total effect (direct and indirect) of PR on hospital expenditures. The calculations required to measure the statistical significance of the derived estimate of total effect are exceedingly complex.
We derived estimates of effects of PR programs from reduced-form equations for hospital expenditures. These equations explain variations in expenditures in terms of exogenous variables only (variables that are likely to explain variations in expenditures but are unlikely to be affected by hospital behavior or to change as the result of the implementation of a PR program). Compared to the two alternative methods previously described, reduced form equations offer several advantages. Differences in socioeconomic conditions and various government regulations that may be correlated with the presence or absence of PR programs across areas or over time are statistically controlled. Also, it is not necessary to estimate a complete set of structural equations, nor are relatively expensive simultaneous-equation estimation techniques required. Finally, the results provide a direct mechanism for testing the statistical significance of the estimated total effects (direct and indirect) of PR programs.
The measures used to represent PR programs are dummy variables. One dummy variable is used to represent each version of each PR program being studied. Since most programs have undergone significant changes over time, the use of separate variables for each version of a program allows for the possibility that new methodologies may have greater effects on hospital expenditures than did earlier, more rudimentary methodologies. The use of separate variables for programs in different States is necessary to estimate and test the relative effects of each program.
The specification of the PR variables is easiest to explain in terms of a simplified example. A dependent variable (Y) is assumed to be a linear function of an explanatory variable (X):
| (1) |
The implementation of a PR program is assumed to shift the function up or down, so the effect of the program must be estimated by calculating the value of the intercept (a) with and without the PR. Data are available for hospitals covered by the program (study group) for years when the program was in existence and also for earlier years. Data are also available for the same two periods for hospitals not covered by the program (control group). To account for all four possible values of the intercept, before and after PR and in both study- and control-group hospitals, the equation is specified as follows.
| (2) |
where:
DS = 1 for hospitals in the study group for all years 0 for control-group hospitals
DA = 1 for all hospitals after PR is implemented 0 for all earlier years
DSA = 1 for study-group hospitals only after PR is implemented 0 for study-group hospitals in earlier years and for control-group hospitals in all years
The second version of the equation provides a very convenient mechanism for testing the effects of program implementation. The coefficient of DSA (a3) is a direct estimate of the difference between the before/after change in the value of the intercept for study-group hospitals and the before/after change that occurs for control-group hospitals. Since the only factor known to change differentially for the two groups is the implementation of a PR program, the coefficient of DSA is interpreted as the effect of PR. Since numerous exogenous variables (the Xs) will be included as explanatory variables in a realistic model, all measurable factors that might change differentially for the two groups should be statistically controlled. The residual difference should be due to PR. It should be noted that the inclusion of DA in the model allows for changes in any unmeasured variables over time in both groups; as long as the changes in these variables are approximately the same in both groups, the estimator used to measure the effect of PR will be unbiased. The inclusion of DS allows for initial differences in unmeasured variables between the study- and control-group areas; as long as these unmeasured differences remain unchanged from the pre-PR to the post-PR period, the estimate of PR's influence will not be affected.
The use of both study/control and pre/post data provides a much stronger evaluation design than would standard use of only study/control or only pre/post comparisons. A simple study/control comparison is almost certain to yield biased results, for the following reasons:
Numerous factors influencing hospital behavior vary geographically;
Data cannot be obtained on many of these factors (for example, physicians' attitudes, or incidence of certain illnesses) at reasonable cost; and
Interstate variations in some of these variables are likely to be correlated with the presence or absence of PR programs.
A pre/post comparison is also an inadequate design, since unmeasured (omitted due to lack of data) variables are also likely to change over time. The four-way design we used in this study does not require spatial or temporal constancy of omitted variables. It requires only that there be no change in the difference in omitted variables that is correlated with implementation of reimbursement controls.
The specification described above can be generalized easily to account for the existence of multiple programs and even multiple versions of programs. One set of DS, DA, and DSA variables is needed for each program. To reflect the introduction of a new version of a program, new DA and DSA variables are needed, but the DS variable used to denote the hospitals in the old version of the program will serve for the new version as well. If two programs are implemented at the same time, the same DA variable will serve for both. The coefficient of each DSA variable is used as an estimate of the impact of its corresponding PR program.
Data: Source and Quality
The sampling frame from which hospitals used in this study were drawn is a subset of the 8,160 hospitals for which data are available from the annual survey of the American Hospital Association (AHA) for at least one year between 1970 and 1977. Hospitals were omitted from the frame if they: were operated by a Federal agency; were not classified as general-service hospitals; were located outside the 48 contiguous States and the District of Columbia; or had a median annual average length of stay between 1970 and 1977 in excess of fifteen days.7 We selected a 25 percent random sample from the entire frame, and then drew a supplement to provide a census of the frame for the nine study States/areas and for six other States with state-wide mature PR programs (Table 3): Colorado, Indiana, Kentucky, Nebraska, Rhode Island, and Wisconsin. A total of 2,693 hospitals comprise the sample, including some that opened or closed during the ten-year sample period, 1969 to 1978. A total of 23,576 hospital years comprise the maximum sample size available for analysis.
Since one analysis planned for the study, that of hospital expense per capita, would use county years as the unit of analysis rather than hospital years, a sample was also drawn of counties. To insure maximum comparability between results based on the two different units of analysis, the sample of counties consists of all counties containing at least one NHRS sample hospital. In all, 1,317 of the nation's 3,049 counties (only 2,712 contain hospitals) were included. The sample counties account for 67 percent of U.S. hospitals and 90 percent of U.S. population.
Raw data on hospital characteristics were obtained from computer tapes of the responses for AHAs annual survey before the AHA had inserted estimated values for missing responses or for non-responding hospitals. Where we thought it appropriate, we estimated missing values by interpolation/extrapolation rules developed as part of this study.8 We also screened the file for out-of-range values for all of the variables used in the analysis (for example, zero admissions and occupancy rates in excess of 100 percent). In all, we calculated that about 4,300 observations (18 percent) of hospital years contained data so suspect that the observations were not used in the analysis.
Observations were also excluded from analysis of the county-year data file because of missing (not estimable) and out-of-range values. Since the construction of the county-year file required aggregation of expenditures for all short-term hospitals in the county (not just NHRS sample hospitals), missing or invalid data for a single hospital could cause data for the entire county to be missing. To minimize the number of exclusions due to missing data, we considered county aggregates valid if expenditure data were missing for one or more hospitals that as a group accounted for less than 2 percent of the hospital beds in the county. We dropped about 1500 observations (12 percent) from the county-year file due to missing or invalid data. The incidence of missing and invalid data is less serious in the county-year file than in the hospital-year file because the problem occurs most frequently for very small hospitals (that is, hospitals with fewer than 50 beds); while such hospitals represent over 10 percent of the NHRS sample, they typically account for less thant two percent of a county's beds.
The three dependent variables used in the analysis are: hospital expense per adjusted patient day (CPD); expense per adjusted admission (CPA); and expense per capita (CPC). Ideally, the measure for hospital expense should include all costs associated with patient care, including the cost of services provided by the patient's attending physician. However, since physician costs are included in the expense figures that hospitals report on the AHA annual survey only when care is provided by a hospital-based physician, most physician costs are not reported by hospitals and are not available from other sources.
To maximize the consistency in the three dependent variables across hospitals and counties, payroll for hospital-based physicians was subtracted from total expense before CPD, CPA and CPC were calculated. This adjustment was designed to eliminate inconsistencies caused by different policies toward the use of hospital-based physicians. Had adequate data been available, salaries of interns and residents (assumed to be physician substitutes) and interest expense (known to bear little relationship to the user cost of physical assets across institutions) would also have been deducted. These deductions would have further improved the comparability of expense data across hospitals. Adequate data were available to make the adjustment only for hospital-based physicians.9 Both inpatient days and admissions have been adjusted, using the standard AHA method, to reflect variations in occasions of outpatient services across hospitals and over time.
In general, AHA data on hospital finances and services are not of high quality. As a limited test of the quality of AHA data, a comparison was made between AHA survey and Medicare Cost Reports (MCR) data on adjusted patient days and total expenses for a sample of hospitals for the year 1974. Relative to MCR data, figures reported to the AHA understated both adjusted patient days and expenses, but overstated expense per adjusted day. Correlations between corresponding data from the two sources ranged from 0.65 to 0.95 within relatively small categories of hospitals by bedsize. Since MCR figures exclude costs which are not related to patient care (for example, a gift shop), have been audited, and provide considerably more detailed and standardized information, the MCR data on hospital finances and services will be used in the final analysis. After discrepancies between AHA and MCR data had been uncovered, we greatly intensified our efforts to purge AHA data of errors due to keypunching the AHAs rough interpolations of missing data. We are now convinced that our existing file of AHA data is more than adequate to support the preliminary analyses reported here.
We obtained county aggregates by summing values for the individual hospitals located in a given county. This procedure presents special problems with respect to data quality, in terms of both definition and accuracy. With respect to definition, the assignment of all of a given hospital's expenditures to the county in which it is located implicitly assumes that all of the care associated with those expenditures is provided to residents of that county. This assumption is obviously incorrect, for hospitals in one county often provide services to residents of other counties. We think it is very important to note that for the estimated effects of PR programs to be biased as a result of this problem with data, measurement errors must be correlated with the presence/absence of PR programs, both across States and over time. That is, not only must there be a difference in “migration” rates between counties with and without PR programs, but there must also be a differential change in migration rates at the same time PR programs begin. These conditions are so stringent that the potential for serious bias is likely to be small.10
The completeness and validity of county data are related to a second issue concerning the definition of the dependent variable: should expenditures at all hospitals be included? Expenditures (even for short-term care) at long-term facilities or at specialized hospitals (for example, psychiatric hospitals) are likely to reflect different types of hospital decision making and should be of different interest to policy makers11 than are expenditures at short-term general hospitals. Moreover, patients at short-term hospitals are much more likely to be residents of the county in whch the hospital is located than are patients at long-term or specialized hospitals. For these reasons, total hospital expense at the county level has been calculated as the sum of expenses at only short-term hospitals in the county.
We have not attempted to choose exogenous variables for inclusion in reduced-form equations by developing a structural model of hospital behavior and then deriving reduced-form specifications from the structural model. Instead, we have based selections largely on the choices made in previous studies of hospital costs by Salkever (1972), Davis (1974), and Sloan and Steinwald (1980).12 The exogenous variables in the models used here differ in only minor respects from the variables used in these earlier studies. Since a regional wage index has not yet been added to the NHRS data base, this variable is not used here, although it has been used in earlier studies.13 In addition, we attempted to minimize the number of hospital-specific variables used, for some of those used in previous studies may be endogenous in the sense that they may be influenced by PR. For example, Sloan and Steinwald use medical school affiliation, bedsize, and the hospital's experience with unionization as exogenous. None of these has been used in this study, for each may be affected by PR (in fact, the possibility that such effects exist will be tested in subsequent analyses). The organizational control (proprietary or government-operated) of the hospital is represented in the equations we used because we believe control is not likely to be influenced by PR.
We obtained data on exogenous variables and government regulatory programs from a variety of sources (see Table 4 for a list of variables). We obtained figures on the number of physicians, and the number of physicians in specialized practice, from AMA publications. We also obtained a measure of income (total effective buying income) from various issues of Sales and Marketing Management. We used census data to measure the size and composition of the population. In addition, we obtained: information used to calculate an unemployment rate by county by year from the Employment and Training Report of the President; the percentage of the population covered by commercial health insurance from the Source Book of Health Insurance Information; and the start date of Certificate of Need review by State from information collected by Policy Analysis, Inc. as part of a study for the Health Resources Administration. The Health Standards and Quality Bureau (HSQB) of the Health Care Financing Administration provided the dates on which each hospital began binding Professional Standards Review Organization (PSRO) review. We found the start dates of PR programs from case studies conducted earlier as part of the NHRS. We did not include variables to reflect PR programs other than the 15 that comprise the primary and secondary study groups of the NHRS.14
Table 4. Variable Definitions.
| CPD | Expense net of physician payroll per adjusted patient day |
| CPA | Expense net of physician payroll per adjusted admission |
| CPC | Expense net of physician payroll in all short-term hospitals in the county, divided by county population |
| D70-D78 | Dummy variables: equal 1.0 in year indicated by the two digits (for example, 1970 for D70) and all later years (through 1978); equal 0.0 for earlier years |
| AFDC | Percent of county population on AFDC (X̄ = 4.12) |
| BIRTH | Births per 10,000 population in county (X̄ = 1.56) |
| COMMINS | Percent of population covered by commercial (including Blue Cross) insurance in State (X̄ = 0.793) |
| CRIME | Crimes per 100,000 population in county in 1975 (X̄ = 4,110) |
| DSMSA | Dummy variable: equals 1.0 if hospital is located in a Standard Metropolitan Statistical Area (SMSA); 0.0 otherwise (X̄ = 0.539) |
| EDUC | Avarage years of educational attainment for county population (X̄ = 11.6) |
| GOV | Dummy variable: equals 1.0 if hospital is operated by non-Federal government agency; 0.0 otherwise (X̄ = 0.243) |
| GOVTSHR | Ratio of number of government-operated community hospitals in the county to total number of community hospitals in the county (X̄ = 0.21) |
| INCOME | Personal income per capita in county (X̄ = 4350) |
| MDPOP | Number of active physicians per capita in county (X̄ = 0.00121) |
| NGOVT | Number of government-operated community hospitals in the county (X̄ = 0.72) |
| NHBPC | Nursing home beds per 1,000 persons in county (X̄ = 21.8) |
| NHOSP | Number of community hospitals in the county (X̄ = 4.15) |
| NPROF | Number of for-profit community hospitals in county (X̄ = 0.57) |
| P | Population in county (X̄ = 501,820) |
| POPDENS | Population (100s) per square mile in county (X̄ = 21.8) |
| POPT18 | Percent of population enrolled in Medicare Part A in county (X̄ = 0.114) |
| PROF | Dummy variable: equals 1.0 if hospital is organized as a for-profit institution; 0.0 otherwise (X̄ = 0.088) |
| SPMD | Percent of physicians in county who are specialty physicians (X̄ = 48.4) |
| TEACH | Ratio of number of community hospitals with medical school affiliations to total number of community hospitals in county (X̄ = 0.17) |
| UNEMRT | Proportion of labor force in county unemployed (X̄ = 0.0580) |
| WHITE | Proportion of county population comprised of whites (X̄ = 0.920) |
| Dssc | Dummy variable: equals 1.0 for all years if hospital is in State ss (cohort c); 0.0 otherwise (ss indicates the two-letter abbreviation of the State; c indicates the substate cohort) |
| DPSRO | Dummy variable: equals 1.0 for all years for any hospital with binding PSRO review (either delegated or nondelegated); 0.0 otherwise |
| DPSRON | Number of hospitals in county subject to binding PSRO review at any time between 1969 and 1978 |
| PSRO | Dummy variable: equals 1.0 for only those years in which a hospital was covered by binding PSRO review; 0.0 otherwise |
| PSRON | Number of hospitals in county subject to binding PSRO review during the current year |
| CNss | Dummy variable: equals 1.0 for those years in which Certificate of Need review was in effect in State ss; 0.0 for other years and for hospitals in other States (ss is the two-letter abbreviation for a State). |
| Dsscyy | Dummy variable: equals 1.0 for a hospital in State ss (and in cohort c) in year yy and later; 0.0 otherwise (ss is a two-letter abbreviation for a State; c is [when needed to differentiate cohorts of hospitals entering PR at different times] the substate cohort; yy indicates the first fiscal year during which PR [or a version of PR] was in place) |
Econometric Results
PR programs are likely to affect hospital expenditures in two ways: 1) by reducing the level of expenditures, and 2) by reducing the annual rate of increase in expenditures. The controls imposed by PR programs have a direct effect on hospital revenue, but effects on expenditures will occur only as a result of actions taken by hospitals in response to tighter budget constraints. One category of hospital actions will produce one-time reductions in expenditures. This category includes: elimination of a service, reduction in length of stay, or initiations of shared-purchasing arrangements with neighboring hospitals. Although these changes will reduce the level of expenditures, after the first year they will leave the rate of inflation unchanged from the pre-PR period. The second category of hospital actions will reduce the rate of increase of expenditures. This category includes: negotiation of a lower annual salary increase for hospital staff or less demand for hospital supplies. The models used to estimate the effects of PR must be specified in such a way that both the level and the rate of increase of expenditures are functions of the variables used to reflect the presence of PR programs.
A single equation that contains terms to reflect the influence of PR on both the level and rate of change of expenditure is quite cumbersome. Equation 2 would be respecified as follows:
| (3) |
For this model, an estimate of a3 would measure the impact of the PR program on the level of expenditures, while an estimate of c3 would measure the impact on the rate of change in cost per unit of time. Since six terms rather than three are now needed for each program, the number of right-hand-side terms increases very quickly as the number of PR programs grows. The collinearity among DSA, DS, and DA is high; to introduce these terms again, interacted with a time trend, would increase the collinearity even further. With such high collinearity among the variables of interest, the odds are not attractive for reliable separation of the effects of PR on the level and rate of increase of expenditures.
The alternative approach used here is admittedly a less than perfect solution. One model is specified to estimate the effects of PR on the level of expenditures; a second model is used to measure the effects of programs on the rate of increase in expenditures. Since we believe that both types of effects are possible, use of alternative models, each allowing only one type of effect, may introduce specification bias into the estimation process. Since this is a preliminary analysis, more careful and costly efforts to separate the two types of effects can be reserved for a later phase of the study.
The two types of equations, used here to test for the two types of effects, differ primarily in the specification of the dependent variable. In one type of equation, the dependent variable is expressed as the (natural) logarithm of expenditures per adjusted patient day, per adjusted admission, or per capita. In the other type of equation, the dependent variable is the percentage change in expenditures per adjusted patient day, per adjusted admission, or per capita. On the right-hand side of both types of equations, all non-dummy variables are entered in logarithmic form.15 This allows the coefficients of non-dummy variables in both types of equations to be interpreted as elasticities.
Tables 5 through 10 present the results obtained for each of the six equations estimated. We designed the first three models to explain the annual percentage change in hospital expense per adjusted patient day, per adjusted admission, and per capita, respectively. The second three models predict the logarithm of the level of hospital expense per adjusted patient day, per adjusted admission, and per capita, respectively. We estimated the first two models in each set of three with data from the hospital-year file, and we estimated the last model in each set from the county-year file.
Table 5. Regression Results for Model I, Percentage Change in Hospital Expenditures per Adjusted Patient Day.
| Dependent Variable: 100(CPDt − CPDt − 1)/CPDt − 1 | ||
|---|---|---|
| R2 = 0.055 | F(28,18694) = 39.1 | N = 18,722 |
|
| ||
| Explanatory Variable | Estimated Coefficient | t-Ratio |
| INTERCEPT | 13.75 | |
| D72 | −2.52 | 9.35 |
| D73 | −2.75 | 9.23 |
| D74 | 2.90 | 9.61 |
| D75 | 4.58 | 15.25 |
| D76 | −1.26 | 4.65 |
| D78 | −1.88 | 6.83 |
| PROF | −0.85 | 2.92 |
| In (BIRTH) | −0.78 | 1.78 |
| In (AFDC) | 0.03 | 1.98 |
| In (COMMINS) | 1.68 | 2.36 |
| DAL | 1.50 | 2.09 |
| DCA | 0.89 | 2.46 |
| DCO | 0.76 | 1.77 |
| DMD | 3.92 | 2.57 |
| DMT | 3.81 | 2.96 |
| DNM | 2.52 | 2.28 |
| DPA | 0.62 | 1.83 |
| DRI | −2.22 | 2.36 |
| DPSRO | 0.36 | 2.35 |
| CNDC | 11.84 | 1.71 |
| CNMD | −3.25 | 1.96 |
| CNOK | 2.07 | 2.80 |
| DCT75 | −2.76 | 3.20 |
| DMA76 | −2.95 | 4.85 |
| DMD76 | −6.14 | 4.98 |
| DNJ77 | −3.21 | 4.35 |
| DNY71 | −1.22 | 3.95 |
| DNY76 | −3.42 | 6.98 |
Table 10. Regression Results for Model VI, Hospital Expenditures per Capita.
| Dependent Variable: LSTEPC | R2 = 0.6824 | F(67,10766) = 494.14 | N = 10,859 | ||
|---|---|---|---|---|---|
|
| |||||
| Explanatory Variable | Estimated Coefficient | t-Ratio | Explanatory Variable | Estimated Coefficient | t-Ratio |
| INTERCEPT | 986.56 | 124.40 | DTX | −7.24 | −4.14 |
| D70 | 10.60 | 6.39 | DUT | −27.43 | −5.31 |
| D71 | 10.43 | 6.24 | DWA | −8.40 | −3.10 |
| D72 | 13.51 | 8.29 | DWP | 25.72 | 6.86 |
| D73 | 13.80 | 8.59 | DWY | −13.12 | −2.85 |
| D74 | 8.66 | 5.48 | LAFDC | 0.06 | 1.65 |
| D75 | 8.69 | 5.05 | LBIRTH | 26.66 | 11.43 |
| D76 | 14.40 | 8.93 | LGOVT | −0.18 | −4.10 |
| D77 | 6.08 | 3.85 | LMDPOP | 71.64 | 98.66 |
| D78 | 11.47 | 7.35 | LNHBPC | −0.06 | −4.17 |
| CNCA | −12.92 | −5.39 | LPOPT18 | 21.59 | 15.15 |
| CNFL | −13.70 | −3.86 | LSPMD | −0.07 | −7.31 |
| CNKS | 18.87 | 6.33 | LUN- | ||
| CNNV | 36.04 | 2.50 | EMRT | 10.90 | 6.59 |
| CNCS | −16.76 | −3.57 | LPROF | −0.02 | −2.05 |
| CNVA | −9.89 | −2.20 | DNY76 | −5.06 | −1.69 |
| DAL | 9.47 | 3.19 | DWA76 | −7.64 | −1.66 |
| DAZ | 12.86 | 3.46 | DSMSA | 7.36 | 7.49 |
| DGA | 9.05 | 3.47 | PSRO | 2.32 | 1.84 |
| DIL | 21.32 | 9.30 | |||
| DMI | 15.93 | 6.86 | |||
| DMN | −6.45 | −4.27 | |||
| DMO | 29.58 | 9.71 | |||
| DNH | −15.76 | −3.12 | |||
| DNJ | −13.21 | −4.75 | |||
| DNV | 35.73 | 3.19 | |||
| DOH | 9.16 | 3.96 | |||
| DOR | − 23.04 | −6.98 | |||
| DPA | −13.03 | −4.44 | |||
| DSD | 11.60 | 3.28 | |||
We used a stepwise regression procedure to select the subset of potential explanatory variables to enter the regression equations. The reported results include only those variables for which the probability of rejecting a true null hypothesis is less than 10 percent. When the regressions were rerun with all variables included, the pattern of estimated regression coefficients and of statistical significance changed very little. Hence, one can have reasonable confidence that an alternative selection procedure (e.g., backward elimination rather than forward entry) would have produced substantially the same results.
The percentage of variance in the dependent variables explained by the regression equations is much lower for the percentage change equations than for the levels equations. Whereas 74 to 80 percent of the variance in expenditures per day, per admission, or per capita is explained by the equations in which levels of expenditures are the dependent variables, only 5 to 11 percent of the variance in percentage changes in expenditure is explained by the alternative models.
This difference in explanatory power is not surprising, for numerous studies in other fields have shown that changes or percentage changes are much more difficult to predict than levels, especially when the levels variables exhibit strong trends over time. The R2s obtained for expenditures per adjusted patient day (0.74) and per adjusted admission (0.77) are considerably higher than those obtained by Sloan and Steinwald (0.50 and 0.51, respectively), despite the fact that they included the lagged dependent variable among their regressors.16
Few, if any, of the estimated coefficients of the exogenous variables that enter the regressions are notable, nor are they an important concern in this analysis. We included these variables in the equations to control any possible confounding of the presence or absence of PR programs with other exogenous factors that influence hospital behavior. In additon, it is generally not possible to derive a priori hypotheses about the signs and magnitudes of the coefficients of exogenous variables in reduced form equations, for each variable may exert both direct and indirect effects on the dependent variables, and these effects may work in opposite directions. For these reasons, we made no attempt to analyze the significance of estimated coefficients of non-regulatory exogenous variables.
Many of the dummy variables representing States enter as statistically significant in models to predict the level of expenditures, but few enter as statistically significant in equations to explain percentage changes. This result indicates that, despite significant interstate variations in the level of expenditures, there is substantial homogeneity across States in inflation rates. Without some form of cost containment program, expenditures in high-cost States will not gradually move back toward expenditures in low-cost States.17
The results obtained for variables representing Certificate of Need (CN) programs and binding PSRO review of hospital utilization are of considerable interest. The results indicate that CN programs do not reduce hospital expenditures. Of the CN dummy variables that enter regressions, about half have positive coefficients. None of the CN variables enters with a consistently negative coefficient across several of the models estimated. We obtained a similar result for the dummy variable indicating binding PSRO review at a hospital. The variable enters only two of the six regressions with a statistically significant coefficient, and in both cases binding utilization review is associated with higher hospital expenditures. In late 1981, similar reduced form equations will be estimated as part of the NHRS for measures of hospital behavior likely to be more directly affected by CN and PSRO review, so further opportunities will arise to test for effects of these other regulatory programs.18
The results obtained for variables representing PR programs indicate that at least some of these programs have reduced hospital expenditures by a significant amount. Strong and consistent evidence shows that the programs in Connecticut (1974 and later), Maryland (1976 and later), Massachusetts (1976 and later), New Jersey (1977 and later), and New York (1976 and later) reduced the level and rate of increase of hospital expenditures per patient day and per admission. There is less consistent, but still strong, evidence that programs in Arizona, Indiana, Kentucky, Minnesota, New York (1971-1975 program), and Rhode Island reduced the level or the rate of increase of hospital expenditures, or both. The evidence is less consistent for the latter group of States because the variables representing these programs entered only one to three of the six regressions with statistically significant coefficients. The last section of this paper discusses in more detail the results obtained for both groups of programs mentioned here.
While only those PR programs mentioned above entered one or more of the six regressions with statistically significant coefficients, there is at least a hint that other programs also exerted some downward pressure on hospital expenditures. When all variables were forced to enter regressions, coefficients for programs in Washington, western Pennsylvania, and Wisconsin were negative in most equations. The same is true for coefficients of a variable representing the early mandatory version (1975-1976) of the program in New Jersey. By contrast, the two versions of PR in Colorado, the early (1972-1974) voluntary program in Connecticut, the early (1970-1974) voluntary program in New Jersey, and the voluntary program in Nebraska (now discontinued) consistently produced positive regression coefficients.
We conducted a substantial number of statistical analyses of the effects of various PR programs before the specific results shown in Tables 5 through 10 were selected as the most appropriate. In all of the initial regression analyses, we used relatively complex specifications of PR variables to reflect the facts that most programs have changed substantially over time, and that different hospitals entered some programs at different points in time. After preliminary analyses had indicated that explanatory power would not be significantly reduced, we simplified the specifications of PR variables by treating different versions of the same program as a homogeneous group (one dummy variable for both versions) or by combining cohorts of hospitals entering programs at different times as a single cohort. In addition, we tested alternative models to determine the sensitivity of estimates of PR effects to variations in equation specification. For example, the number of beds in the hospital and lagged dependent variables were included as explanatory variables, in part to replicate the models used by Salkever (1972) and Sloan and Steinwald (1980), and in part as tests of the sensitivity of estimated results. None of the experiments produced results that threatened the conclusion that PR programs are associated with lower levels and rates of change in hospital expenditures.
Elaboration and Discussion of the Estimated Effects of Prospective Reimbursement
The results presented in this paper indicate that PR programs are effective mechanisms for controlling hospital costs. Table 11 provides a comparison of the estimated coefficients of the PR dummy variables that enter one or more of the six regression equations. Programs in 11 States are associated with reductions in hospital expenditures that are consistent enough across hospitals or counties, or both, for us to reject the possibility that the associations are due to chance. Only those programs in Massachusetts, New York, and Rhode Island appear to have exerted a statistically verifiable effect on expenditures per capita. Although the program in Washington is associated with a reduction in expenditures per capita, the lack of indication of corresponding effects on expenditures per patient day or per admission causes us to question whether or not the per capita effect might be due to reduction in per capita hospital utilization, possibly due to factors other than PR.
Table 11. Estimated Effects of Prospective Reimbursement Programs on Hospital Cost per Patient Day, per Admission, and per Capita (Percentage Point Change).
|
|
|
|||||
|---|---|---|---|---|---|---|
| Annual Percentage Change | Level of Expenditure | |||||
|
| ||||||
| Program1 | Expense Per Patient Day | Expense Per Admission | Expense Per Capita | Expense Per Patient Day | Expense Per Admission | Expense Per Capita |
| Arizona | ||||||
| Voluntary, 1974-78 | −4.8 | |||||
| Connecticut | ||||||
| Mandatory, 1975-78 | −2.8 | −2.6 | −7.4 | −8.7 | ||
| Indiana | ||||||
| Voluntary, 1969-782 | −6.4 | |||||
| Kentucky | ||||||
| Voluntary, 1975-78 | −5.6 | |||||
| Maryland | ||||||
| Mandatory, 1976-78 | −6.1 | −4.2 | −10.5 | |||
| Massachusetts | ||||||
| Mandatory, 1976-78 | −3.0 | −1.9 | −3.1 | −5.4 | −4.1 | |
| Minnesota | ||||||
| Voluntary, 1975-78 | −3.9 | −6.5 | ||||
| Voluntary, 1978 | −2.2 | |||||
| New Jersey | ||||||
| Mandatory, 1977-78 | −3.2 | −2.7 | −4.1 | |||
| New York | ||||||
| Mandatory, 1971-78 | −1.2 | −2.7 | ||||
| Mandatory, 1976-78 | −3.43 | −4.6 | −4.1 | 5.1 | ||
| Rhode Island | ||||||
| Mandatory, 1975-78 | −4.2 | −3.9 | −8.3 | |||
| Washington | ||||||
| Mandatory, 1976-78 | −3.1 | −7.6 | ||||
Years shown for each program are those for which a statistically significant reduction in expenditures was observed; some programs existed in a different form in earlier years, but no statistically significant effect was observed for the earlier program versions. No statistically significant effects were observed for programs not shown.
Program in effect since fiscal year 1960; effects measured for 1969-78 without a pre/post evaluation design.
Additional effect, over and above the effect of the earlier program.
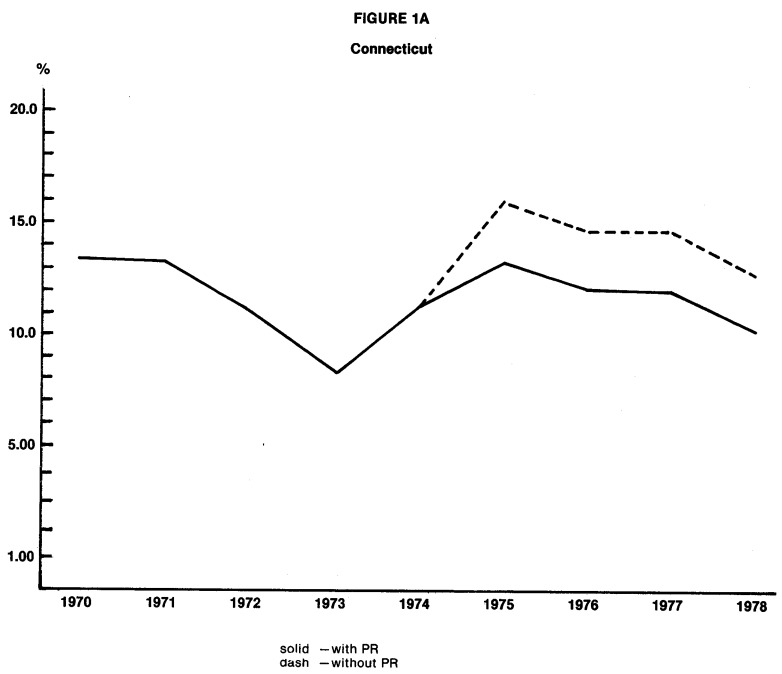
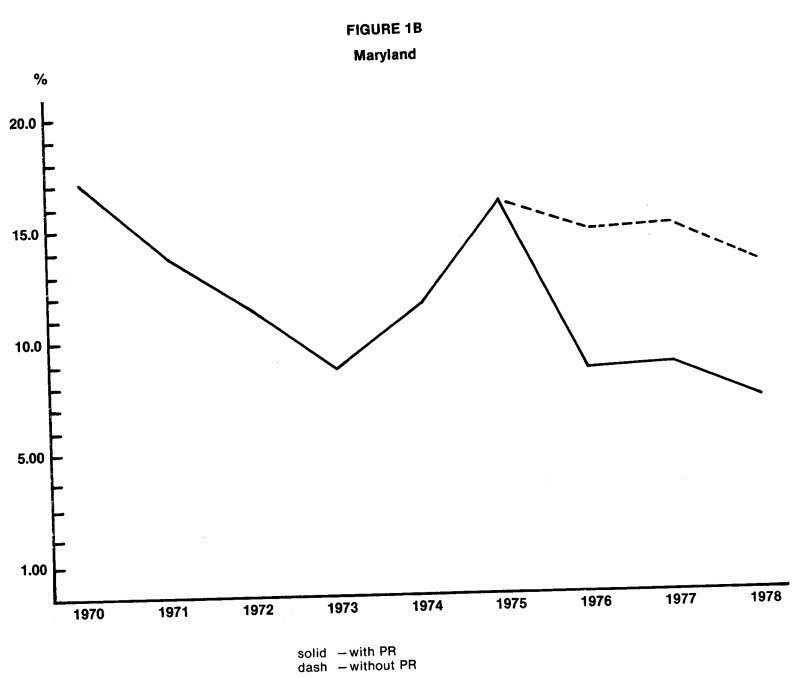
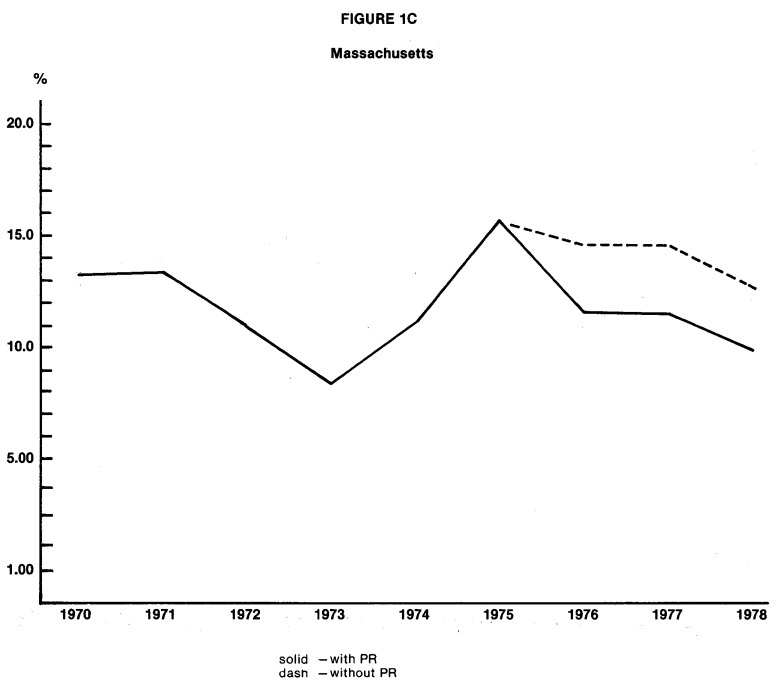
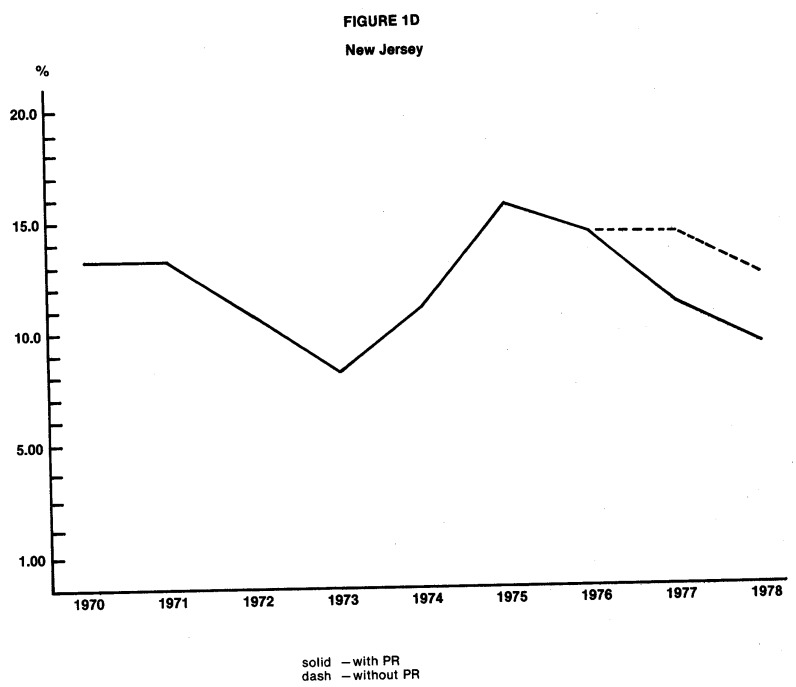
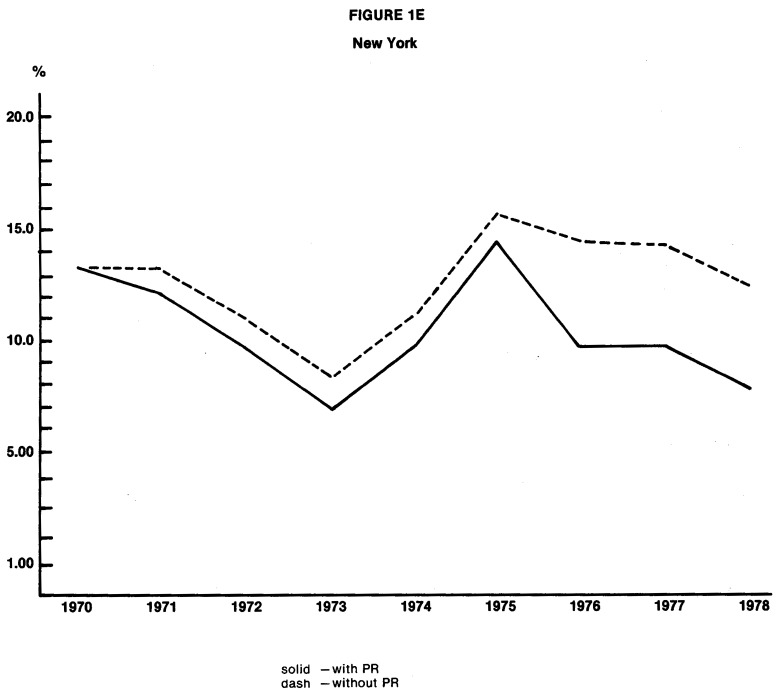
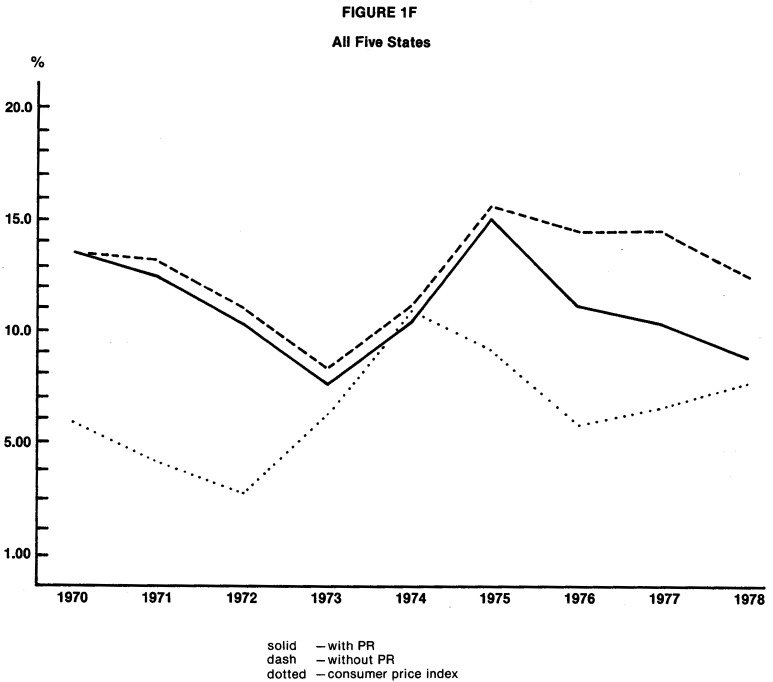
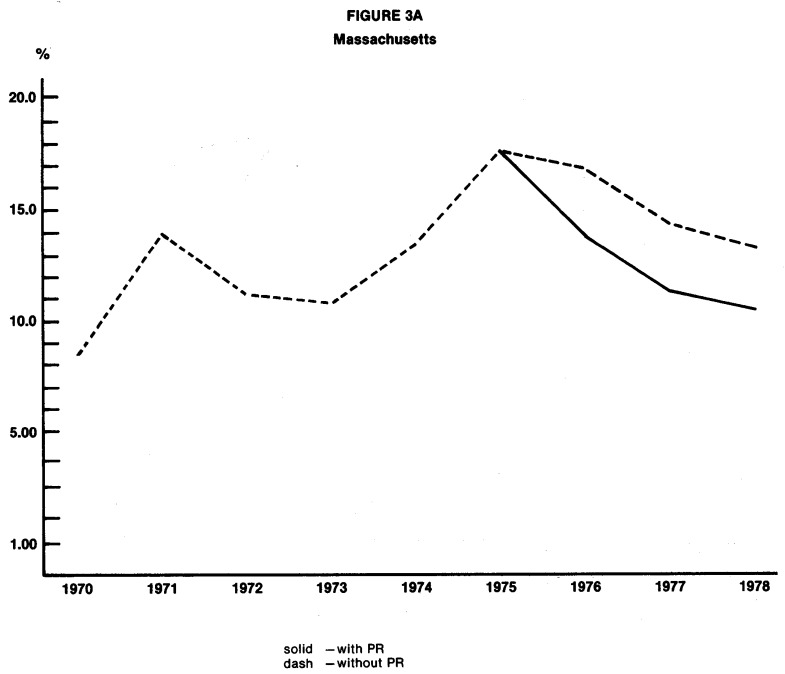
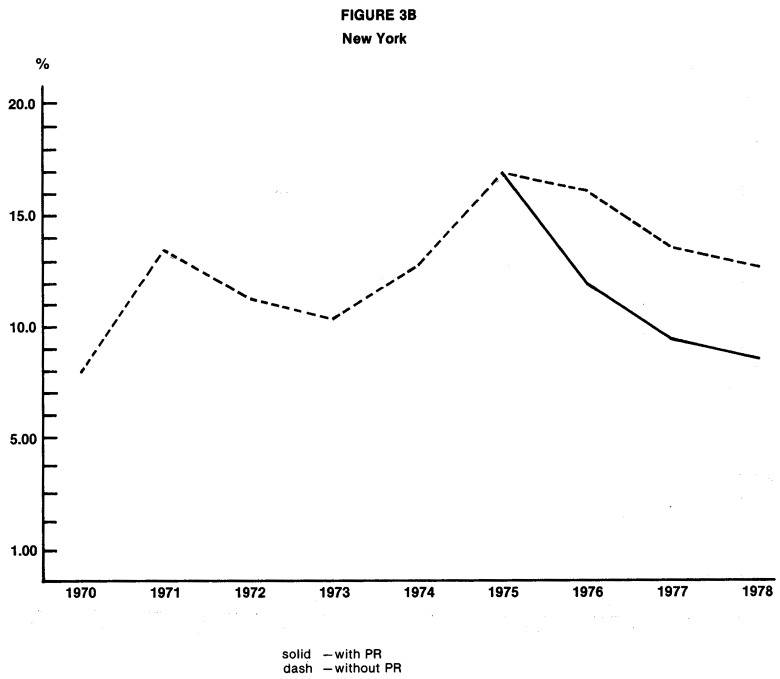
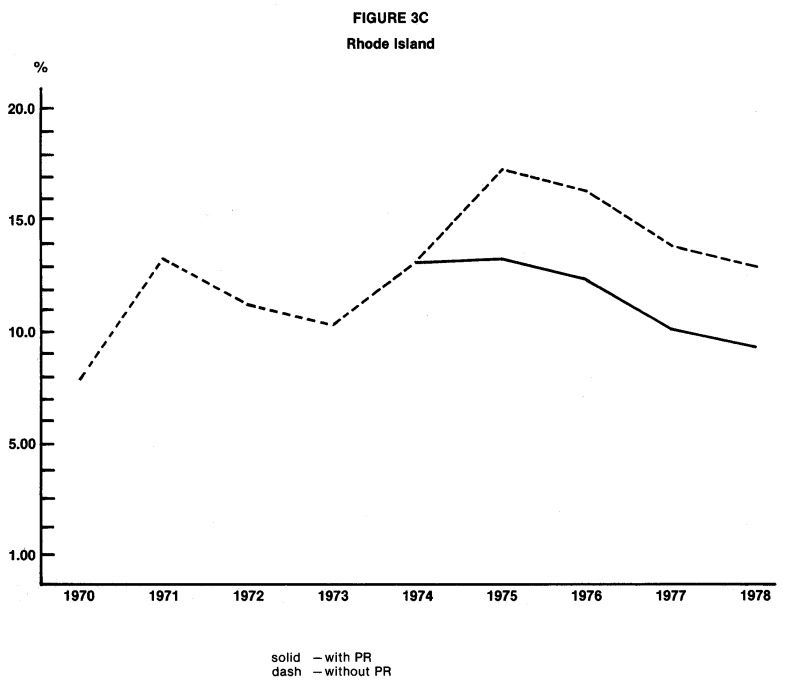
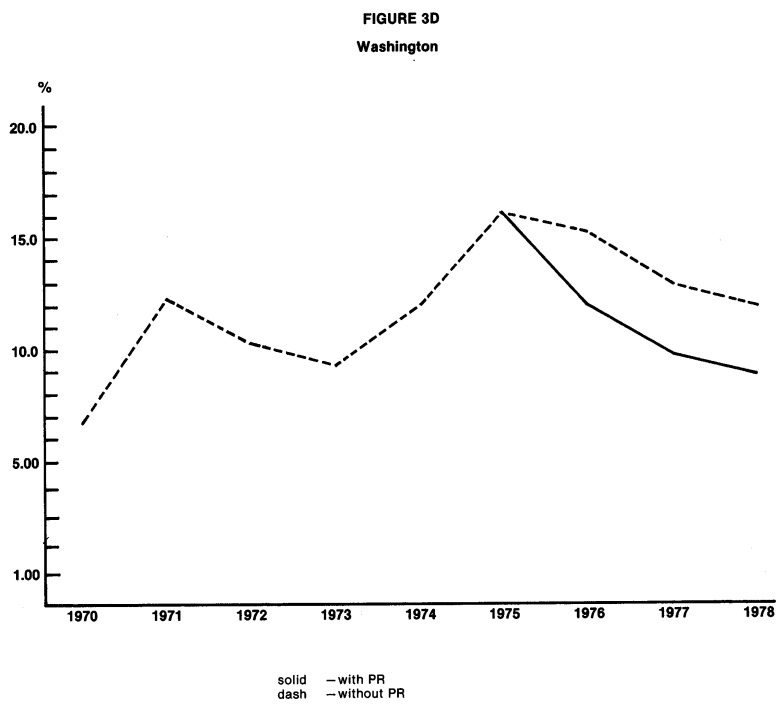
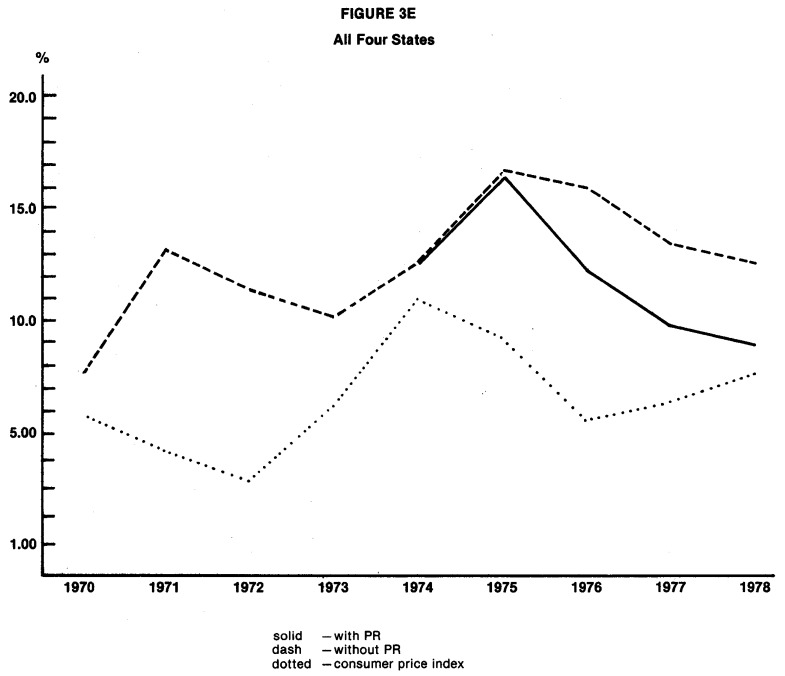
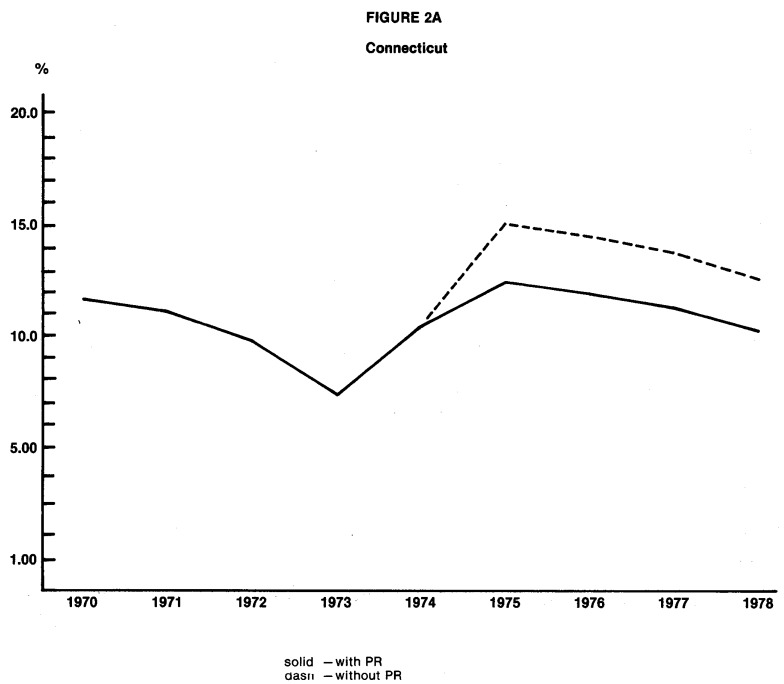
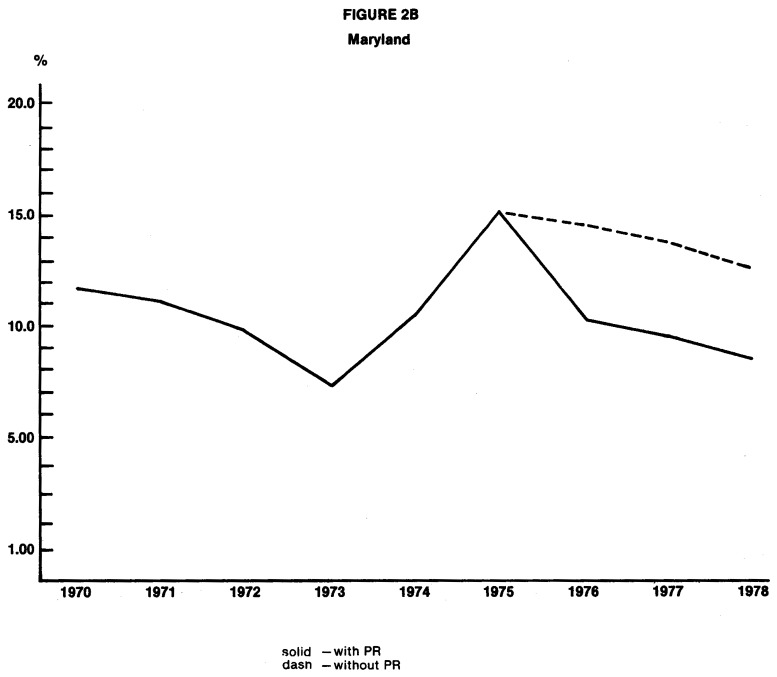
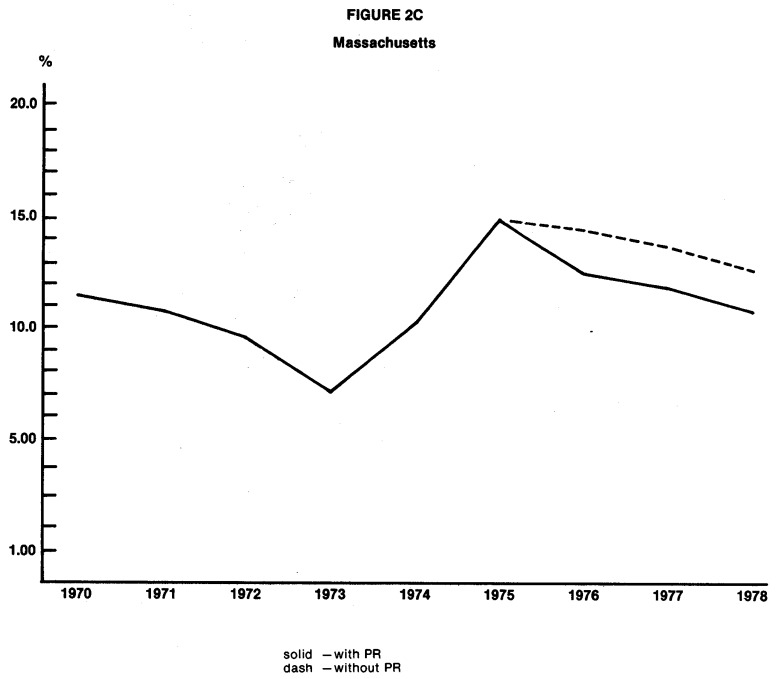
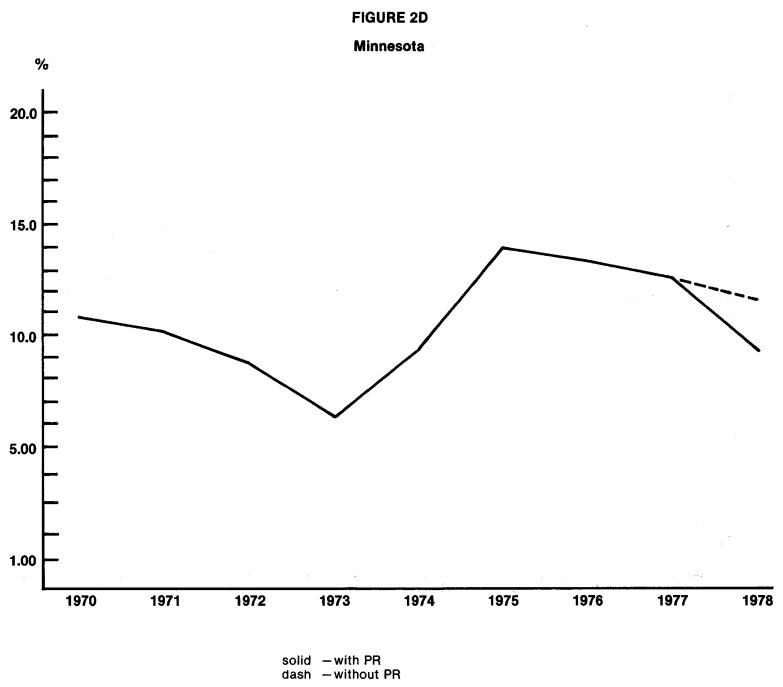
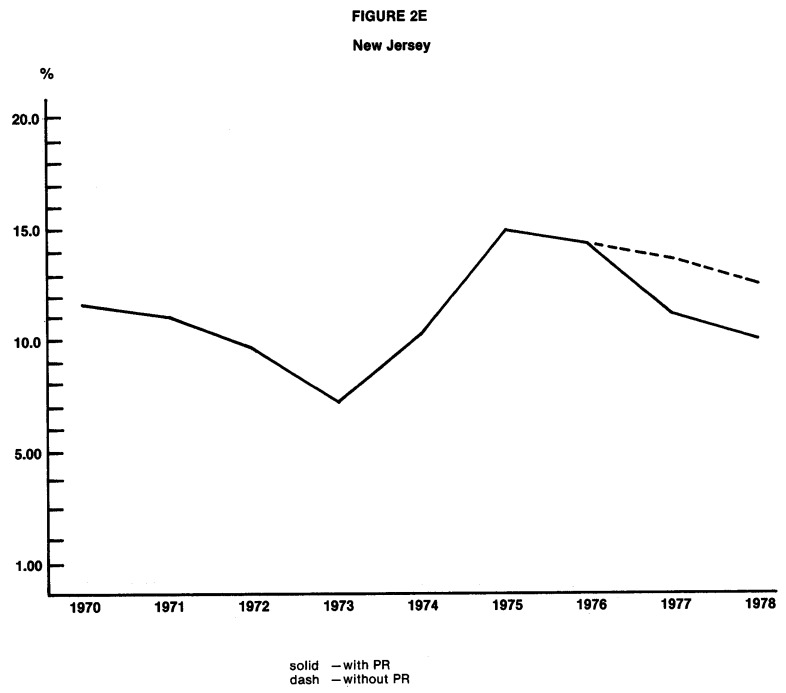
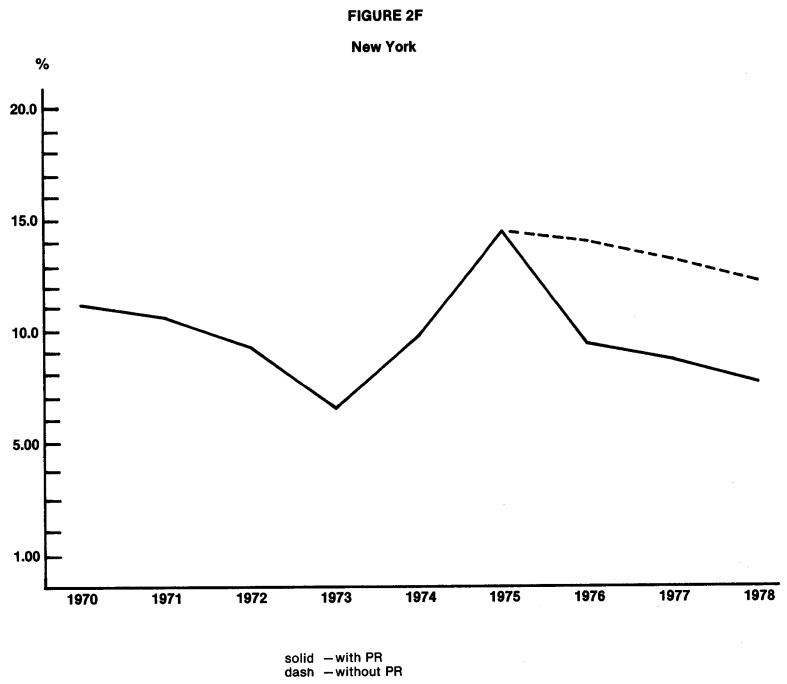
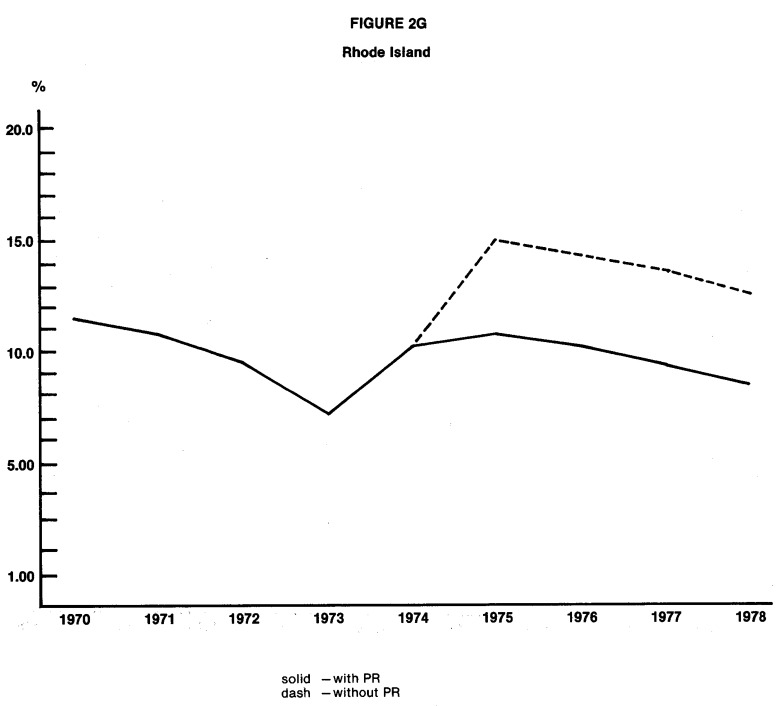
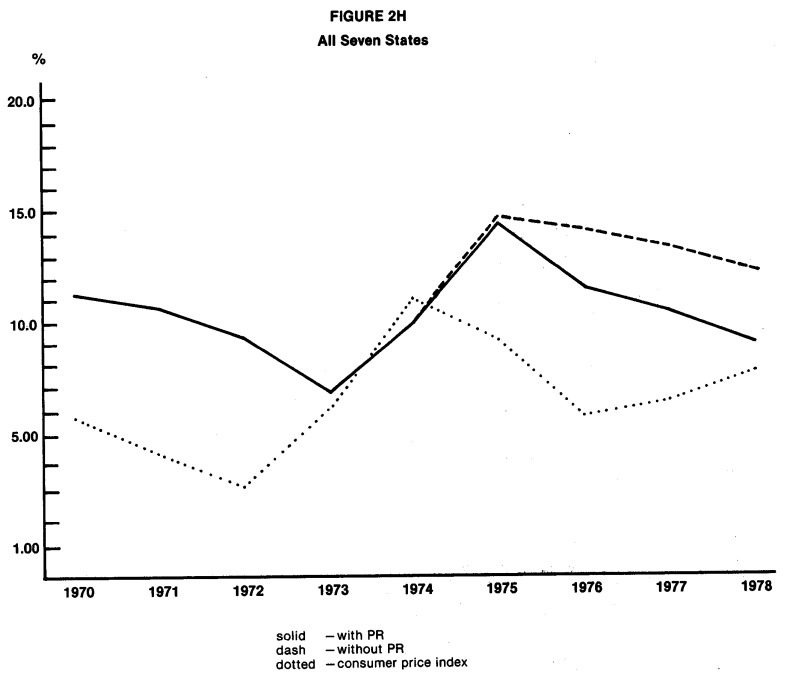
The practical significance of the estimated cost reductions produced by PR programs is of great concern. It is important that the cost reductions are large enough to significantly reduce the longstanding differential in inflation rates between hospital expenditures and consumer prices for other goods and services.19 Figures 1 through 3 compare the estimated paths of annual rates of increase in hospital expenditures with and without PR. The last graph in each of the three sets is the most significant, for it shows the degree to which PR has led to a convergence of annual rates of increase in hospital expenditures toward the annual inflation rate for all consumer goods and services. The reader, after examining these graphs, will see that the cost reductions produced by PR programs are of considerable practical significance, for the estimated effects of the most successful programs are to reduce the differential in inflation rates by one half or more.
Figure 1. Estimated Annual Percentage Change in Expense per Adjusted Patient Day, With and Without Prospective Reimbursement Programs1.
1PR programs for which no graph is presented had no statistically significant effect on the annual percentage change in expense per adjusted patient day.
Figure 3. Estimated Annual Percentage Change in Expense per Capita With and Without Prospective Reimbursement Programs1.
1PR programs for which no graph is presented had no statistically significant effect on the annual percentage change in expense per adjusted patient day.
Only in the most recent years are PR programs shown to have a statistically and practically significant effect on hospital expenditures. Even the older programs (for example, New York) are not shown to have large and consistently statistically verifiable effects until 1975 or 1976. It is not possible to determine at this point whether the lack of any apparent effect for early programs was due to the confounding influence of the Economic Stabilization Program or to limitations in program design. The fact that programs that were implemented in the mid-1970s produced an effect almost immediately does suggest that a program does not have to be in existence for four or five years before it influences hospital behavior.
Earlier in this paper, we set forth hypotheses stating that certain types of programs are likely to be more stringent than other types. Does the empirical evidence suggest that certain types of programs are relatively more effective? It is definitely true that estimated effects are more consistently statistically significant for mandatory programs than for voluntary programs. Nine of the fifteen programs evaluated are mandatory, and seven of the nine produce effects that are statistically significant in at least three of the six regression equations. On the other hand, three of the six voluntary programs produce some results that are statistically significant, and the estimated effects for the other three voluntary programs are consistently negative but not statistically significant. Mandatory programs appear to have a higher probability of reducing hospital expenditures, but some voluntary programs have also been successful.
The a priori rankings of relative program stringency which we presented earlier are not entirely consistent with empirical results. While the program in New York appears to have a strong effect on expenditures, it is not clearly more effective than the hypothetically lower-ranked program in Maryland. As hypothesized, the program in New Jersey is shown to be effective, and the cost reductions associated with it are generally smaller than the reductions estimated for New York. The program in Washington, however, is not shown to exert a statistically verifiable effect on expenditures per patient day or per admission, despite its relatively high a priori ranking.20 The programs in Arizona, Minnesota, and especially western Pennsylvania show only modest to weak effects, as the a priori rankings would suggest.
Aside from suggesting that mandatory programs are more likely to be effective in controlling costs than are voluntary programs, the results provide relatively little indication of which other characteristics of PR programs are likely to be important determinants of effectiveness.
The following assessments seem to be justified on the basis of the statistical results presented here:
Unit of Revenue Controlled
Among the States for which evidence of effectiveness is strongest are some States that establish limits on total revenue (Massachusetts and Connecticut, although Medicaid payment rates are set in Massachusetts) and some States that attempt to control reimbursement per patient day, per case, or per unit of service (Maryland, New Jersey, and New York). A better assessment of the relative effectiveness of alternative approaches can be made after a preliminary analysis has been completed of program effects on the rate of growth of hospital services. Currently, there is no indication that any particular approach is superior to others.
Scope of Payor Coverage
Medicare participation in PR is not a necessary condition for program effectiveness. We cannot assess whether or not Medicare fares better as a participant or as a non-participant in effective programs until later analyses have been completed. Direct authority over reimbursement for only a narrow group of payors (commercially insured and uninsured patients in Connecticut, and commercially insured and uninsured patients plus Medicaid in Massachusetts) is not an insurmountable obstacle to program effectiveness in controlling total hospital expenditures.
Aggregate Versus Department-Level Cost Review
All six of the programs for which evidence of effectiveness is strongest conduct reviews of only aggregate spending for some, if not all, hospitals. It is therefore clear that department-level spending review is not a pre-condition for effectiveness. Whether department-level analysis increases effectiveness will best be assessed when department-level expenditure regressions are undertaken during the last phase of the NHRS.
Inclusion of Utilization Controls
This issue is best addressed with results from the upcoming preliminary analysis of program impact on the volume and composition of hospital services. It is not clear that the imposition of additional utilization controls in the New York program in 1975 is responsible for the improved effectiveness of that program, for other changes in the PR program were instituted at the same time.
Scrutiny of Base Year Compliance
Of all the programs studied, the program in New Jersey scrutinizes base year compliance (actual versus prescribed spending levels) most carefully and imposes the heaviest sanctions for non-compliance. This particular characteristic is not found among other programs shown to be effective, and some (such as Connecticut and Massachusetts) do not assess base year compliance. Although compliance assessments are not essential, future analyses must consider whether such assessments increase effectiveness.
We have not found any common denominator that distinguishes effective programs from ineffective ones. We will continue the search, in future analyses, for information about the relative effectiveness of alternative approaches is an important objective of the NHRS.
Sloan and Steinwald (1980:107) conclude their study of the effects of regulation on hospital costs and input use with the following observation:
“Past research, on the whole, has failed to show that prospective reimbursement contains hospital costs. Our findings also suggest that PR has, at best, a very small negative effect on cost and input use. All we can say is PR has not proven itself to be an effective inflation strategy, and current reliance on PR to hinder future hospital cost increases is empirically unjustified.”
This paper, in general, duplicates the empirical results obtained by Sloan and Steinwald in that regulatory variables for the period prior to 1976 (the end of their data series) seldom enter as statistically significant in any of the regression equations presented here. The implications of the results we presented here for later years are substantially different, however. Seven to ten PR programs in existence after 1975, especially mandatory programs, are shown to be effective in controlling hospital expenditures, and future reliance on them to curb inflation is empirically justified.
We have examined only part of the evidence that deals with the effects of PR programs, and the results we presented in this paper are preliminary. In later phases of the NHRS, better data will be available for analysis, and we will undertake a much more comprehensive examination of program effects. Until an analysis has been made of the effects of PR programs on the quality of care, on the accessibility of hospital services, and on the financial viability of hospitals, the information necessary for sound policy decisions is not complete.
Figure 2. Estimated Annual Percentage Change in Expense per Adjusted Admission, With and Without Prospective Reimbursement Programs1.
1PR programs for which no graph is presented had no statistically significant effect on the annual percentage change in expense per adjusted admission.
Table 6. Regression Results for Model II, Percentage Change in Hospital Expenditures per Adjusted Admission.
| Dependent Variable: 100(CPAt − CPAt − 1)/CPCt − 1 | ||
|---|---|---|
| R2 = 0.057 | F(25,18806) = 45.3 | N = 18,831 |
|
| ||
| Explanatory Variable | Estimated Coefficient | t-Ratio |
| INTERCEPT | 7.87 | |
| D71 | −0.68 | 2.17 |
| D72 | −1.46 | 4.69 |
| D73 | −2.54 | 8.40 |
| D74 | 3.18 | 10.50 |
| D75 | 4.65 | 15.25 |
| D76 | −0.57 | 1.82 |
| D77 | −0.65 | 2.11 |
| D78 | −1.08 | 3.32 |
| GOV | −0.70 | 3.77 |
| PROF | −1.06 | 3.51 |
| In(CRIME) | 0.005 | 1.75 |
| ln(POPT18) | −0.84 | 2.93 |
| In(BIRTH) | −1.00 | 2.09 |
| ln(P) | 0.18 | 3.57 |
| DMS | 1.51 | 2.01 |
| DNB | −1.00 | 2.37 |
| DTX | −1.39 | 3.58 |
| CNMI | −1.58 | 2.46 |
| DCT75 | −2.56 | 2.93 |
| DMA76 | −1.87 | 3.04 |
| DMD76 | −4.24 | 3.97 |
| DMN78 | −2.20 | 2.27 |
| DNJ77 | −2.66 | 3.52 |
| DNY76 | −4.59 | 10.92 |
| DRI75 | −4.22 | 2.93 |
Table 7. Regression Results for Model III, Percentage Change in Hospital Expenditures per Capita.
| Dependent Variable: 100(CPCt − CPCt − 1)/CPCt − 1 | ||
|---|---|---|
| R2 = 0.093 | F(43,9931) = 32.93 | N = 10,047 |
|
| ||
| Explanatory Variable | Estimated Coefficient | t-Ratio |
| INTERCEPT | 12.96 | 6.17 |
| D71 | 5.21 | 13.13 |
| D72 | −2.09 | −5.34 |
| D73 | −1.04 | −2.69 |
| D74 | 2.68 | 6.94 |
| D75 | 4.01 | 10.48 |
| D76 | −0.98 | −2.55 |
| D77 | −2.46 | −6.44 |
| D78 | −1.03 | −2.75 |
| CNCA | −2.17 | −3.94 |
| CNMI | −3.29 | −2.97 |
| CNMN | −0.76 | −1.77 |
| CNNB | −1.01 | −1.87 |
| CNTX | 2.72 | 2.80 |
| CNWI | −3.20 | −3.87 |
| DID | −3.22 | −2.98 |
| DKY | −1.12 | −2.85 |
| DMA76 | −3.06 | −2.16 |
| DMI | 2.07 | 2.47 |
| DNC | −1.10 | −1.75 |
| DNY76 | −4.10 | −5.75 |
| DOK | −2.07 | −3.14 |
| DPA | 1.79 | 3.62 |
| DRI75 | −3.91 | −1.66 |
| DTX | −1.42 | −2.96 |
| DVA | −1.85 | −2.00 |
| DWA76 | −3.14 | −3.35 |
| DWI | 1.48 | 2.37 |
| DWV | 2.32 | 2.69 |
| LMDPOP | 1.25 | 6.45 |
| LP | 0.32 | 3.48 |
| LSPMD | 0.007 | 2.81 |
Table 8. Regression Results for Model IV, Hospital Expenditures per Adjusted Patient Day.
| Dependent Variable: In(CPD) | R2 = 0.767 | F(78,21883) = 923.21 | N = 21,961 | |||||
|---|---|---|---|---|---|---|---|---|
|
| ||||||||
| Explanatory Variable | Estimated Coefficient | t-Ratio | Explanatory Variable | Estimated Coefficient | t-Ratio | Explanatory Variable | Estimated Coefficient | t-ratio |
| INTERCEPT | 2.81 | DKS | −0.09 | 6.47 | CNGA | 0.13 | 4.35 | |
| D70 | 0.13 | 16.45 | DKY | −0.12 | 10.93 | CNIL | 0.06 | 3.00 |
| D71 | 0.13 | 18.32 | DLA | 0.03 | 2.08 | CNMD | 0.06 | 2.05 |
| D72 | 0.10 | 14.56 | DME | 0.08 | 4.13 | CNMI | 0.07 | 4.24 |
| D73 | 0.06 | 8.64 | DMD | 0.08 | 2.97 | CNPA | 0.05 | 3.54 |
| D74 | 0.09 | 12.84 | DMA | 0.14 | 13.58 | CNWI | −0.03 | 3.02 |
| D75 | 0.17 | 20.80 | DMS | −0.21 | 11.44 | CNWY | 0.15 | 1.96 |
| D76 | 0.12 | 16.37 | DMO | −0.08 | 5.08 | DAZ74 | −0.05 | 2.19 |
| D77 | 0.12 | 16.37 | DNB | −0.07 | 6.19 | DCT75 | −0.07 | 2.93 |
| D78 | 0.09 | 11.44 | DNV | 0.07 | 1.92 | DIN60 | −0.06 | 7.30 |
| GOV | 0.04 | 10.51 | DNJ | −0.05 | 4.71 | DKY75 | −0.06 | 3.65 |
| PROF | −0.07 | 10.46 | DNM | 0.15 | 6.27 | DMA76 | −0.05 | 3.34 |
| In(CRIME) | −0.0004 | 5.16 | DNY | 0.03 | 2.78 | DMD76 | −0.11 | 3.65 |
| ln(POPT18) | −0.14 | 20.46 | DNC | −0.19 | 12.32 | DMNA75 | −0.04 | 2.93 |
| In(POPDENS) | 0.04 | 15.91 | DND | −0.08 | 3.34 | DNJ77 | −0.04 | 2.18 |
| In(BIRTH) | 0.03 | 2.73 | DOH | −0.06 | 4.71 | DNY71 | −0.03 | 2.10 |
| In(MDPOP) | 0.08 | 21.81 | DOK | 0.06 | 3.76 | DNY76 | −0.11 | 9.31 |
| In(NHBPC) | −0.0003 | 3.47 | DOR | 0.26 | 14.09 | |||
| ln(WHITE) | −0.04 | 2.92 | DPA | −0.12 | 10.00 | |||
| In(UNEMRT) | −0.04 | 4.20 | DRI | 0.13 | 5.92 | |||
| In(INCOME) | 0.13 | 11.11 | DSC | −0.19 | 7.97 | |||
| ln(P) | 0.02 | 6.74 | DSD | 0.07 | 3.05 | |||
| DAL | −0.05 | 2.89 | DTN | −0.09 | 5.37 | |||
| DAZ | 0.29 | 15.73 | DTX | −0.02 | 2.56 | |||
| DAR | −0.15 | 8.52 | DVT | 0.13 | 3.68 | |||
| DCA | 0.29 | 11.80 | DVA | −0.22 | 10.30 | |||
| DCO | 0.06 | 5.99 | DWA | 0.26 | 25.36 | |||
| DCT | 0.21 | 12.51 | DWV | −0.18 | 8.80 | |||
| DGA | −0.15 | 7.66 | PSRO | 0.03 | 4.20 | |||
| DIL | −0.04 | 2.61 | CNCA | 0.07 | 2.94 | |||
| DIA | −0.07 | 5.10 | CNFL | 0.06 | 3. | |||
Table 9. Regression Results for Model V, Hospital Expenditures per Adjusted Admission.
| Dependent Variable: In(CPA) | R2 = 0.739 | F(69,21888) = 897.6 | N = 21,957 | |||||
|---|---|---|---|---|---|---|---|---|
|
| ||||||||
| Explanatory Variable | Estimated Coefficient | t-Ratio | Explanatory Variable | Estimated Coefficient | t-Ratio | Explanatory Variable | Estimated Coefficient | t-ratio |
| INTERCEPT | 5.40 | DID | 0.11 | 3.56 | CNOK | −0.04 | 1.98 | |
| D70 | 0.11 | 12.79 | DIL | 0.08 | 6.81 | CNWA | −0.02 | 1.85 |
| D71 | 0.09 | 11.34 | DKS | 0.04 | 2.63 | DCT75 | −0.09 | 3.03 |
| D72 | 0.08 | 9.83 | DKY | −0.13 | 11.77 | DMA76 | −0.04 | 2.22 |
| D73 | 0.06 | 7.52 | DLA | −0.06 | 3.56 | DMNA75 | −0.06 | 4.03 |
| D74 | 0.08 | 10.44 | DMD | 0.22 | 15.90 | DNJV | 0.03 | 2.69 |
| D75 | 0.14 | 18.37 | DMA | 0.19 | 18.38 | DNY76 | −0.09 | 7.06 |
| D76 | 0.12 | 14.54 | DMI | 0.15 | 12.30 | DRI75 | −0.08 | 1.75 |
| D77 | 0.12 | 14.56 | DMN | 0.07 | 7.76 | |||
| D78 | 0.10 | 11.50 | DMS | −0.15 | 7.41 | |||
| GOV | 0.05 | 10.35 | DMO | 0.06 | 3.51 | |||
| PROF | −0.16 | 21.89 | DNV | 0.25 | 4.01 | |||
| DSMSA | 0.06 | 10.11 | DNH | −0.15 | 4.67 | |||
| In(CRIME) | −0.0005 | 6.05 | DNM | 0.08 | 3.01 | |||
| In(EDUC) | 0.20 | 6.11 | DNY | 0.17 | 21.75 | |||
| ln(POPT18) | 0.02 | 2.89 | DNC | −0.10 | 5.67 | |||
| In(POPDENS) | 0.06 | 22.47 | DOH | 0.07 | 5.20 | |||
| In(BIRTH) | −0.08 | 6.13 | DOR | 0.12 | 5.67 | |||
| In(MDPOP) | 0.10 | 23.49 | DWPV | 0.04 | 3.68 | |||
| In(NHBPC) | − 0.0003 | 3.41 | DRI | 0.23 | 7.45 | |||
| ln(WHITE) | −0.08 | 4.73 | DSC | −0.10 | 3.60 | |||
| In(INCOME) | 0.07 | 5.07 | DTN | −0.04 | 2.44 | |||
| ln(P) | 0.03 | 7.96 | DTX | −0.06 | 6.17 | |||
| DAL | 0.04 | 2.01 | DUT | −0.14 | 4.19 | |||
| DAZ | 0.25 | 17.18 | DVT | 0.19 | 4.62 | |||
| DAR | −0.23 | 11.40 | DWV | −0.06 | 2.61 | |||
| DCA | 0.18 | 17.23 | DWI | 0.04 | 4.73 | |||
| DCT | 0.19 | 10.19 | PSRO | 0.01 | 1.83 | |||
| DDE | 0.21 | 4.09 | CNGA | 0.07 | 2.02 | |||
| DDC | 0.14 | 2.23 | CNNB | −0.05 | 3.45 | |||
| DGA | −0.14 | 6.41 | CNNV | 0.22 | 2.79 | |||
Acknowledgments
This work was supported by HCFA Contract No. 500-78-0036.
Footnotes
The terms expenditure and cost are used interchangeably in this paper. Since the data used in analyses reflect hospital outlays rather than the opportunity cost of resources used, the term expenditure is technically more correct.
The major evaluations include: Rhode Island (Thornberry and Zimmerman, 1974); upstate New York (Cromwell et al., 1976); downstate New York (Dowling et al., 1976); New Jersey (Heaton et al., 1976); and Indiana (O'Donoghue, 1978).
See Boland and Reilly, 1980; Gaumer et al., 1980; Hamilton et al., 1980a; Hamilton and Kamens, 1980; Lee and Jensen, 1980; Sumner and Gaumer, 1980; Walter and DeMarco, 1980; and Worthington et al., 1980a and 1980b. Also see Hamilton et al., 1980b for a comparative review that synthesizes these nine reports.
See Coelen, et al. (1979), for a complete statement of the objectives and design of the evaluation.
ln Connecticut, for example, revenue from commercially insured and uninsured patients are the only revenues over which the State PR program has direct control. Medicare, for example, still bases reimbursement on its portion of the cost incurred by the hospital. Thus, revenue from Medicare is not directly affected by limits on total hospital revenue.
See Harvard Center for Community Health and Medical Care, 1974; American Hospital Association, 1977; and Health Care Financing Administration, 1978.
The AHA defines short-term hospitals as those having an average length of stay of less than 30 days per admission. It is very likely, however, that hospitals with long lengths of stay (20-30 days) provide different types of care and operate on a different implicit production function than do hospitals with short lengths of stay (3-10 days). To maximize the homogeneity of the NHRS sample, without excluding a large group of hospitals, short-term is defined in this study by length of stay of less than 15 days. The median of mean length of stay across years is used to define short-term to avoid hospitals' changing between short- and long-term categories from one year to the next.
No more than two contiguous missing values for a variable for a specific hospital were estimated, using data for the same variable and hospital for earlier and later years. Until recently, AHA estimated missing values by substituting the group mean for the year in which the value was missing. This technique produced data that exhibited unacceptably large year-to-year changes for a specific hospital and thus made AHAs estimated tape an unacceptable basis from which to calculate inflation rates.
ln fact, the available data on physician payrolls were the most suspect of all the data used. Some hospitals reported physician payrolls for some years but not for others, when the data indicated that they had hospital-based physicians in all years. A special effort was made to identify suspect values and to insert reasonable estimates (by interpolation or extrapolation) in their place.
lf there is a bias, it should be that the savings from PR is overstated. If the effect of a program is the elimination of some services, county residents may travel outside the county to seek those services, and the associated expenditures would not occur, but the total county population will be counted. This will cause the data to indicate erroneously that outlays for hospital care per person have declined. Since the “study” areas are generally States, such occurrences will affect the estimated effects of PR only if residents actually travel outside the State. Such episodes are likely to represent only a small portion of total expenditures.
Most PR programs do not cover long-term and specialty hospitals.
The first and last of these three studies used only reduced-form equations in econometric analysis. The second used structural equations that are rich in exogenous variables.
Sloan and Steinwald report that county income per capita (used here) is highly correlated with regional wage indices. The omission of a wage index from the analysis report here should therefore not represent a serious problem.
Other programs generally cover only part of a State (for example, Cleveland, Ohio) or cover all of the hospitals in a State with a small hospital population (for example, Delaware). Too few observations are available in the research sample to detect the effects of these small programs with adequate statistical power.
For variables that take on values of 0.0 (for example, physicians per capita in a county), a very small fraction has been added to the variable before the logarithm is calculated.
The data used by Sloan and Steinwald (1980) were for a sample of 1228 hospitals for each of the seven years from 1969 to 1975. When the lagged dependent variables are included in the regression equations analyzed in this study for expenditures per day and expenditures per admission, R2s increase to 0.92 and 0.94, respectively. It is not possible to determine whether the surprisingly low R2s reported by Sloan and Steinwald are due to the special estimation technique they used or to other factors. Using a relatively small sample of hospitals, using data for the years 1961 to 1967, and including the lagged dependent variable, Salkever (1972) obtained R2s of above 0.9 for equations explaining expenditures per patient day.
Dummy variables for each of 47 States (excluding Wyoming, to prevent perfect multi-collinearity) and for the District of Columbia were tested for potential inclusion in each regression equation. These variables allowed for pre-PR period differences among States and do not destroy the interpretation of the coefficients of DSA-type variables as measures of the effects of PR programs. In short, the four-way design is made more flexible by the testing for differences within the control group States.
The results reported here for the effects of CN on hospital expenditures are consistent with those obtained by Sloan and Steinwald (1980), using data for 1969 through 1975. They could not estimate the effects of PSRO review but did find that utilization review programs run by Blue Cross and Medicaid were associated with lower expenditures per adjusted admission.
It should be noted that annual rates of increase in hospital expenditures and consumer prices are not strictly comparable. Increases in hospital expenditures reflect increases in service utilization as well as in the price per unit of service. To insist that the two “inflation” rates should be equal is to insist that service utilization should not increase.
The less than impressive results for Washington are not surprising, for the strongest version of that program was not implemented until fiscal year 1978. As noted earlier, the implied reduction in per capita expenditures in Washington is suspect because there is no evidence of a statistically significant reduction in expenditures per patient day or per admission.
References
- American Hospital Association. Report on Budget/Rate Review Programs. Mimeographed; Chicago: 1977. [Google Scholar]
- Biles Brian, et al. Hospital Cost Inflation under State Rate-Setting Programs. New England Journal of Medicine. 1980 Sep 18;303(12):664–668. doi: 10.1056/NEJM198009183031203. [DOI] [PubMed] [Google Scholar]
- Boland J, Reilly H. “Case Study of Prospective Reimbursement in Arizona,” Vol. I of “National Hospital Rate-Setting Study”. Health Care Financing Grants and Contracts Report. 1980 Apr; [Google Scholar]
- Coelen C, et al. National Hospital Rate-Setting Study: Research Objectives and Methodology. Report prepared for DHEW under Contract No HEW-500-78-0036. 1979 [Google Scholar]
- Cromwell J, et al. Analysis of Prospective Payment Systems for Upstate New York. Final report prepared for DHEW under Contract No HEW-OS-74-261. 1976 [Google Scholar]
- Davis K. The Role of Technology, Demand and Labor Markets in Determination of Hospital Costs. In: Perlman M, editor. Economics of Health and Medical Care; proceedings of a conference held by the International Economics Association at Tokyo; New York: John Wiley and Sons; 1974. [Google Scholar]
- Dowling WL, et al. Evaluation of Blue Cross and Medicaid Prospective Reimbursement Systems in Downstate New York. Final report prepared for DHEW under Contract No HEW-OS-74-248. 1976 [Google Scholar]
- Gaumer G, et al. “Case Study of Prospective Reimbursement in Connecticut,” Vol. II of “National Hospital Rate-Setting Study”. Health Care Financing Grants and Contracts Report. 1980 Apr; [Google Scholar]
- Hamilton D, et al. “Case Study of Prospective Reimbursement in Washington,” Vol. VIII of “National Hospital Rate-Setting Study”. Health Care Financing Grants and Contracts Report. 1980 Apr; [Google Scholar]
- Hamilton D, et al. Comparative Review of Nine Prospective Rate-Setting Programs. First Annual Report of the National Hospital Rate-Setting Study prepared for DHHS under Contract No HCFA-500-78-0036. 1980 Jan; [Google Scholar]
- Hamilton D, Kamens G. “Case Study of Prospective Reimbursement in New York,” Vol. VII of “National Hospital Rate-Setting Study”. Health Care Financing Grants and Contracts Report. 1980 Apr; [Google Scholar]
- Harvard Center for Community Health and Medical Care. Summaries of Eleven Reports on Prospective Reimbursement. Report prepared under NCHS Grant 5-P16-HS00472. 1974 Mar; [Google Scholar]
- Health Care Financing Administration. Abstracts of State Legislated Hospital Cost Containment Programs. 1978 May; DHEW, HCFA Pub. No. 017 (5-78) [PMC free article] [PubMed] [Google Scholar]
- Health Insurance Institute of America. Hospital Cost Control—The State Option. Viewpoint. 1978 Mar; [Google Scholar]
- Heaton H, et al. Analysis of the New Jersey Hospital Prospective Reimbursement System: 1968-1973. Final report prepared for DHEW under Contract No HEW-OS-74-268. 1976 [Google Scholar]
- Hellinger FJ. An Empirical Analysis of Several Prospective Reimbursement Systems. In: Zubkoff, Raskin, Hanft, editors. Hospital Cost Containment: Selected Notes for Future Policy. Milbank Memorial Fund; 1978. [Google Scholar]
- Lave JR, Lave LB. Hospital Cost Function Analysis: Implications for Cost Controls. In: Zubkoff, Raskin, Hanft, editors. Hospital Cost Containment: Selected Notes for Future Policy. Milbank Memorial Fund; 1978. [Google Scholar]
- Lee J, Jensen G. “Case Study of Prospective Reimbursement in Minnesota,” Vol. V of “National Hospital Rate-Setting Study”. Health Care Financing Grants and Contracts Report. 1980 Apr; [Google Scholar]
- O'Donoghue P. Controlling Hospital Costs: The Revealing Case of Indiana. Denver: Policy Center, Inc.; 1978. [PubMed] [Google Scholar]
- Salkever D. A Microeconomic Study of Hospital Cost Inflation. Journal of Political Economy. 1972 Nov-Dec;80(6):1144–1166. [Google Scholar]
- Sloan FA, Steinwald B. Effects of Regulation on Hospital Costs and Input Use. The Journal of Law and Economics. 1980 Apr;23:81–109. doi: 10.1086/466953. [DOI] [PubMed] [Google Scholar]
- Sumner M, Gaumer G. “Case Study of Prospective Reimbursement in Western Pennsylvania,” Vol. IX of “National Hospital Rate-Setting Study”. Health Care Financing Grants and Contracts Report. 1980 Apr; [PubMed] [Google Scholar]
- Thornberry H, Zimmerman H. Hospital Cost Control: An Assessment of the Rhode Island Experience with Prospective Reimbursement, 1971 and 1972. Report prepared for HEW under Contract No HEW-OS-74-1975. 1974 [Google Scholar]
- Walter R, DeMarco J. “Case Study of Prospective Reimbursement in Massachusetts,” Vol. IV of “National Hospital Rate-Setting Study”. Health Care Financing Grants and Contracts Report. 1980 Apr; [Google Scholar]
- Worthington N. “Case Study of Prospective Reimbursement in Maryland,” Vol. III of “National Hospital Rate-Setting Study”. Health Care Financing Grants and Contracts Report. 1980 Apr; [Google Scholar]
- Worthington N, et al. “Case Study of Prospective Reimbursement in New Jersey,” Vol. VI of “National Hospital Rate-Setting Study”. Health Care Financing Grants and Contracts Report. 1980 Apr; [Google Scholar]


