

Abstract
Flowering time is an important trait in wheat breeding as it affects adaptation and yield potential. The aim of this study was to investigate the genetic architecture of flowering time in European winter bread wheat cultivars. To this end a population of 410 winter wheat varieties was evaluated in multi-location field trials and genotyped by a genotyping-by-sequencing approach and candidate gene markers. Our analyses revealed that the photoperiod regulator Ppd-D1 is the major factor affecting flowering time in this germplasm set, explaining 58% of the genotypic variance. Copy number variation at the Ppd-B1 locus was present but explains only 3.2% and thus a comparably small proportion of genotypic variance. By contrast, the plant height loci Rht-B1 and Rht-D1 had no effect on flowering time. The genome-wide scan identified six QTL which each explain only a small proportion of genotypic variance and in addition we identified a number of epistatic QTL, also with small effects. Taken together, our results show that flowering time in European winter bread wheat cultivars is mainly controlled by Ppd-D1 while the fine tuning to local climatic conditions is achieved through Ppd-B1 copy number variation and a larger number of QTL with small effects.
Keywords: wheat, flowering time, photoperiod, Ppd, copy number variation, epistasis, candidate genes, association mapping
Introduction
Flowering time is one of the most important phenological stages in crop development, as it is key to adaptation, yield potential and yield stability (Snape et al., 2001; Mühleisen et al., 2013). Wheat (Triticum aestivum L.) covers more of the world's surface than any other food crop and has the largest production volume of all staple crops in Europe (FAO, 2013). This worldwide expansion and success were possible because of the adaptability of wheat flowering time to different environmental conditions as facilitated by the vast natural variation provided by the hexaploid wheat genome (Worland and Snape, 2001). Understanding the genetic control of flowering time may increasingly gain importance as extreme weather conditions will be expected to occur more frequently already in the near future (Beniston et al., 2007) with potentially negative effects on yield. For example, tailoring flowering time of wheat to local climatic conditions facilitates avoiding high temperatures and drought stress during anthesis and grain filling (Bennett et al., 2012; Bentley et al., 2013). The prediction of flowering time thus plays a key role in adaptation breeding as well as to efficiently transfer promising genotypes into regions with different climatic conditions. Furthermore, in order to increase wheat yield potential, an initiative has recently been started to launch hybrid breeding in wheat (Longin et al., 2012; Whitford et al., 2013). Especially for hybrid seed production, the timing of flowering between male and female parental lines has to be synchronized and in addition, the vulnerability during anthesis can result in decreased pollen production (Pickett, 1993; Longin et al., 2013; Langer et al., 2014).
Flowering time in cereals is controlled by three different signaling pathways: the vernalization (Vrn), photoperiod (Ppd) and earliness per se (Eps) pathway (for review see Snape et al., 2001; Distelfeld et al., 2009; Kamran et al., 2014). The group of Vrn genes regulates the transition from the vegetative to the generative phase in response to temperature (Distelfeld et al., 2009; Allard et al., 2012) and thus determines winter and spring growth habit. These genes play, however, only a minor role for winter wheat flowering time provided that the vernalization requirement is fulfilled (Kamran et al., 2014). Wheat is a photoperiod sensitive crop and thus flowers only after a critical day length has been reached. However, photoperiod insensitivity has been selected by plant breeders for several decades to enhance yield in certain climatic conditions. Photoperiod (Ppd) loci genetically control the response to photoperiod, with photoperiod insensitive alleles inducing flowering irrespective of day length. Ppd-1 encodes a pseudo-response regulator (PRR) (Turner et al., 2005) and the Ppd-1 homeoloci are located on group 2 chromosomes. Eps summarizes all other loci that affect flowering time independently of vernalization and photoperiod response (Worland, 1996; Kamran et al., 2014; Zikhali et al., 2014). Furthermore, different studies reported a moderate but significant correlation between heading time and plant height and Wilhelm et al. (2013) reported a significant effect of Reduced height (Rht)-B1 on heading suggesting that genes controlling plant height might also affect flowering time.
For a long time single nucleotide polymorphisms (SNPs) and small insertions-deletions (INDELs) were assumed to be the major types of DNA polymorphisms underlying genotypic variation. However, during the last decade, copy number variation (CNV) was found to be abundant in the human genome (Iafrate et al., 2004; Sebat et al., 2004), affecting the human phenotype and often linked to diseases. By contrast, the extent to which CNVs affect genotypic variation in plants is largely unknown. Copy number variation refers to genomic rearrangements of sequences typically larger than 1 kb, resulting in the gain or loss of DNA segments (Zmienko et al., 2014). Notably, in polyploid plants copy number variation refers to the number of copies per haploid genome. CNVs mainly occur in intergenic regions but can also encompass protein-coding genes or sequences containing regulatory elements. Such CNVs changing the number of functional copies or regulatory elements can affect the expression level of genes. The effects of CNVs have remained undetected in classical QTL mapping experiments because the CNVs are generally not detectable by the commonly used marker systems (e.g., SSRs, DArTs, SNPs). A still small but growing number of reports suggest that copy number variations also contribute to the genotypic variation of important traits in plants, including flowering time (Díaz et al., 2012; Zmienko et al., 2014).
QTL for heading and flowering time in wheat have been identified in several linkage mapping and association mapping studies, mostly based on biparental collections or collections of rather diverse germplasm (Hanocq et al., 2004; Griffiths et al., 2009; Reif et al., 2011b; Rousset et al., 2011; Bennett et al., 2012; Le Gouis et al., 2012; Kamran et al., 2014). The aim of this study was therefore, to employ a candidate gene approach and genotyping-by-sequencing to generate high-density marker data to dissect the genetic architecture of flowering time in European winter bread wheat cultivars. In particular, the objectives of our study were to (1) employ high-density genome-wide association mapping to identify main effect QTL for flowering time based on a population of European winter bread wheat with 410 genotypes evaluated in multi-location field trials, (2) assess the frequency of alleles at Ppd, Vrn, and Rht candidate genes as well as copy number variation at the Ppd-B1 locus and to evaluate their effects on flowering time, (3) assess the contribution of epistasis to the genetic architecture of flowering time, and (4) to draw conclusions for plant breeding.
Materials and methods
Plant materials, field experiments and meteorological data
A total of 410 winter bread wheat (T. aestivum L.) lines were used for this study. Genotypes were European varieties released during the past decades mainly in Austria, Czech Republic, Denmark, Eastern Europe, France, Germany, Poland, Russia, Turkey, and the United Kingdom. The genotypes are referred to as elite germplasm to distinguish it from genotypes not derived from breeding programs. Experiments were conducted in 2012 at three locations in partially replicated designs with a replication rate of 1.27 per location (Williams et al., 2011). Locations were Hohenheim (48°42′50″N, 9°12′58″E, 400 m above sea level (asl), growing season mean temperature 9.6°C and mean precipitation 790 mm, soil type silty loam), Ihinger Hof (48°44′50″N, 8°55′18″E, 493 m asl, growing season mean temperature 8.7°C and mean precipitation 923 mm, soil type silty clay) and Oberer Lindenhof (48°28′26″N, 9°18′12″E, 700 m asl, growing season mean temperature 7.4°C and mean precipitation 1115 mm, soil type silty loam; later referred to as Lindenhof). Entries were sown in observation plots of two rows and 1.25 m length.
Meteorological data were obtained from weather stations directly located at the fields where the experiments were grown (Figure S1A). Hourly air temperature values, measured at 2 m height, were available for Hohenheim and Ihinger Hof and temperatures at 01.00, 07.00, 13.00, and 19.00 h for the station Lindenhof. In order to demonstrate vernalization conditions for each location, cumulative vernalized day degrees were calculated for days from germination employing the method described by Weir et al. (1984) using, however, all available temperature values. Vernalization is best obtained between 3 and 10°C while temperatures between −4 and 3°C as well as between 10 and 17°C result in slower vernalization (Weir et al., 1984; Eagles et al., 2010). For winter wheat, the vernalization requirement can be assumed to be fulfilled when the sum of the accumulated vernalized day degrees has reached 33 vernal days (Weir et al., 1984; Eagles et al., 2010). Days of full vernalization and sum of accumulated vernalized day degrees at January 1st for each location are given in Figure S1B.
Heading date, representing flowering time, was recorded as days after January 1st when 75% of the spikes of an observation plot had emerged to 75% from the flag leaf sheath. Thermal time, often used to more consistently describe the phenological development of plants (Eagles et al., 2010; Rousset et al., 2011; Allard et al., 2012; Cane et al., 2013), was calculated for this time period as the sum of accumulated degree days (°Cd) which are a function of the daily mean temperature and the base temperature of 0°C (Weir et al., 1984).
Molecular data analysis and candidate genes
All lines were genotyped by genotyping-by-sequencing (GBS) at Diversity Arrays Technology (Yarralumla, Australia) using the Wheat GBS 1.0 assay. Markers with more than 25% missing values and those with a minor allele frequency smaller 0.05 were removed resulting in a total of 23,371 markers for which a map position was available and that were used for the analyses. Associations among the 410 genotypes were analyzed by applying principal coordinate analysis (Gower, 1966) based on the Rogers' distances of the individuals (Wright, 1978) and was done with the software package Plabsoft (Maurer et al., 2008).
For the candidate gene approach, all lines were genotyped for alleles of Ppd-A1, Ppd-B1, Ppd-D1, Rht-B1, Rht-D1, Rht8-D2, Vrn-A1, Vrn-B1, Vrn-B3, and Vrn-D1 (Liu et al., 2012b; Kamran et al., 2014). For the detection of the photoperiod insensitive alleles Ppd-A1a.1 and Ppd-B1a.1 (1085bp deletion and 308bp insertion, respectively) and photoperiod sensitive Ppd-A1b.1 and Ppd-B1b.1 the approach described by Nishida et al. (2013) was used. Copy numbers for Ppd-B1 (Ppd-B1a, Ppd-B1b, Ppd-B1c, Ppd-B1d, and Ppd-B1e indicating 3, 1, 4, 2, and 0 copies, respectively) were detected following the protocol described by Díaz et al. (2012) using, however, [6FAM-BHQ1] and [CY5-BHQ3] labeled probes for Ppd-B1 and TaCO2, respectively, and the Roche LightCycler® 480 System in combination with the Roche LightCycler® 480 Probes Master mastermix. The photoperiod insensitive allele Ppd-D1a (candidate causal deletion of 2089bp upstream coding region, ‘Ciano67’ type) and photoperiod sensitive Ppd-D1b were detected following the method described by Beales et al. (2007). Allelic variation of Rht8 was detected employing the diagnostic microsatellite marker WMS 261 (Korzun et al., 1998). Protocols for reduced height alleles causing semi-dwarfism (Rht-B1b, Rht-D1b) and tall alleles (Rht-B1a, Rht-D1a) were reported by Ellis et al. (2002). Protocols for alleles at Vrn-A1 (Vrn-A1a, Vrn-A1b, Vrn-A1c), Vrn-B1 (Vrn-B1, vrn-B1), Vrn-B3 (Vrn-B3, vrn-B3), and Vrn-D1 (Vrn-D1, vrn-D1) were described by Yan et al. (2004), Chu et al. (2011), Yan et al. (2006), and Fu et al. (2005), respectively.
Phenotypic data analysis
The phenotypic data were analyzed based on the following statistical model: yijko = μ + gi + lj + glij + rjk + bjko + eijko, where yijko was the phenotypic observation of the ith wheat line at the jth location in the oth incomplete block of the kth replication, μ was an intercept term, gi the genetic effect of the ith genotype, lj the effect of the jth location, glij the genotype-by-location interaction, rjk the effect of the kth replication at the jth location, bjko the effect of the oth incomplete block of the kth replication at the jth location, and eijko was the residual. Error variances were assumed to be heterogeneous among locations. Variance components were determined by the restricted maximum likelihood (REML) method assuming a random model. Significance of variance component estimates was tested by model comparison with likelihood ratio tests. Best linear unbiased estimates (BLUEs) were estimated across locations assuming fixed effects for the genotype. Heritability (h2) on an entry-mean basis was calculated as the ratio of genotypic to phenotypic variance according to Melchinger et al. (1998). All statistical analyses were performed using ASReml 3.0 (Gilmour et al., 2009).
Association mapping
For association mapping an additive genetic model was chosen and mapping was done with a mixed model incorporating a kinship matrix as described previously (Yu et al., 2005; Würschum and Kraft, 2014). In brief, the model was: yijp = μ + ap + gi + lj + eijp, where yijp is the adjusted entry mean of the ith wheat line at the jth location carrying allele p, μ the intercept term, ap the allele substitution effect of allele p, gi the genetic effect of the ith wheat line, lj the effect of the jth location, and eijp the residual including the genotype-by-location interaction effect. The allele substitution effect ap was modeled as fixed effect whereas gi and lj were regarded as random effects. The variance of the random genetic effect was assumed to be Var(g) = 2Kσ2G, where σ2G refers to the genetic variance estimated by REML and K was a 410 × 410 matrix of kinship coefficients that define the degree of genetic covariance between all pairs of entries. We followed the suggestion of Bernardo (1993) and calculated the kinship coefficient Kij between inbreds i and j on the basis of marker data as described by Würschum et al. (2011, 2012). For the detection of main effect QTL, a genome-wide scan for marker-trait associations was conducted. To control for multiple testing, we followed the suggestion of Kraakman et al. (2004) and tested at a false discovery rate (FDR) of 0.20 (Benjamini and Hochberg, 1995). The two-dimensional epistasis scan was done based on 2594 equally spaced markers by extending the above model to marker-marker interactions including the subordinated main effects. For the significance level for the epistatic QTL we used an α-level of 0.01 and followed the suggestion of Holland et al. (2002) dividing the α-level by the number of possible independent pairwise interactions between chromosome regions, assuming two separate regions per chromosome (P < 1.2e-5). The circular plots illustrating the epistatic interactions were created with Circos (Krzywinski et al., 2009).
The total proportion of genotypic variance (pG) explained by the detected QTL was calculated by fitting all QTL and the segregating candidate genes simultaneously in a linear model to obtain the adjusted R2 R2adj which corrects for the number of parameters in the linear model. The ratio pG = R2adj / h2, where h2 refers to the heritability of the trait, yielded the proportion of genotypic variance (Utz et al., 2000). The pG values of individual QTL were accordingly derived from the sums of squares of the QTL (SSQTL) in this linear model.
Results
The 410 winter bread wheat genotypes were evaluated at three locations where the vernalization saturation for winter wheat was reached after 38, 39, and 44 days from germination (Figures S1A,B). The sum of accumulated vernalized day degrees at January 1st was 53.5, 47.0, and 53.9 (Figure S1B). We recorded heading date as days after January 1st and also calculated thermal time to heading by taking into account the temperature per location. The genotypic variance as well as the genotype-by-location interaction variance were significantly larger than zero (P < 0.01) for both traits. The heritability estimates were high with 0.93 for heading date and 0.94 for thermal time to heading (Table 1). Heading date BLUEs across locations showed a wide range of 27 days between the earliest and latest variety. The BLUEs per location revealed a strong effect of the location on heading date with Hohenheim being the earliest location and Lindenhof the latest (Figure 1). While the temperature profiles at the three locations ran in parallel, they were highest for Hohenheim and lowest for Lindenhof (Figure S1A). The BLUEs per location for thermal time to heading, i.e., taking the different temperatures at each location into account, largely eliminated the differences between the three locations (Figure 1).
Table 1.
Summary statistics for heading date (HD) and thermal time (TT).
| Parameter | HD | TT |
|---|---|---|
| Min | 140.60 | 810.20 |
| Mean | 157.60 | 1082.00 |
| Max | 167.70 | 1238.00 |
| σ2G | 13.79** | 3909.60** |
| σ2G × L | 0.61** | 83.10** |
| σ2e | 3.35 | 804.39 |
| h2 | 0.93 | 0.94 |
Genotypic variance (σ2G), genotype-by-location interaction variance (σ2G × L), error variance (σ2e), and heritability (h2).
significant at the 0.01 probability level.
Figure 1.
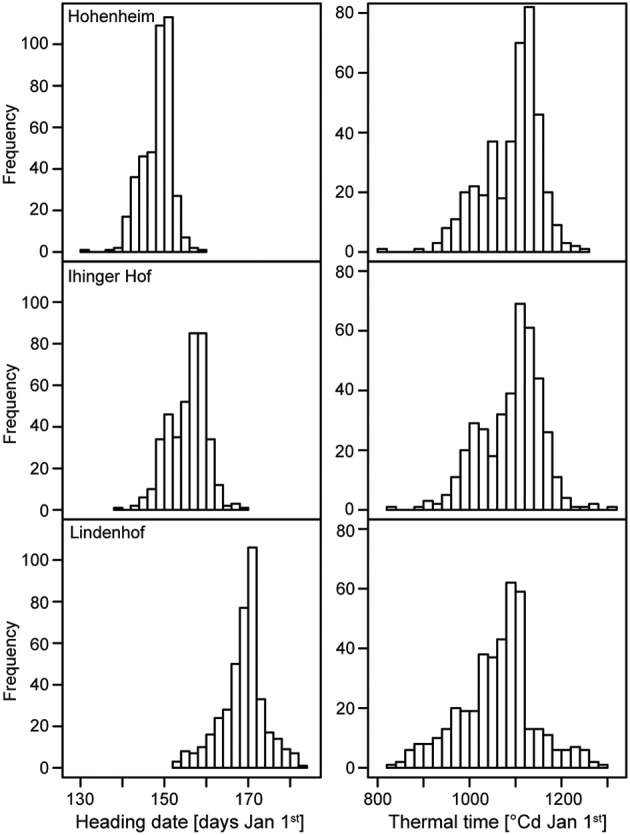
Histograms of the distribution of the phenotypic values of heading date and thermal time to heading at three locations.
The candidate gene approach revealed no differences between the 410 genotypes for the Ppd-A1, Ppd-B1, Vrn-A1, Vrn-B1, Vrn-B3, and Vrn-D1 genes. All varieties carried the alleles Ppd-A1b.1, Ppd-B1b.1, Vrn-A1c, vrn-B1, vrn-B3, and vrn-D1. By contrast, polymorphisms were detected for Ppd-B1 copy number, Ppd-D1, Rht8, Rht-B1, and Rht-D1. For the major photoperiod regulator Ppd-D1, 18% of the genotypes carried the photoperiod insensitive Ppd-D1a allele and 82% the photoperiod sensitive Ppd-D1b allele. For the plant height regulator Rht-B1, 88% carried the Rht-B1a allele and 12% the semi-dwarfing Rht-B1b allele, whereas for Rht-D1 61% carried the Rht-D1a allele and 39% the semi-dwarfing Rht-D1b allele. Copy number variation at the Ppd-B1 locus was also present in this panel of cultivars and the majority of the genotypes had one copy (382), 21 had two copies and 5 had three copies of Ppd-B1. Consistent with Cane et al. (2013) we also observed one genotype (‘Naridana’) for which the Ppd-B1 gene appears to be absent. Genotypes carrying the photoperiod insensitive Ppd-D1a allele were substantially earlier flowering than the genotypes with the photoperiod sensitive Ppd-D1b allele (Figure 2A). Ppd-D1 consequently also explained 58.2% of the genotypic variance for thermal time to heading (Table 2). For Ppd-B1 copy number variation, the genotypes carrying two copies of the gene flowered earlier that the ones with only one copy while the few genotypes with three copies appear to be even earlier (Figure 2B). Increasing copy number at Ppd-B1 resulted in earlier flowering in a Ppd-D1b background while it may have no or only a small effect in plants homozygous for Ppd-D1a. While there was no difference in thermal time to heading for the two alleles at the Rht-D1 locus, we found that the plants carrying the semi-dwarfing Rht-B1b allele flowered earlier than the tall Rht-B1a plants (Figure 2A). This however, was due to different frequencies of Ppd-D1a alleles in both groups. Within plants carrying the Rht-B1a allele only 12.5% carried the photoperiod insensitive Ppd-D1a allele whereas within the plants carrying the Rht-B1b allele 55.3% carried Ppd-D1a. After a grouping of the plants according to their allele status at Ppd-D1, no differences in thermal time to heading were observed any more between the two Rht-B1 alleles. Consistently, both Rht-B1 and Rht-D1 did not explain any genotypic variation of thermal time to heading (Table 2). By contrast, the height-reducing allele at the Rht8 locus (192bp allele) reduced thermal time to heading and may even have a small effect in a Ppd-D1a background (Figure S4). However, overall the effect of Rht8 was found to be small as it explained only 1.5% of the genotypic variance (Table 2).
Figure 2.

Boxplots showing thermal time to heading for genotypes carrying different candidate gene alleles. (A) Ppd-D1: a (photoperiod insensitive, Ciano67 type), b (photoperiod sensitive); Rht-B1: a (tall allele), b (semi dwarfism); Rht-D1: a (tall allele), b (semi dwarfism). Boxplots between the dashed lines represent groups of genotypes with combinations of Ppd-D1 and Rht-B1 alleles; numbers underneath refer to the number of genotypes per group. (B) Ppd-B1 copy number alleles identified in this study, Ppd-B1a, Ppd-B1b and Ppd-B1d (numbers in parentheses indicate the copy number); groups of genotypes with combinations of Ppd-B1 and Ppd-D1 alleles.
Table 2.
Candidate genes and QTL detected for thermal time to heading.
| Marker/CloneID | Chr. | Pos. | pG | α-effect | Allele frequencies separated for Ppd-D1 alleles | |
|---|---|---|---|---|---|---|
| Ppd-D1a | Ppd-D1b | |||||
| CANDIDATE GENES | ||||||
| Ppd-D1 | 2D | 58.2 | −36.1 | 0.18 | 0.82 | |
| Ppd-B1 CNV | 2B | 3.2 | −21.4 | |||
| Rht-B1 | 4B | 0.0 | −3.1 | 0.07 | 0.05 | |
| Rht-D1 | 4D | 0.1 | −7.1 | 0.04 | 0.36 | |
| Rht8-192bp | 2D | 1.5 | −4.6 | 0.09 | 0.03 | |
| GENOME-WIDE SCAN | ||||||
| 1089381 | 5B | 12.4 | 2.0 | 9.9 | 0.07 | 0.70 |
| 1006120 | 5B | 104.3 | 2.2 | 9.1 | 0.07 | 0.27 |
| 2297164 | 5B | 209.8 | 2.9 | −22.1 | 0.12 | 0.13 |
| 1218093 | 1D | 48.3 | 2.3 | 11.8 | 0.08 | 0.04 |
| 994134 | 6D | 184.9 | 0.1 | −1.2 | 0.18 | 0.67 |
| GENOME-WIDE SCAN WITH Ppd-D1 AS COFACTOR | ||||||
| 1083683 | 4B | 145.9 | 1.5 | −13.4 | 0.05 | 0.09 |
Chromosome, position (cM), proportion of genotypic variance explained by the QTL (pG in %), allele substitution (α) effect, and allele frequencies of markers separated according to the Ppd-D1 genotype. QTL allele frequencies refer to the alleles conferring earlier flowering. Rht-B1 and Rht-D1 allele frequencies refer to the dwarfing alleles Rht-B1b and Rht-D1b, respectively.
The 410 individuals of the mapping population were genotyped by a genotyping-by-sequencing approach which after quality checks yielded 23,371 polymorphic markers with known map position that were used for further analyses. In accordance with previous studies using elite European winter bread wheat (Reif et al., 2011a; Würschum et al., 2013b), the principal coordinate analysis revealed only a slight population structure and the first two principal coordinates explained 19.2 and 8.2% of the variance, respectively (Figure S2). The genome-wide scan for marker-trait associations identified 5 significantly associated markers on chromosomes 5B, 1D, and 6D (Figure 3) which explained between 0.1 and 2.9% of the genotypic variance (Table 2). In addition, we performed a genome-wide scan with Ppd-D1 as cofactor in the model which revealed another QTL on chromosome 4B explaining 1.5% of the genotypic variance. Together, the five candidate genes and the six identified QTL explained 72.2% of the genotypic variance. The epistasis scan identified 30 significant epistatic interactions (Figure 4) which explained between 0.1 and 2.2% of the genotypic variance (Table S1).
Figure 3.

Genome-wide scan for markers associated with thermal time to heading. The dashed horizontal line indicates the significance threshold.
Figure 4.
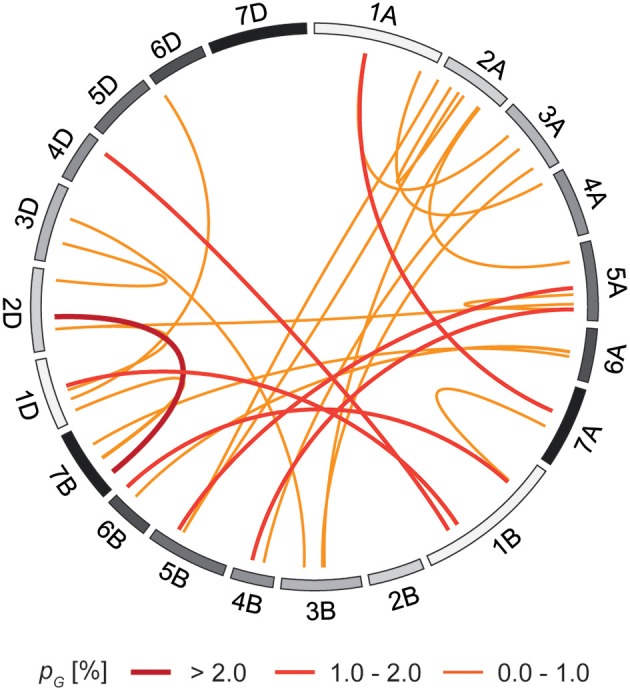
Epistatic QTL for thermal time to heading.
For 379 varieties the country of origin was known and we used this information to analyze the frequency of Ppd-D1, Ppd-B1 CNV, and QTL alleles dependent on the geographic origin (Figure 5). For Ppd-D1 the photoperiod insensitive allele Ppd-D1a was rare in the UK, Denmark, Germany, Poland, the Czech Republic and in Austria. By contrast, about a third of the French lines carry this allele and in Eastern Europe and Russia it is the predominant allele. For Ppd-B1 copy number, the one-copy allele is the prevalent allele in all regions and the two-copy allele was mainly found in varieties from the more southern countries. In addition, we analyzed the frequencies of the alleles causing earlier flowering for the detected QTL in the same geographic regions and observed a similar picture. With the exception of one QTL (CloneID 1089381), the allele causing earlier flowering is the minor allele in the first group of countries and occurs at a higher frequency in Eastern Europe and Russia.
Figure 5.

Distribution of Ppd-D1, Ppd-B1 copy number and identified QTL alleles in European winter bread wheat in dependence on the country of origin of the variety. For the QTL the frequency of the allele causing early flowering is shown. Numbers in pie charts indicate the number of varieties for the respective allele. The copy number of the Ppd-B1a, b, and d alleles is shown in parentheses.
Discussion
Phenotypic evaluation of flowering time in european winter bread wheat cultivars
Flowering time is of importance in plant breeding as it is central for the adaptation of wheat to different climatic regions and consequently also affects yield potential. The observed genotypic variance of heading date and thermal time to heading was several times larger than the genotype-by-location interaction variance which is in accordance with previous studies in European elite wheat germplasm (Reif et al., 2011b; Langer et al., 2014). All three test locations were located in the south of Germany but we observed strong differences between them with regard to flowering time of the wheat varieties (Figure 1). As vernalization requirement was fulfilled (Figure S1B) and photoperiod was similar for all three locations, temperature remained as a likely cause for the observed differences between the locations which was confirmed by the calculation of thermal time to heading. Taking the temperature at the locations into account eliminated the differences between them observed for heading date. This illustrates the strong effect of temperature on flowering of wheat. However, the low genotype-by-location interaction variance as compared to the genotypic variance indicates that all genotypes responded similarly to the different temperature regimes. Consequently, there appear to be no major QTL for flowering time in response to temperature segregating in European winter bread wheat that affected the trait under the growth conditions represented by our three locations. Nevertheless, a different set of test locations with more diverse temperature profiles may reveal such QTL and the observed genotype-by-location interaction variance may well be caused by medium or small effect temperature response QTL.
The large range in heading date of 28 days (Table 1) can be explained by the different European origins of the varieties included in this study as varieties from southern European countries tended to flower earlier than the more northerly originating ones (Figure S3). Especially in view of the expected climate change, plant breeders need germplasm which allows a flexible response to different climatic conditions. Responding to early summer drought and heat stress, early flowering genotypes can be advantageous provided late frost can be avoided. As earliness is often associated with reduced height and potentially reduced resource capture (Addisu et al., 2009; Bentley et al., 2013) this could be a trade-off regarding yield exploitation. The challenge for future wheat breeding is therefore, to modify flowering time to suit local climatic conditions while maintaining or even increasing yield potential. In order to efficiently exploit the variation and to transfer genotypes between regions, e.g., from southern France to Germany or vice versa, selection tools like marker-assisted selection may be advantageous for future wheat breeding. We, therefore, investigated the genetic control underlying variation of flowering time in the panel of European winter bread wheat varieties by a candidate gene approach and by genome-wide association mapping.
Candidate genes in european winter bread wheat cultivars and their effect on thermal time to heading
A number of genes involved in the different pathways affecting flowering time were identified so far in wheat and their effects were studied by candidate gene approaches (Eagles et al., 2009, 2010; Rousset et al., 2011; Bentley et al., 2013). In this study we assessed the frequency of some of the known flowering time genes and their contribution to the genetic architecture of thermal time to heading in the panel of European winter bread wheat varieties.
The common spring allele Vrn-A1a (Yan et al., 2004) was not detected and the whole panel did not segregate for either of the tested vernalization loci (vrn-B1, vrn-B3 and vrn-D1). This strict winter habit and thus a consequent vernalization requirement is not surprising, as only winter wheat varieties were included in this study. Genes inducing reduced plant height, predominantly the gibberellic acid insensitive alleles of Rht-B1 and Rht-D1, were important components of the “green revolution” (Hedden, 2003). Plant height and its possible effect on flowering time is often discussed as reported associations between flowering time related traits and plant height vary strongly. Langer et al. (2014) observed no correlation in European elite germplasm and neither did Cane et al. (2013) for Australian wheat while other studies did find significant correlations between the two traits (Bordes et al., 2008; Longin et al., 2013; Wilhelm et al., 2013). Furthermore, Wilhelm et al. (2013) reported a significant effect of Rht-B1 on days to heading. In our study we also observed a significant correlation between plant height and heading time as the short genotypes tended to flower earlier than the tall ones. This effect was mainly due to the Rht-B1b allele (Figure 3) and likewise Rht8 was found to explain a small proportion of the genotypic variance of thermal time to heading (Table 2). This suggested a significant effect of Rht-B1 on heading date in wheat. However, a more detailed analysis revealed that the differences in thermal time to heading between plants carrying either of the two Rht-B1 alleles was due to different frequencies of the photoperiod insensitive Ppd-D1a allele in these two groups. Within either of the two Ppd-D1 alleles, Rht-B1 had no effect on thermal time to heading. Consistently, both Rht-B1 and Rht-D1 did not contribute to the genotypic variance when the effect of Ppd-D1 was taken into account (Table 2). This indicates that the observed correlations between flowering time and plant height are due to different frequencies of Ppd-D1a in genotypes with different Rht alleles but not to a direct effect of the Rht loci on flowering time.
Photoperiodism in wheat is mainly controlled by the Ppd-D1 locus located on chromosome 2D which greatly influences flowering time by the separation of genotypes into photoperiod sensitive and insensitive ones and accelerates flowering by several days in European environments (Worland, 1996; Beales et al., 2007; Kamran et al., 2014). The major photoperiod insensitive Ppd-D1a allele has a 2089bp deletion upstream the coding region which increases expression of the gene and is associated with upregulation of the floral activator TaFT1 (Beales et al., 2007; Shaw et al., 2012; Bentley et al., 2013). The photoperiod insensitive Ppd-D1a allele was introduced into European material in the early Twentieth century when Italian breeders used Japanese germplasm as source (Worland, 1996). Nishida et al. (2013) recently identified alleles of the Ppd-A1 and Ppd-B1 loci which accelerate heading in Japanese germplasm and Bentley et al. (2013) showed that photoperiod insensitive alleles at Ppd-A1 or Ppd-B1 can have effects as strong as that of Ppd-D1 when introgressed into hexaploid wheat. However, unlike Ppd-D1a neither of these alleles appears to be present in the current European winter wheat material. By contrast, Ppd-D1a is present in European winter wheat varieties and genotypes carrying this allele showed a strongly decreased thermal time to heading (Figure 2A). Consistently, this locus also explained the by far largest proportion of genotypic variance (Table 2). This illustrates that not only in biparental populations but also in our panel of European winter wheat varieties Ppd-D1 is the major determinant of flowering time under fully vernalized conditions. The Ppd-D1a allele is mainly present in Eastern and Southern European and Eurasian varieties (Figure 5), as up to the beginning of the twenty-first century photoperiod insensitivity has been introduced into most wheat cultivars grown below 48° latitude (Rajaram and van Ginkel, 2001). The main reason for this is that photoperiod insensitivity is beneficial for crops grown in regions with high summer temperatures in order to avoid heat or drought stress during premature developmental stages (Bentley et al., 2011). In addition, earlier flowering increases yield especially in Southern Europe. The prevalence within Eastern European and Russian varieties may be due to the incorporation of Italian material as reduced photoperiodic sensitivity is advantageous for winter wheat plants adapted to dry land environments, prevailing in the continental climate regions of Russia and the former Soviet Union (Worland et al., 1994; Litvinenko et al., 2001). By contrast, the low proportion of Ppd-D1a alleles in varieties originating from northern parts of Europe is due to the considerably lower yield potential of photoperiod insensitive as compared to sensitive varieties in these regions, owing to the shortened vegetative phase.
One of the prime examples for copy number variation in plants is flowering time in wheat which has recently been shown to be affected by CNVs (Díaz et al., 2012). Díaz et al. (2012) showed that Ppd1 on the B genome (Ppd-B1) can be present in different copy numbers. Wheat genotypes with only one copy are photoperiod sensitive whereas an increased copy number (2–4 copies) results in a day-neutral, early flowering phenotype. These experiments were conducted on a rather limited number of lines and with phenotypic data from controlled greenhouse conditions. Cane et al. (2013) found all four alleles to be present in southern Australian wheat and reported that the three-copy allele (termed Ppd-B1a) and the four-copy allele (Ppd-B1c) reduced days to heading as compared to the one-copy allele (Ppd-B1b) whereas the two-copy allele (Ppd-B1d) increased days to heading. In our collection of European winter wheats, the majority of the cultivars carried the one-copy allele and only few the two- or three copy alleles. The allele with four copies which is characteristic for Chinese spring was not present in our collection, in contrast to Cane et al. (2013) who found this allele in a number of modern Australian cultivars and current breeding lines. In contrast to the findings of Cane et al. (2013), our results indicate that both the two- and the three-copy alleles reduce the time to heading in our panel and under the growth conditions present at our test locations (Figure 2B). The proportion of genotypic variance explained by Ppd-B1 copy number variation under field conditions was small compared with Ppd-D1, however still larger than that of any of the detected QTL (Table 2).
Taken together, our candidate gene analyses revealed that the Reduced height loci appear to have no effect on flowering time in European winter bread wheat varieties and confirmed Photoperiod-D1 as the major source of variation of flowering time. In addition to the major effect of Ppd-D1, copy number variation at the Ppd-B1 locus may add in the fine-tuning of adaptation of European winter wheat to local climatic conditions.
QTL and epistatic QTL for thermal time to heading
Even though Ppd-D1 explained 58% of the genotypic variance, there is still variation for flowering time in European winter bread wheat not explained by this major regulator. In order to identify additional components of the genetic architecture underlying the trait we performed a genome-wide association mapping in our panel of varieties. This identified six small effect QTL (Figure 3, Table 2) indicating that beside Ppd-D1 there are no other major QTL affecting flowering time in European winter bread wheat. Rather, the fine tuning to local climatic conditions appears to be controlled by many small effect QTL. With regard to a knowledge-based breeding, such small effect QTL that escape detection in QTL mapping approaches could probably be better captured by genome-wide prediction approaches which may be an option for the future and warrants further research. While it is not possible to unambiguously assign the detected QTL to one of the flowering pathways, the QTL on chromosome 1D (CloneID 1218093) might be part of the Eps signaling pathway as Zikhali et al. (2014) recently reported an Eps QTL on this chromosome.
The geographic pattern of distribution of alleles of the six QTL resembled the distribution of the two Ppd-D1 alleles. The allele conferring earlier flowering was more prominent in the varieties originating from southern regions than in the northern regions suggesting that these QTL contribute to the adaptation of winter wheat varieties to different European climatic conditions. The total proportion of genotypic variance explained by Ppd-D1 and the detected QTL was 72.2% suggesting that there are other QTL with effects too small to be detected or with medium or large effects which remained undetected. Surprisingly, we did not identify a QTL on chromosome 2D in our genome-wide scan, despite Ppd-D1 being located on this chromosome. We did, however, identify an unmapped marker (CloneID 3940868) that of all tested markers was most strongly associated with the trait and which is located in the promotor region of Ppd-D1. The linkage disequilibrium (LD) between this marker and any of the mapped markers on chromosome 2D was low suggesting a rapid decay of LD around this locus in this germplasm. Bentley et al. (2013) have recently attempted to develop markers flanking Ppd but found none of them to be polymorphic on their lines suggesting that the region around Ppd may be largely monomorphic. Our result illustrates that despite the comparably high number of markers obtained by the genotyping-by-sequencing approach there are still chromosomal regions that are not covered with this marker density and consequently regions where QTL may have remained undetected.
Another potential source for the variance not accounted for by Ppd-D1 and the detected QTL is epistasis. Epistasis refers to interactions between two or more loci in the genome (Carlborg and Haley, 2004) and has recently been shown to contribute to the genetic architecture of complex traits in different crops including maize, wheat and rapeseed (Buckler et al., 2009; Reif et al., 2011b; Liu et al., 2012a; Steinhoff et al., 2012; Würschum et al., 2013a). Reif et al. (2011b) showed the contribution of epistasis to the genetic architecture of flowering time in elite winter wheat and in addition, Bentley et al. (2013) have recently shown a dependency of the effect of Ppd-D1a alleles on the genetic background. Consistent with these previous findings, we also identified epistatic QTL for thermal time to heading. While the proportion of genotypic variance explained by individual epistatic QTL was small, combined they could contribute a substantial proportion to the observed variation for flowering time. In conclusion, the genome-wide scan identified only six QTL suggesting that in addition to the major regulator Ppd-D1 the genetic architecture of flowering time in European winter bread wheat is controlled by many QTL with only small effects and potentially by epistasis.
Conclusions
In this study we employed a large panel of European winter bread wheat varieties to unravel the genetic architecture underlying flowering time in this germplasm set. Using a candidate gene approach and genome-wide association mapping, we show that in fully vernalized winter wheat more than half of the genotypic variation is attributable to the major photoperiod regulator Ppd-D1. The remaining variation appears to be due to copy number variation at the Ppd-B1 locus, other small effect QTL and epistatic QTL. With regard to a knowledge-based breeding of wheat these results suggest that only Ppd-D1 is worth to be included in marker-assisted selection programs whereas the subsequent fine tuning to local conditions is better done based on phenotypic selection in the field.
Conflict of interest statement
The authors declare that the research was conducted in the absence of any commercial or financial relationships that could be construed as a potential conflict of interest.
Acknowledgments
This research was funded by the Deutsche Forschungsgemeinschaft under grant number WU 658/1-1.
Supplementary material
The Supplementary Material for this article can be found online at: http://www.frontiersin.org/journal/10.3389/fpls.2014.00537/abstract
References
- Addisu M., Snape J. W., Simmonds J. R., Gooding M. J. (2009). Reduced height (Rht) and photoperiod insensitivity (Ppd) allele associations with establishment and early growth of wheat in contrasting production systems. Euphytica 166, 249–267 10.1007/s10681-008-9838-7 [DOI] [Google Scholar]
- Allard V., Veisz O., Kõszegi B., Rousset M., Le Gouis J., Martre P. (2012). The quantitative response of wheat vernalization to environmental variables indicates that vernalization is not a response to cold temperature. J. Exp. Bot. 63, 847–857 10.1093/jxb/err316 [DOI] [PubMed] [Google Scholar]
- Beales J., Turner A., Griffiths S., Snape J. W., Laurie D. A. (2007). A Pseudo-Response Regulator is misexpressed in the photoperiod insensitive Ppd-D1a mutant of wheat (Triticum aestivum L.). Theor. Appl. Genet. 115, 721–733 10.1007/s00122-007-0603-4 [DOI] [PubMed] [Google Scholar]
- Beniston M., Stephenson D. B., Christensen O. B., Ferro C. A. T., Frei C., Goyette S., et al. (2007). Future extreme events in European climate: an exploration of regional climate model projections. Clim. Change 81, 71–95 10.1007/s10584-006-9226-z [DOI] [Google Scholar]
- Benjamini Y., Hochberg Y. (1995). Controlling the false discovery rate: a practical and powerful approach to multiple testing. J. R. Stat. Soc. B (Methodol.) 57, 289–300 [Google Scholar]
- Bennett D., Izanloo A., Edwards J., Kuchel H., Chalmers K., Tester M., et al. (2012). Identification of novel quantitative trait loci for days to ear emergence and flag leaf glaucousness in a bread wheat (Triticum aestivum L.) population adapted to southern Australian conditions. Theor. Appl. Genet. 124, 697–711 10.1007/s00122-011-1740-3 [DOI] [PubMed] [Google Scholar]
- Bentley A. R., Horsnell R., Werner C. P., Turner A. S., Rose G. A., Bedard C., et al. (2013). Short, natural, and extended photoperiod response in BC2F 4 lines of bread wheat with different Photoperiod-1 (Ppd-1) alleles. J. Exp. Bot. 64, 1783–1793 10.1093/jxb/ert038 [DOI] [PubMed] [Google Scholar]
- Bentley A. R., Turner A. S., Gosman N., Leigh F. J., Maccaferri M., Dreisigacker S., et al. (2011). Frequency of photoperiod-insensitive Ppd-A1a alleles in tetraploid, hexaploid and synthetic hexaploid wheat germplasm. Plant Breed. 130, 10–15 10.1007/s10681-008-9838-718839130 [DOI] [Google Scholar]
- Bernardo R. (1993). Estimation of coefficient of coancestry using molecular markers in maize. Theor. Appl. Genet. 85, 1055–1062 10.1007/BF00215047 [DOI] [PubMed] [Google Scholar]
- Bordes J., Branlard G., Oury F. X., Charmet G., Balfourier F. (2008). Agronomic characteristics, grain quality and flour rheology of 372 bread wheats in a worldwide core collection. J. Cereal Sci. 48, 569–579 10.1016/j.jcs.2008.05.005 [DOI] [Google Scholar]
- Buckler E. S., Holland J. B., Bradbury P. J., Acharya C. B., Brown P. J., Browne C., et al. (2009). The genetic architecture of maize flowering time. Science 325, 714–718 10.1126/science.1174276 [DOI] [PubMed] [Google Scholar]
- Cane K., Eagles H. A., Laurie D. A., Trevaskis B., Vallance N., Eastwood R. F., et al. (2013). Ppd-B1 and Ppd-D1 and their effects in southern Australian wheat. Crop Pasture Sci. 64, 100–114 10.1071/CP13086 [DOI] [Google Scholar]
- Carlborg Ö., Haley C. S. (2004). Epistasis: too often neglected in complex trait studies? Nat. Rev. Genet. 5, 618–625 10.1038/nrg1407 [DOI] [PubMed] [Google Scholar]
- Chu C. G., Tan C. T., Yu G. T., Zhong S., Xu S. S., Yan L. (2011). A novel retrotransposon inserted in the dominant Vrn-B1 allele confers spring growth habit in tetraploid wheat (Triticum turgidum L.). G3 1, 637–645 10.1534/g3.111.001131 [DOI] [PMC free article] [PubMed] [Google Scholar]
- Díaz A., Zikhali M., Turner A. S., Isaac P., Laurie D. A. (2012). Copy number variation affecting the Photoperiod-B1 and Vernalization-A1 genes is associated with altered flowering time in wheat (Triticum aestivum). PLoS ONE 7:e33234 10.1371/journal.pone.0033234 [DOI] [PMC free article] [PubMed] [Google Scholar]
- Distelfeld A., Li C., Dubcovsky J. (2009). Regulation of flowering in temperate cereals. Curr. Opin. Plant Biol. 12, 178 10.1016/j.pbi.2008.12.010 [DOI] [PubMed] [Google Scholar]
- Eagles H. A., Cane K., Kuchel H., Hollamby G. J., Vallance N., Eastwood R. F., et al. (2010). Photoperiod and vernalization gene effects in southern Australian wheat. Crop Pasture Sci. 61, 721–730 10.1071/CP10121 [DOI] [Google Scholar]
- Eagles H. A., Cane K., Vallance N. (2009). The flow of alleles of important photoperiod and vernalisation genes through Australian wheat. Crop Pasture Sci. 60, 646–657 10.1071/CP09014 [DOI] [Google Scholar]
- Ellis M., Spielmeyer W., Gale K., Rebetzke G., Richards R. (2002). “Perfect” markers for the Rht-B1b and Rht-D1b dwarfing genes in wheat. Theor. Appl. Genet. 105, 1038–1042 10.1007/s00122-002-1048-4 [DOI] [PubMed] [Google Scholar]
- FAO. (2013). Statistical Yearbook 2013: World Food and Agriculture. Rome: FAO (Food and Agriculture Organziation of the United Nations) [Google Scholar]
- Fu D., Szűcs P., Yan L., Helguera M., Skinner J. S., Von Zitzewitz J., et al. (2005). Large deletions within the first intron in VRN-1 are associated with spring growth habit in barley and wheat. Mol. Genet. Genomics 273, 54–65 10.1007/s00438-004-1095-4 [DOI] [PubMed] [Google Scholar]
- Gilmour A. R., Gogel B., Cullis B., Thompson R. (2009). ASReml User Guide Release 3.0. Hemel Hempstead: VSN International Ltd [Google Scholar]
- Gower J. C. (1966). Some distance properties of latent root and vector methods used in multivariate analysis. Biometrika 53, 325–338 10.1093/biomet/53.3-4.325 [DOI] [Google Scholar]
- Griffiths S., Simmonds J., Leverington M., Wang Y., Fish L., Sayers L., et al. (2009). Meta-QTL analysis of the genetic control of ear emergence in elite European winter wheat germplasm. Theor. Appl. Genet. 119, 383–395 10.1007/s00122-009-1046-x [DOI] [PubMed] [Google Scholar]
- Hanocq E., Niarquin M., Heumez E., Rousset M., Le Gouis J. (2004). Detection and mapping of QTL for earliness components in a bread wheat recombinant inbred lines population. Theor. Appl. Genet. 110, 106–115 10.1007/s00122-004-1799-1 [DOI] [PubMed] [Google Scholar]
- Hedden P. (2003). The genes of the green revolution. Trends Genet. 19, 5–9 10.1016/S0168-9525(02)00009-4 [DOI] [PubMed] [Google Scholar]
- Holland J., Portyanko V., Hoffman D., Lee M. (2002). Genomic regions controlling vernalization and photoperiod responses in oat. Theor. Appl. Genet. 105, 113–126 10.1007/s00122-001-0845-5 [DOI] [PubMed] [Google Scholar]
- Iafrate A. J., Feuk L., Rivera M. N., Listewnik M. L., Donahoe P. K., Qi Y., et al. (2004). Detection of large scale variation in the human genome. Nat. Genet. 36, 949–951 10.1038/ng1416 [DOI] [PubMed] [Google Scholar]
- Kamran A., Iqbal M., Spaner D. (2014). Flowering time in wheat (Triticum aestivum L.): a key factor for global adaptability. Euphytica 197, 1–26 10.1007/s10681-014-1075-7 [DOI] [Google Scholar]
- Korzun V., Röder M. S., Ganal M. W., Worland A. J., Law C. N. (1998). Genetic analysis of the dwarfing gene (Rht8) in wheat. Part I. Molecular mapping of Rht8 on the short arm of chromosome 2D of bread wheat (Triticum aestivum L.). Theor. Appl. Genet. 96, 1104–1109 10.1007/s001220050845 [DOI] [Google Scholar]
- Kraakman A. T., Niks R. E., Van den Berg P. M., Stam P., Van Eeuwijk F. A. (2004). Linkage disequilibrium mapping of yield and yield stability in modern spring barley cultivars. Genetics 168, 435–446 10.1534/genetics.104.026831 [DOI] [PMC free article] [PubMed] [Google Scholar]
- Krzywinski M., Schein J., Birol I., Connors J., Gascoyne R., Horsman D., et al. (2009). Circos: an information aesthetic for comparative genomics. Genome Res. 19, 1639–1645 10.1101/gr.092759.109 [DOI] [PMC free article] [PubMed] [Google Scholar]
- Langer S. M., Longin C. F. H., Würschum T. (2014). Phenotypic evaluation of floral and flowering traits with relevance for hybrid breeding in wheat (Triticum aestivum L.). Plant Breed. 133, 433–441 10.1111/pbr.12192 [DOI] [Google Scholar]
- Le Gouis J., Bordes J., Ravel C., Heumez E., Faure S., Praud S., et al. (2012). Genome-wide association analysis to identify chromosomal regions determining components of earliness in wheat. Theor. Appl. Genet. 124, 597–611 10.1007/s00122-011-1732-3 [DOI] [PubMed] [Google Scholar]
- Litvinenko M., Lyfenko S., Poperelya F., Babajants L., Palamatchuk A. (2001). Ukrainian wheat pool, in The World Wheat Book – a History of Wheat Breeding, Vol. 1, eds Bonjean A. P., Angus W. J. (Paris: Lavoisier publishing; ), 351–375 [Google Scholar]
- Liu W., Reif J. C., Ranc N., Porta G. D., Würschum T. (2012a). Comparison of biometrical approaches for QTL detection in multiple segregating families. Theor. Appl. Genet. 125, 987–998 10.1007/s00122-012-1889-4 [DOI] [PubMed] [Google Scholar]
- Liu Y., He Z., Appels R., Xia X. (2012b). Functional markers in wheat: current status and future prospects. Theor. Appl. Genet. 125, 1–10 10.1007/s00122-012-1829-3 [DOI] [PubMed] [Google Scholar]
- Longin C. F. H., Gowda M., Mühleisen J., Ebmeyer E., Kazman E., Schachschneider R., et al. (2013). Hybrid wheat: quantitative genetic parameters and consequences for the design of breeding programs. Theor. Appl. Genet. 126, 2791–2801 10.1007/s00122-013-2172-z [DOI] [PubMed] [Google Scholar]
- Longin C. F. H., Mühleisen J., Maurer H. P., Zhang H., Gowda M., Reif J. C. (2012). Hybrid breeding in autogamous cereals. Theor. Appl. Genet. 125, 1087–1096 10.1007/s00122-012-1967-7 [DOI] [PubMed] [Google Scholar]
- Maurer H. P., Melchinger A. E., Frisch M. (2008). Population genetic simulation and data analysis with Plabsoft. Euphytica 161, 133–139 10.1007/s10681-007-9493-4 [DOI] [Google Scholar]
- Melchinger A. E., Friedrich Utz H., Schön C. C. (1998). Quantitative trait locus (QTL) mapping using different testers and independent population samples in maize reveals low power of QTL detection and large bias in estimates of QTL effects. Genetics 149, 383–403 [DOI] [PMC free article] [PubMed] [Google Scholar]
- Mühleisen J., Piepho H.-P., Maurer H. P., Longin C. F. H., Reif J. C. (2013). Yield stability of hybrids versus lines in wheat, barley, and triticale. Theor. Appl. Genet. 127, 309–316 10.1007/s00122-013-2219-1 [DOI] [PubMed] [Google Scholar]
- Nishida H., Yoshida T., Kawakami K., Fujita M., Long B., Akashi Y., et al. (2013). Structural variation in the 5″ upstream region of photoperiod-insensitive alleles Ppd-A1a and Ppd-B1a identified in hexaploid wheat (Triticum aestivum L.), and their effect on heading time. Mol. Breed. 31, 27–37 10.1007/s11032-012-9765-0 [DOI] [Google Scholar]
- Pickett A. A. (1993). Hybrid Wheat-results and Problems. Fortschritte der Pflanzenzuechtung. Berlin; Hamburg: Paul Parey Scientific Publishers [Google Scholar]
- Rajaram S., van Ginkel M. (2001). Mexico: 50 years of international wheat breeding, in The World Wheat Book – a History of Wheat Breeding, Vol. 1, eds Bonjean A. P., Angus W. J. (Paris: Lavoisier publishing; ), 579–608 [Google Scholar]
- Reif J. C., Gowda M., Maurer H. P., Longin C., Korzun V., Ebmeyer E., et al. (2011a). Association mapping for quality traits in soft winter wheat. Theor. Appl. Genet. 122, 961–970 10.1007/s00122-010-1502-7 [DOI] [PubMed] [Google Scholar]
- Reif J. C., Maurer H. P., Korzun V., Ebmeyer E., Miedaner T., Würschum T. (2011b). Mapping QTLs with main and epistatic effects underlying grain yield and heading time in soft winter wheat. Theor. Appl. Genet. 123, 283–292 10.1007/s00122-011-1583-y [DOI] [PubMed] [Google Scholar]
- Rousset M., Bonnin I., Remoué C., Falque M., Rhoné B., Veyrieras J.-B., et al. (2011). Deciphering the genetics of flowering time by an association study on candidate genes in bread wheat (Triticum aestivum L.). Theor. Appl. Genet. 123, 907–926 10.1007/s00122-011-1636-2 [DOI] [PubMed] [Google Scholar]
- Sebat J., Lakshmi B., Troge J., Alexander J., Young J., Lundin P., et al. (2004). Large-scale copy number polymorphism in the human genome. Science 305, 525–528 10.1126/science.1098918 [DOI] [PubMed] [Google Scholar]
- Shaw L. M., Turner A. S., Laurie D. A. (2012). The impact of photoperiod insensitive Ppd-1a mutations on the photoperiod pathway across the three genomes of hexaploid wheat (Triticum aestivum L.). Plant J. 71, 71–84 10.1111/j.1365-313X.2012.04971.x [DOI] [PubMed] [Google Scholar]
- Snape J. W., Butterworth K., Whitechurch E., Worland A. J. (2001). Waiting for fine times: Genetics of flowering time in wheat. Euphytica 119, 185–190 10.1023/A:1017594422176 [DOI] [Google Scholar]
- Steinhoff J., Liu W., Reif J. C., Porta G. D., Ranc N., Würschum T. (2012). Detection of QTL for flowering time in multiple families of elite maize. Theor. Appl. Genet. 125, 1539–1551 10.1007/s00122-012-1933-4 [DOI] [PubMed] [Google Scholar]
- Turner A., Beales J., Faure S., Dunford R. P., Laurie D. A. (2005). Botany: The pseudo-response regulator Ppd-H1 provides adaptation to photoperiod in barley. Science 310, 1031–1034 10.1126/science.1117619 [DOI] [PubMed] [Google Scholar]
- Utz H. F., Melchinger A. E., Schön C. C. (2000). Bias and sampling error of the estimated proportion of genotypic variance explained by quantitative trait loci determined from experimental data in maize using cross validation and validation with independent samples. Genetics 154, 1839–1849 [PMC free article] [PubMed] [Google Scholar]
- Weir A., Bragg P., Porter J., Rayner J. (1984). A winter wheat crop simulation model without water or nutrient limitations. J. Agric. Sci. 102, 371–382 10.1017/S0021859600042702 [DOI] [Google Scholar]
- Whitford R., Fleury D., Reif J. C., Garcia M., Okada T., Korzun V., et al. (2013). Hybrid breeding in wheat: technologies to improve hybrid wheat seed production. J. Exp. Bot. 64, 5411–5428 10.1093/jxb/ert333 [DOI] [PubMed] [Google Scholar]
- Wilhelm E. P., Boulton M. I., Al-Kaff N., Balfourier F., Bordes J., Greenland A. J., et al. (2013). Rht-1 and Ppd-D1 associations with height, GA sensitivity, and days to heading in a worldwide bread wheat collection. Theor. Appl. Genet. 126, 2233–2243 10.1007/s00122-013-2130-9 [DOI] [PubMed] [Google Scholar]
- Williams E., Piepho H.-P., Whitaker D. (2011). Augmented p-rep designs. Biom. J. 53, 19–27 10.1002/bimj.201000102 [DOI] [PubMed] [Google Scholar]
- Worland A. J. (1996). The influence of flowering time genes on environmental adaptability in European wheats. Euphytica 89, 49–57 10.1007/BF00015718 [DOI] [Google Scholar]
- Worland A. J., Appendino M. L., Sayers E. J. (1994). The distribution, in European winter wheats, of genes that influence ecoclimatic adaptability whilst determining photoperiodic insensitivity and plant height. Euphytica 80, 219–228 10.1007/BF00039653 [DOI] [Google Scholar]
- Worland T., Snape J. W. (2001). Genetic basis of worldwide wheat varietal improvement, in The World Wheat Book – a History of Wheat Breeding, Vol. 1, eds Bonjean A. P., Angus W. J. (Paris: Lavoisier publishing; ), 59–100 [Google Scholar]
- Wright S. (1978). Evolution and Genetics of Populations, Variability Within and Among Natural Populations. Vol. 4 Chicago: The University of Chicago Press [Google Scholar]
- Würschum T., Kraft T. (2014). Cross-validation in association mapping and its relevance for the estimation of QTL parameters of complex traits. Heredity 112, 463–468 10.1038/hdy.2013.126 [DOI] [PMC free article] [PubMed] [Google Scholar]
- Würschum T., Langer S. M., Longin C. F. H., Korzun V., Akhunov E., Ebmeyer E., et al. (2013b). Population structure, genetic diversity and linkage disequilibrium in elite winter wheat assessed with SNP and SSR markers. Theor. Appl. Genet. 126, 1477–1486 10.1007/s00122-013-2065-1 [DOI] [PubMed] [Google Scholar]
- Würschum T., Liu W., Maurer H. P., Abel S., Reif J. C. (2012). Dissecting the genetic architecture of agronomic traits in multiple segregating populations in rapeseed (Brassica napus L.). Theor. Appl. Genet. 124, 153–161 10.1007/s00122-011-1694-5 [DOI] [PubMed] [Google Scholar]
- Würschum T., Maurer H. P., Dreyer F., Reif J. C. (2013a). Effect of inter- and intragenic epistasis on the heritability of oil content in rapeseed (Brassica napus L.). Theor. Appl. Genet. 126, 435–441 10.1007/s00122-012-1991-7 [DOI] [PubMed] [Google Scholar]
- Würschum T., Maurer H. P., Schulz B., Möhring J., Reif J. C. (2011). Genome-wide association mapping reveals epistasis and genetic interaction networks in sugar beet. Theor. Appl. Genet 123, 109–118 10.1007/s00122-011-1570-3 [DOI] [PubMed] [Google Scholar]
- Yan L., Fu D., Li C., Blechl A., Tranquilli G., Bonafede M., et al. (2006). The wheat and barley vernalization gene VRN3 is an orthologue of FT. Proc. Natl. Acad. Sci. U.S.A. 103, 19581–19586 10.1073/pnas.0607142103 [DOI] [PMC free article] [PubMed] [Google Scholar]
- Yan L., Helguera M., Kato K., Fukuyama S., Sherman J., Dubcovsky J. (2004). Allelic variation at the VRN-1 promoter region in polyploid wheat. Theor. Appl. Genet. 109, 1677–1686 10.1007/s00122-004-1796-4 [DOI] [PubMed] [Google Scholar]
- Yu J., Pressoir G., Briggs W. H., Bi I. V., Yamasaki M., Doebley J. F., et al. (2005). A unified mixed-model method for association mapping that accounts for multiple levels of relatedness. Nat. Genet. 38, 203–208 10.1038/ng1702 [DOI] [PubMed] [Google Scholar]
- Zikhali M., Leverington-Waite M., Fish L., Simmonds J., Orford S., Wingen L. U., et al. (2014). Validation of a 1DL earliness per se (eps) flowering QTL in bread wheat (Triticum aestivum). Mol. Breed. 34, 1023–1033 10.1007/s11032-014-0094-3 [DOI] [PMC free article] [PubMed] [Google Scholar]
- Zmienko A., Samelak A., Kozlowski P., Figlerowicz M. (2014). Copy number polymorphism in plant genomes. Theor. Appl. Genet. 127, 1–18 10.1007/s00122-013-2177-7 [DOI] [PMC free article] [PubMed] [Google Scholar]
Associated Data
This section collects any data citations, data availability statements, or supplementary materials included in this article.