

Abstract
Dengue virus nonstructural protein 3 (NS3) is a multifunctional protein formed by a superfamily-2 RNA helicase linked to a protease domain. In this work, we report results from in vitro experiments designed to determine the oligomeric state of dengue virus NS3 helicase (NS3h) and to characterize fundamental properties of the interaction with single-stranded (ss)RNA. Pulsed field gradient-NMR spectroscopy was used to determine the effective hydrodynamic radius of NS3h, which was constant over a wide range of protein concentrations in the absence and presence of ssRNA. Size exclusion chromatography-static light scattering experiments showed that NS3h eluted as a monomeric molecule even in the presence of ssRNA. Binding of NS3h to ssRNA was studied by quantitative fluorescence titrations using fluorescein-labeled and unlabeled ssRNA oligonucleotides of different lengths, and the effect of the fluorescein label on the interaction parameters was also analyzed. Experimental results were well described by a statistical thermodynamic model based on the theory of non-specific interactions of large ligands to a one-dimensional lattice. We found that binding of NS3h to ssRNA oligonucleotides and to poly(A) is characterized by minimum and occluded binding site sizes both of 10 nucleotides and by a weak positive cooperativity between adjacent proteins.
INTRODUCTION
The dengue virus (DENV) is a member of the family Flaviviridae which includes other major public health concerns such as yellow fever virus, West Nile virus and hepatitis C virus (HCV) (1). Dengue virus exists in four distinct serotypes; all of them are mosquito-borne and cause dengue fever and dengue hemorrhagic fever/dengue shock syndrome. Found in tropical and subtropical regions of the world, DENV causes an estimated 390 million infections annually (2) and places over 3 billion people at risk of infection (3,4). The genome of flaviviruses is encoded in a positive-sense single-stranded RNA (ssRNA) molecule of about 11 000 nucleotides and is composed of a single open reading frame flanked by conserved and highly structured 5′ and 3′ untranslated regions (5,6). The entire viral genome is translated into a single polyprotein which is subsequently cleaved by viral and cellular proteases into functional entities. At least 10 viral proteins are produced: three structural proteins (capsid, premembrane and envelope proteins) and seven non-structural proteins (NS1, NS2A, NS2B, NS3, NS4A, NS4B and NS5) (5,7,8).
Dengue virus non-structural protein 3 (NS3) is a multifunctional protein of 618 amino acids built of two functional domains: an N-terminal region (residues 1–167) that forms, together with residues of protein NS2B, an active serine protease and a C-terminal region (residues 171–618) endowed with RNA helicase, nucleoside 5′-triphosphatase (NTPase), RNA 5′-triphosphatase, as well as RNA annealing activities (9–12). These two functional domains may act independently of each other in vitro and recombinant NS3 lacking the protease domain (NS3h) retains NTPase and helicase activities (10,12).
The crystal structure of DENV NS3h has been determined at 2.4-Å resolution (13). Its tertiary structure is characterized by three domains, each of about 130–150 amino acids. The first two domains (domains I and II) are RecA-like domains, which constitute the core of most adenosine triphosphate (ATP)-driven molecular motors (14,15), and host characteristic sequence motifs of superfamily 2 helicases (16,17). The cleft formed between domain III and the other two presents numerous basic residues and is wide enough to accommodate a single-stranded nucleic acid substrate but not a duplex (18).
RNA helicases are a ubiquitous class of enzymes that participate in virtually all processes of the RNA metabolism (14). A common feature shared by these motor proteins is their capability to catalyze the hydrolysis of nucleoside triphosphates, which provides the driving force for translocation along nucleic acids and unwinding of double-stranded nucleic acids.
It is known that several helicases form oligomers (generally dimeric or hexameric), that the oligomerization process is in some cases induced by interactions with nucleic acids or other ligands and that the activities of these helicases are dependent on their oligomeric state (19,20). Nevertheless, the oligomeric state of DENV NS3 has not yet been addressed.
Proteins with in vitro RNA-helicase activity are encoded by many viruses, but their specific roles in viral replication are still unclear. In vivo functions of the NS3 helicase are presumably related to its ability to interact with RNA. Despite its key importance for understanding the RNA recognition process by the DENV NS3 helicase, only a few aspects of this interaction have been studied (21). Fundamental properties of the NS3–RNA interaction, such as stoichiometry, binding site size, intrinsic affinity, cooperativity and base specificity, have not been determined. This information is necessary to understand functional aspects of this enzyme and it is a prerequisite for formulating any model of the mechanism of enzyme functioning, including translocation on the RNA and catalysis of RNA unwinding.
In this paper, we report in vitro studies on the oligomeric state of the helicase domain of DENV NS3 (NS3h) using pulsed field gradient (PFG)-nuclear magnetic resonance (NMR) spectroscopy, together with static light scattering (SLS) techniques, and on the interaction of the enzyme with ssRNA using quantitative fluorescence titration experiments. We present evidence that DENV NS3h is a monomer molecule in solution, both free and bound to ssRNA, to an ATP analog or to both ligands, that NS3h binds to ssRNA with similar values of minimum and occluded binding site sizes (between 10 and 11 nucleotide residues) and that binding of multiple NS3h molecules to the same ssRNA molecule occurs with positive cooperativity.
MATERIALS AND METHODS
General reagents
KCl, KOH, HCl and MgCl2 were from Mallinckrodt Baker (ACS reagents). 2-[4-(2-hydroxyethyl)piperazin-1-yl]ethanesulfonic acid (HEPES), ethylenediaminetetraacetic acid (EDTA) tetraacid form, 3-[(3-Cholamidopropyl)dimethylammonio]-1-propanesulfonate (CHAPS), adenosine 5′-triphosphate (ATP) and adenosine 5′-(β,γ-imido)triphosphate (AMP-PNP) were from Sigma Aldrich. Dithiothreitol (DTT) was from Promega Corporation. All solutions were prepared in distilled and filtered water (MilliQ, Millipore Corporation) with no detectable RNase activity. Concentrations of EDTA and MgCl2 in stock solutions were determined by volumetric titrations employing eriochrome black T indicator and a Zn2+ standard solution (22).
Protein constructs and purification
A construct encoding the helicase domain of NS3 (NS3h) (residues 171–618) was derived from the cDNA of an infected clone of DENV serotype 2 (GenBank accession number U87411) (23). The construct was cloned into vector pET-28a (Novagen, Madison, USA) to obtain plasmid pET-NS3h that was used for high-level expression of N-terminal hexa-histidine-tagged recombinant protein in Escherichia coli (12). Protein expression and purification procedures were identical as described in a previous report (12). Homogeneity of protein preparations was assessed by sodium dodecyl sulphate-polyacrylamide gel electrophoresis and Coomassie Brillant Blue staining. The concentration of enzyme in stock aliquots was calculated from the absorbance at 280 nm and its empirical extinction coefficient in the dialysis buffer (50-mM HEPES-KOH, pH 7.0, 5% v/v glycerol, 200-mM KCl, 0.20-mM DTT), ϵ280 nm, 25°C = 70.9 mM−1 cm−1 which in turn was obtained by the Edelhoch method (24).
Nucleic acids
RNA and DNA oligonucleotides were acquired from Integrated DNA technologies Inc. (Iowa, USA). The lyophilized products were dissolved in RNase-free water and their concentrations were determined spectrophotometrically using the extinction coefficients at 260 nm provided by the manufacturer. All oligonucleotides were purified by HPLC by the manufacturer and used without further purification. Their sequences are depicted in Table 1 where ‘F’ denotes the fluorescent label containing the fluorescein moiety covalently linked to the 5′- or 3′-terminal OH group through a phosphodiester bond—indicated with ‘p’—or through an ether bond with a glycerol moiety, respectively (see Supplementary Figure S1). Because the oligonucleotides labeled in the 5′ terminus contain an additional phosphate group proceeding from the fluorescent label they are regarded as having one additional nucleotide residue, with fluorescein replacing the base at the 5′ terminus. Thus F-p-R5 is referred to as a 6-mer, and so on (as was done in other works; see for example (25)).
Table 1. Sequences of RNA and DNA (D) oligonucleotides.
| Name | Sequence | Assigned length |
|---|---|---|
| R10 | 5′-AGUUGAGUUG-3′ | 10-mer |
| R12 | 5′-AGUUGAGUUGAG-3′ | 12-mer |
| R15 | 5′-AGUUGAGUUGAGUUG-3′ | 15-mer |
| R18 | 5′-AGUUGAGUUGAGUUGAGU-3′ | 18-mer |
| R20 | 5′-AGUUGAGUUGAGUUGAGUUG-3′ | 20-mer |
| F-p-R5 | F-p-5′-AGUUG-3′ | 6-mer |
| F-p-R10 | F-p-5′-AGUUGAGUUG-3′ | 11-mer |
| F-p-R12 | F-p-5′-AGUUGAGUUGAG-3′ | 13-mer |
| F-p-R15 | F-p-5′-AGUUGAGUUGAGUUG-3′ | 16-mer |
| F-p-R18 | F-p-5′-AGUUGAGUUGAGUUGAGU-3′ | 19-mer |
| F-p-R20 | F-p-5′-AGUUGAGUUGAGUUGAGUUG-3′ | 21-mer |
| R10-F | 5′-AGUUGAGUUC-3′-F | 10-mer |
| F-p-S10 | F-p-5′-AUUCUGUUCU-3′ | 11-mer |
| F-p-S15 | F-p-5′-AUUCUGUUCUGUUCU-3′ | 16-mer |
| F-p-S20 | F-p-5′-AUUCUGUUCUGUUCUGUUCU-3′ | 21-mer |
| F-p-T18 | F-p-5′-AGUUGUUAGUCUACGUGG-3′ | 19-mer |
| F-p-V12 | F-p-5′-AGCACUCCAACU-3′ | 13-mer |
| (A)12 | 5′-AAAAAAAAAAAA-3′ | 12-mer |
| (A)18 | 5′-AAAAAAAAAAAAAAAAAA-3′ | 18-mer |
| (U)12 | 5′-UUUUUUUUUUUU-3′ | 12-mer |
| (U)20 | 5′-UUUUUUUUUUUUUUUUUUUU-3′ | 20-mer |
| F-p-D20 | F-p-5′-AGTTGAGTTGAGTTGAGTTG-3′ | 21-mer |
‘F’ denotes the fluorescent label containing the fluorescein moiety covalently linked to the 5′ or 3′ terminal OH group through a phosphodiester bond—indicated with ‘p’—or through an ether bond with a glycerol moiety, respectively (see Supplementary Figure S1). Because the oligonucleotides labeled in the 5′ terminus contain an additional phosphate group proceeding from the fluorescent label they are regarded as having one additional nucleotide residue.
Polyadenylic acid (poly(A), potassium salt, Catalog number P9403) was from Sigma Aldrich and polycytidylic acid (poly(C), potassium salt, Lot number 4084220021) was from Amersham Biosciences. The concentration of stock solutions of poly(A) and poly(C), in mononucleotide units, was determined spectrophotometrically (26).
Hydrodynamic radius determinations by PFG-NMR
PFG-NMR self-diffusion measurements were performed at 27°C on a Bruker 600-MHz Avance III spectrometer equipped with a 5-mm triple resonance cryoprobe incorporating shielded z-axis gradient coils. PFGs were appropriately employed to achieve suppression of the solvent signal and spectral artifacts. The proton carrier was centered on the H2O frequency. The spectra were processed and analyzed using Bruker Topspin 2.0 software.
NMR samples were typically 20–250 μM of protein in a buffer containing 10-mM Tris-HCl pH 7.0, 100-mM KCl, 1.0-mM DTT, 2.0-mM MgCl2 and 10% D2O. When present, the concentration of unlabeled 10-mer RNA oligonucleotide (R10) was 1–1.5 times NS3h concentration, whereas the concentration of AMP-PNP was 2.5 mM. Such concentrations were chosen on the basis of the following facts: (i) in this reaction media, binding of RNA to NS3h is nearly stoichiometric at the NS3h concentrations employed in these experiments (see the Results section) and (ii) KM value for the substrate curves of ATPase activity obtained in these conditions is 0.078 mM in the absence of RNA and 0.21 mM in the presence of 0.88-mM poly(A) (Supplementary Figure S2).
The PFG-NMR experiments were performed using the PFG-SLED sequence (27). Dioxane (12 μl, 6% in H2O) was added to all samples (300 μl) as internal standard (28) with 1D 1H spectra acquired before and after to ensure that the dioxane did not change the protein resonances. The length of all pulses and delays in the sequence were held constant and 19 spectra were acquired with the strength of the diffusion gradient varying between 5% and 95% of its maximum value for dioxane and NS3h. The length of the diffusion delay was calibrated for the sample in order to give a maximal decay of 85–90% for the protein and dioxane signals. A T2 filter was used to selectively observe the dioxane signal, without interference of the protein, and therefore to reduce the experimental error, especially at high gradient strengths. The dioxane NMR spectra were acquired with 16 K complex points, and the protein NMR spectra with 4 K complex points. Resonance intensity proceeding from the protein was monitored in the aromatic/amide region of the spectrum.
Resonance peak intensity (I/I0) is related to the gradient strength according to the Stejskal–Tanner equation (29):
 |
(1) |
where Δ is the diffusion delay (which was set to 200–252 ms for NS3h and 15 ms for dioxane), δ is the duration of gradient (4 ms), g is the fraction of the maximum gradient strength used in each experiment (from 0.05 to 0.95) and d is a constant directly proportional to the translational diffusion coefficient D, d = D (γH δ Gmax 2/π)2, where γH is the gyromagnetic ratio for hydrogen and Gmax is the maximum gradient strength. According to the Stokes–Einstein equation, the translational diffusion coefficient of a molecule is inversely related to its effective hydrodynamic radius (Rh). This quantity is defined as the radius of a rigid uncharged sphere which exhibits the same hydrodynamic behavior as the solvated molecule in solution (30).
Values of parameter d for protein and dioxane were obtained by fitting Equation (1) to the experimentally determined values of resonance intensity I/I0 as a function of g2. The hydrodynamic radius of the protein was computed according to
 |
(2) |
using a value of 0.212 nm for the Rh of dioxane (31).
Determination of NS3h molecular weight by SLS
The average molecular weight (MW) of NS3h—alone and in the presence of a short ssRNA oligonucleotide—was determined on a Precision Detectors PD2010 light-scattering instrument connected in tandem to an FPLC system and a LKB2142 differential refractometer. Samples (500 μl) were loaded on a Superdex 200 10/300 GL column equilibrated at room temperature (∼25°C) and the flow rate was set to 0.5 ml/min with a running buffer consisting of: 25-mM HEPES-KOH (pH 7.0), 60-mM KCl, 5% v/v glycerol, 0.20-mM DTT, 2.0-mM MgCl2 and 0.10-mM EDTA. The 90° light scattering, refractive index and absorbance of the eluting material were recorded during the measurement process and then analyzed with the Discovery32 software supplied by Precision Detectors. The 90° light scattering detector was calibrated using bovine serum albumin as a standard. When the experiments were performed in the presence of RNA, unlabeled 10-mer R10 oligonucleotide was premixed with NS3h in a molar ratio of 2:1 (RNA:NS3h).
Equilibrium fluorescence titrations of ssRNA with NS3h protein
Fluorescence measurements. Steady-state fluorescence measurements were done in a Jasco FP-6500 spectrofluorometer equipped with a Peltier thermostat. In order to minimize inner filter effects, all measurements were done in a 3-mm-pathlength quartz cell. Emission and excitation slits were set at 3-nm bandwidth.
Binding of NS3h to fluorescein-labeled ssRNA oligonucleotides (see Table 1) was followed by monitoring the fluorescence emitted upon excitation at 495 nm (or at 295 nm; see the Results section and Supplementary data). Separate tubes containing mixtures of NS3h and ssRNA at the indicated concentrations were allowed to equilibrate during 30 min at 30°C (in 1.5-ml reaction tubes from Greiner Bio-One) prior to recording the fluorescence spectra. Relative fluorescence increase was defined as
 |
(3) |
where F denotes the fluorescence intensity observed at the given NS3h concentration and F0 is the fluorescence intensity observed in the absence of protein, and both quantities were measured as the total intensity emitted between 510 and 640 nm (or 510 and 580 nm; see the Results section) minus the intensity recorded in the absence of RNA.
Reaction media
Titration experiments were carried out at 30°C in buffer B (25-mM HEPES/KOH, pH 7.0 (25°C), 100-mM KCl, 2.0-mM MgCl2, 0.10-mM EDTA, 5% v/v glicerol, 0.20-mM CHAPS and 2.0-mM DTT). We found that at low salt content (∼20-mM KCl) NS3h protein aggregates at micromolar concentrations. This problem was overcome by increasing the monovalent salt content up to 100-mM KCl. Likewise, CHAPS detergent was added to the reaction buffer to avoid problems that seems to be related to sticking of protein to the reaction tube walls. This problem was evidenced by a loss of specific ATPase activity as NS3h concentration was decreased (Supplementary Figure S3A), which was prevented by the addition of detergents such as Tween20 (as in (32)) and CHAPS (Supplementary Figure S3A). The loss of specific ATPase activity is not manifested at micromolar NS3h concentrations (Supplementary Figure S3B), and thus CHAPS was not added in the reaction media employed for PFG-NMR and size exclusion chromatography (SEC)-SLS experiments. Additionally, we found that distortions of titration curves obtained in the absence of detergent were overcome by addition of CHAPS or Tween20 (Supplementary Figure S3C).
Model-independent analysis of titration curves
Model-independent analysis of titration curves was performed as previously described (33). The fundamentals of this analysis and its application to the results presented in this work can be explained as follows (for more details see (33)). Fluorescence intensity is regarded to be a linear function of the concentration of fluorophore (fluorescein-labeled oligonucleotides, F-RNA) in each binding state i. That is
 |
(4) |
where coefficients ai denote the molar fluorescence of F-RNA bound to i protein molecules and g denotes the maximum number of protein molecules that may bind to one RNA molecule. In the absence of protein [F-RNA]free = [F-RNA]total, thus we have
 |
(5) |
Mass balance ensures that
 |
(6) |
thus, replacing Equations (4)–(6) in Equation (3) we have
 |
(7) |
where coefficients ΔFi are the relative molar fluorescence increase of F-RNA bound to i protein molecules with respect to free F-RNA. In the absence of protein oligomerization, which is compatible with the results presented in this work (see the Results section), mass balance on the protein implies
 |
(8) |
The average number of NS3h molecules bound per RNA (the ‘binding density’) is defined by
 |
(9) |
and can take values from 0 to g. Quantities νi are ‘partial binding densities’ and give the contribution of each protein–RNA complex to the binding density. Therefore Equation (7) can be expressed as
 |
(7b) |
and Equation (8) as
 |
(8b) |
The importance of analyzing the titration curves in terms of ΔFrel is due to its linear relationship with the partial binding densities (Equation (7b)). For any system in which neither the ligand nor the macromolecule changes its oligomeric state on the range of concentrations tested during titrations, it can be demonstrated that the average binding density ν has to be a monotonic function of the concentration of free ligand and this function defines the binding isotherm of the system under a given set of conditions. In such systems, if ΔFrel is shown to be a monotonic function of the total concentration of ligand at any given total concentration of macromolecule—that is, if the titration curves are monotonous—then ΔFrel would also be a monotonic function of free ligand concentration. In other words, regardless of the total concentration of macromolecule, a given value of ΔFrel would be reached at a unique value of free ligand concentration and thus of ν (33). More importantly, from a set of titration curves obtained at different concentrations of macromolecule (F-RNA) it could be estimated the total concentrations of ligand (NS3h) associated with a given value of ΔFrel. Then, according to Equation (8b), the plot of [NS3h]total as a function of [F-RNA]total would be a straight line with slope and ordinate intercept given by ν and [NS3h]free, respectively (33). We applied this procedure to the results of titration experiments of fluorescein-labeled oligonucleotides in order to verify the consistency of the data as well as to establish from the plot of ΔFrel versus ν the maximum stoichiometries of the F-RNA–NS3h complexes.
Model-independent analysis of competition titration curves
Competition titration experiments were performed and analyzed according to the procedure described by Jezewska et al. (34). Briefly, if the fluorescent (F-RNA) and non-fluorescent (RNA) macromolecules compete for their binding to the ligand (NS3h), mass balance on the ligand should read as
 |
(10) |
Here the binding density of NS3h to labeled and unlabeled RNA, νf and νu, are differentiated by the f and u subscripts, respectively. Regardless of the total concentration of unlabeled macromolecule, a given value of ΔFrel would be reached at a unique value of free ligand concentration and thus of νu (34). Accordingly, from the series of titration curves obtained at different concentrations of unlabeled RNA but at a fixed concentration of the labeled RNA, the value of νu at each value of ΔFrel can be obtained from the slope of the plot of [NS3h]total as a function of [RNA]total. We applied this procedure to the results of competition titration experiments in order to verify the consistency of the data as well as to establish the possible maximum stoichiometries of the RNA–NS3h complexes.
Competition titrations with poly(A)
Mixtures of NS3h and the F-p-R10 oligonucleotide were titrated with poly(A). Fluorescence measurements were performed as before (with the same apparatus and settings and the same reaction media and temperature), excepting that titrations were carried out in a 1-cm-pathlength cell equipped with a ‘tube’ stirrer. Titrant solutions of poly(A) contained the same concentrations of NS3h and F-p-R10 as the solution in the cell, so that no correction for dilution was required. The initial volume in the cell was 1600 μl and aliquots of poly(A) were added in volumes ranging from 20 μl to 300 μl. Fluorescence emission spectra (495 nm → 510 to 640 nm) were recorded ∼2 min after the addition of an aliquot.
Electrophoretic mobility shift assays
Electrophoretic mobility shift assays were used to resolve the complexes formed between fluorescein-labeled oligonucleotides and the NS3h. Oligonucleotides at 0.25 μM were mixed with NS3h at various concentrations in binding buffer B in 20-μl final volumes, and then incubated for 30 min at 30°C. Samples were loaded in 4.5% polyacrylamide gels prepared in buffer THE (Tris base 15 mM; Hepes acid 50 mM; EDTA 0.01 mM; pH 7.0) plus 5% v/v glycerol. Electrophoresis were performed in a cold room at 4–8ºC to avoid overheating of the gels, in buffer THE for 80 min at a constant voltage of 60 V in a Mini-PROTEAN Tetra Cell electrophoresis system (Bio-Rad Laboratories Inc.). The fluorescent signal from fluorescein-labeled probes was detected by scanning the gels with a Storm 865 device (GE Healthcare). Densitometric analysis of electrophoretograms was done with ImageJ (http://rsbweb.nih.gov/ij/).
Data analysis
Model simulations and nonlinear regression analysis of the data were performed using Libreoffice 4.2 spreadsheets (http://www.libreoffice.org/) and Copasi version 4.13 (http://www.copasi.org/).
RESULTS
Oligomeric state of dengue virus NS3 helicase
In order to study the interaction of NS3h with nucleic acids and with ligands of its NTPase catalytic site, it is necessary to analyze previously the oligomeric states of the free protein as well as of the protein complexed with such ligands (35,36). Since it is recommended to perform this task by methods independent of those used for the study of binding of ligands, PFG-NMR and SEC-SLS experiments were carried out to investigate possible self-association of NS3h.
Measurements of hydrodynamic radii by PFG-NMR spectroscopy
Self-diffusion is defined as translational motions reflecting the random movement of a molecule in the absence of a concentration gradient. The diffusion coefficient of this motion, D, is sensitive to changes in molecular size and shape and provides quantitative view of association states of molecules and oligomers. Therefore, a concentration-dependent increase in the hydrodynamic volume of a protein as a result of self-association can be manifested as a decrease in the measured diffusion coefficient. Pulsed-field gradient NMR spectroscopy is a well-established technique for the measurement of diffusion coefficients (37–39). In PFG-NMR diffusion techniques, a magnetic field gradient is first encoded across the NMR tube, the molecules are then allowed to diffuse during a delay and the magnetic field gradient is subsequently decoded. The diffusion coefficient is then determined by measuring the attenuation of the NMR signal (40) and its value expressed as effective hydrodynamic radius (Rh) of the molecule using the Stokes–Einstein equation (see the Materials and Methods section).
We performed PFG-NMR experiments at different concentrations of NS3h in four experimental conditions: (i) NS3h alone, (ii) NS3h plus a 10-mer oligonucleotide (R10), (iii) NS3h plus the nonhydrolyzable ATP analog AMP-PNP and (iv) NS3h plus R10 plus AMP-PNP (see the Materials and Methods section and Figure 1). For each experimental condition tested, plots of the exponential decay of resonance intensity with the square of the gradient amplitude (attenuation plots) were obtained both for NS3h and the internal standard (dioxane) (Supplementary Figure S4). The value of the exponential term d of Equation (1) for each curve was obtained by nonlinear regression analysis and then used to calculate the Rh according to the procedure described in the Materials and Methods section.
Figure 1.
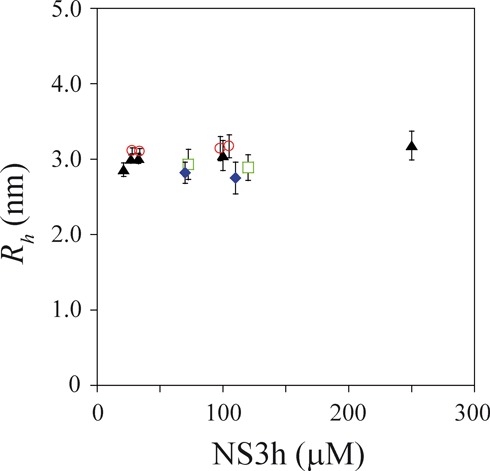
Effective hydrodynamic radius of NS3h. PFG-NMR experiments were performed in four experimental conditions: NS3h alone (triangles), NS3h + R10 (circles), NS3h + AMP-PNP (diamonds) and NS3h + R10 + AMP-PNP (squares). Experiments were performed in media containing 10-mM Tris-HCl (pH 7.0), 100-mM KCl, 1.0-mM DTT, 2.0-mM MgCl2 and 10% D2O at 27°C. Vertical bars represent the 95% confidence intervals of Rh values computed through propagation from the standard errors of the estimated values of ddiox and dNS3h (Equation (2)). Mean Rh values (± standard error) are 3.0 (± 0.1) nm for NS3h alone, 3.1 (± 0.1) nm for NS3h + R10, 2.8 (± 0.3) nm for NS3h + AMP-PNP and 2.9 (± 0.2) nm for NS3h + R10 + AMP-PNP.
In each experimental condition tested, no significant differences were observed between Rh values obtained at different NS3h concentrations (Figure 1). Mean values of Rh (averaged over different values of NS3h concentration) for each condition were not significantly different and displayed the following trends: addition of the oligonucleotide was accompanied by an increase of Rh values, whereas addition of AMP-PNP was accompanied by a decrease of Rh values (Figure 1).
SEC-SLS determinations of the MW of NS3h in the absence and presence of ssRNA
SEC-SLS experiments were performed to determine the MW of free NS3h and of NS3h–ssRNA complexes. To this end, 15-μM NS3h alone or in the presence of 30-μM 10-mer ssRNA was incubated at room temperature in running buffer (25-mM HEPES-KOH (pH 7.0), 60-mM KCl, 5% v/v glycerol, 0.20-mM DTT, 2.0-mM MgCl2 and 0.10-mM EDTA) and injected in a gel filtration column coupled in tandem with an SLS apparatus (see the Materials and Methods section).
Analysis of the elution profiles indicates the presence of only one aggregation state of NS3h with a unique MW (Figure 2): 53 ± 2 kDa for free NS3h and 55 ± 2 kDa for the complex with the 10-mer R10 oligonucleotide. These values are in good accordance with the theoretical values expected for a NS3h monomer: 53.4 kDa for free NS3h and 56.6 kDa for the complex.
Figure 2.
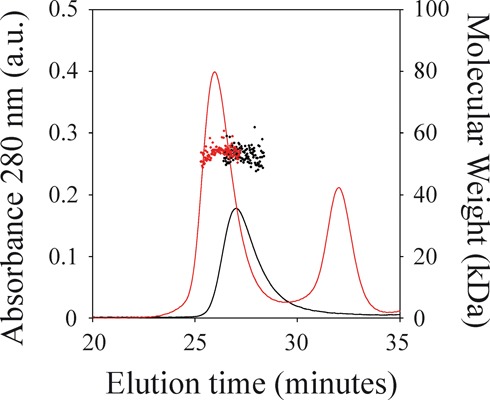
Molecular weight determinations of NS3h by static light scattering. Size-exclusion chromatography elution profiles of NS3h alone (black solid line) and of a 1:2 mixture of NS3h and the R10 oligonucleotide (red solid line) as monitored by the absorbance at 280 nm are shown (left axis). Molecular weights computed from 90° light scattering (right axis) are shown for the peak corresponding to elution of NS3h (black dots) and of the NS3h–RNA complex (red dots). Mean values (± standard error) of the corresponding molecular weights are 53 (± 2) kDa for NS3h alone, and 55 (± 2) kDa for the NS3h–RNA complex.
Therefore, these results indicate that NS3h appears as a monomer even in the presence of short ssRNA and, according to the PFG-NMR experiments, this oligomeric state does not change even at concentrations of protein as high as 250 μM.
Binding of dengue virus NS3h to ssRNA
With the aim of studying the interaction between ssRNA and NS3h, we performed a series of quantitative studies using ssRNA oligonucleotides of different lengths and sequences (Table 1). The main set of such oligonucleotides contains a repetitive sequence of five nucleotides (AGUUG) corresponding to the first five nucleotides of DENV2 genome (NCBI Reference Sequence: NC_001474.2; see Table 1).
Fluorescence titrations of fluorescein-labeled RNA oligonucleotides
Association of NS3h with ssRNA is not accompanied by adequate changes of the protein fluorescence to examine the binding process. However, we have found that formation of the complex between NS3h and ssRNA oligonucleotides labeled with a fluorescein moiety is accompanied by a significant increase of the nucleic acid fluorescence upon excitation at a wavelength of 495 nm, corresponding to an absorbance and excitation peak of the fluorescein moiety (Supplementary Figures S5 and S6). Such emission change provides a good signal to monitor the association of NS3h with ssRNA and to perform measurements to determine the mechanism of helicase–ssRNA association.
Fluorescence titrations of fluorescein-labeled RNA oligonucleotides of different lengths (6-, 11-, 13-, 16-, 19- and 21-mers) with the NS3h protein were performed at two or three different oligonucleotide concentrations in buffer B at 30°C (Figure 3). At higher oligonucleotide concentrations, more protein is required to obtain the same value of ΔFrel. This is because at higher RNA concentrations more protein is required to obtain the same degree of binding. Titration curves of the 6-mer at 42 and 400 nM were superimposed (Figure 3A), whereas for the other oligonucleotides, separation of the titration curves was observed up to at least 80% of saturation (Figure 3B–F).
Figure 3.
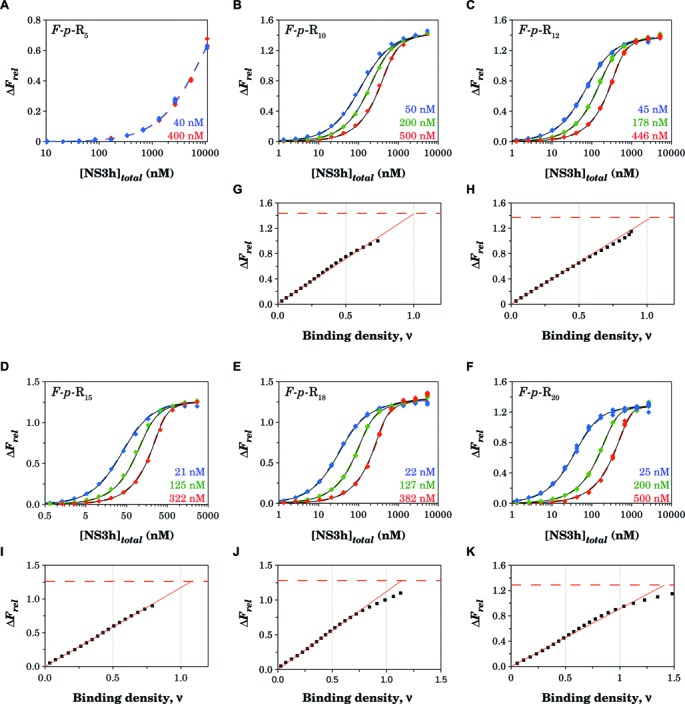
Fluorescence titrations of 5′-fluorescein-labeled oligonucleotides of different lengths with NS3h. Binding of NS3h to the oligonucleotides was monitored by the relative fluorescence increase upon excitation at 495 nm. (A–F) Titrations were performed in buffer B at 30°C at the indicated concentrations of the F-p-R oligonucleotides (see Table 1). Colored dashed lines are simulations based on Equation (11) (A–D) or Equation (12) (E and F) with parameter values shown in Table 2, which in turn were obtained from simultaneous nonlinear least-squares analysis of the data from each set of titration curves. Black solid lines are simulations of the statistical thermodynamic model with parameter values shown in Table 5 and Supplementary Table S2. (G–K) Dependence of the relative fluorescence increase on the binding density (ν) was obtained as explained in the Materials and Methods section. Solid straight lines are linear least-square fits that follow the initial linear phase of the plots and have no theoretical basis. Horizontal dashed lines indicate the value of the maximum fluorescence increase ΔFmax obtained from the titration curves.
With the exception of the 6-mer, the fluorescence titration curves shown in Figure 3B–F have been analyzed by the quantitative approach outlined in the Materials and Methods section to obtain thermodynamic binding parameters independent of any assumption about the relationship between the observed signal and the binding density (ν) (33).
Figure 3G–K shows the dependence of the relative fluorescence increase, ΔFrel, of the 11-, 13-, 16-, 19- and 21-mers as a function of ν. Extrapolation to the maximum relative fluorescence increase, ΔFmax, provides the stoichiometry of the complex. This analysis indicates that a single NS3h molecule binds to the 11-, 13- and 16-mers. The maximum stoichiometry of the NS3h–RNA complex changes for the 19- and 21-mers. In these cases, extrapolation of the initial linear phases to ν = 1 accounts for 88 ± 1% and 71 ± 1% of the maximum fluorescence increase. This is consistent with binding of a second NS3h molecule to these oligonucleotides accompanied with a smaller relative fluorescence increase than the binding of the first.
Taking into account these stoichiometries, binding of NS3h to the 6-, 11-, 13- and 16-mers was analyzed using a single-site binding isotherm:
 |
(11) |
whereas the sequential binding of two NS3h molecules to the 19- and 21-mers was analyzed using a two-site binding isotherm:
 |
(12a) |
 |
(12b) |
where K1 and K2 are the macroscopic association constants characterizing the binding of NS3h to an empty oligonucleotide or to an oligonucleotide with one bound protein, respectively (see Scheme 1); ΔFmax is the maximum relative fluorescence increase and ΔF1 is the relative fluorescence increase associated with the binding of the first NS3h molecule to the 19- and 21-mers (see Equation (7)). Note that Equations (11) and (12) are given as functions of the concentration of free NS3h, which is unknown, and must be solved in terms of the total concentrations of both NS3h and RNA to fit these equations to the titration curves. Each set of titration curves is well described by these equations (dashed lines in Figure 3). Best-fitting values for K1 and K2 are given in Table 2.
Scheme 1.
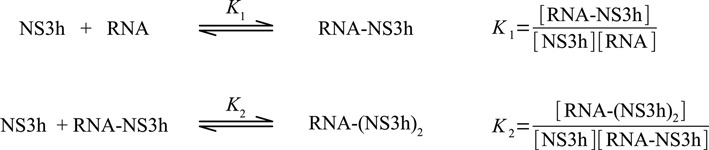
Reaction scheme for the binding of NS3h to ssRNA oligonucleotides.
Table 2. Empirical analysis of the titration curves of the fluorescein-labeled F-p-R oligonucleotides.
| F-p-R5 | F-p-R10 | F-p-R12 | F-p-R15 | F-p-R18 | F-p-R20 | |
|---|---|---|---|---|---|---|
| K1 (106 M−1) | 0.10 ± 0.01 | 11.3 ± 0.1 | 20.8 ± 0.5 | 36 ± 2 | 53 ± 2 | 68 ± 5 |
| K2 (106 M−1) | - | - | - | - | 1.5 ± 0.3 | 8.2 ± 0.9 |
| ΔF1 | - | - | - | - | 1.19 ± 0.01 | 1.06 ± 0.02 |
| ΔFmax | 1.21 ± 0.05 | 1.430 ± 0.003 | 1.380 ± 0.004 | 1.250 ± 0.008 | 1.28 ± 0.01 | 1.29 ± 0.01 |
We found that titration of the fluorescein-labeled oligonucleotides with NS3h was also accompanied by an increase in the fluorescence emitted upon excitation at a wavelength of 295 nm, which is located close to the absorbance and excitation peak of the protein (Supplementary Figures S7 and S8). Although the absolute fluorescence intensity was much lower, the magnitude of relative fluorescence increase was about two times that observed upon excitation at 495 nm (Supplementary Figure S7). Examination of the emission spectra of NS3h (295 nm →) and of the excitation spectra of the fluorescein-labeled oligonucleotides (→ 522 nm) provided evidence that part of the fluorescence increase can be ascribed to fluorescence resonance energy transfer (Supplementary Figure S8). Titration curves obtained from the record of this signal (total emission between 510 and 580 nm; Supplementary Figure S9) were analyzed as before and best-fitting values of parameters are shown in Supplementary Table S1. Given the low fluorescence intensities and, mainly, the need for inner filter corrections due to the absorbance of the protein, we judged that more reliable results are obtained from the fluorescence emitted upon excitation at 495 nm.
Additional titration experiments were carried out employing a 10-mer oligonucleotide with the AGUUG repeat labeled at its 3′ terminus (R10-F) and with other 5′-fluorescein-labeled oligonucleotides with different base sequences (Supplementary Figures S10 and S11). The results were analyzed as described above and, when possible, the stoichiometries and macroscopic association constants were obtained. Although the stoichiometries were coincident with those corresponding to the F-p-R oligonucleotides with the AGUUG repeat, lower affinities toward NS3h were observed, with values of macroscopic constants differing in as much as an order of magnitude (see the Discussion section). Interestingly, the change in affinity and in ΔFmax observed upon changing the position of fluorescein label—from the 5′ to the 3′ end of the R10 oligomer—is similar to what was reported in a study of NS3h from HCV (41).
Determination of maximum stoichiometries from electrophoretic mobility shift assays
In order to obtain an independent evaluation of the protein–RNA stoichiometries, we performed a series of gel retardation experiments in polyacrylamide gels under non-denaturing conditions using fluorescein-labeled oligonucleotides (Figure 4 and Table 1).
Figure 4.
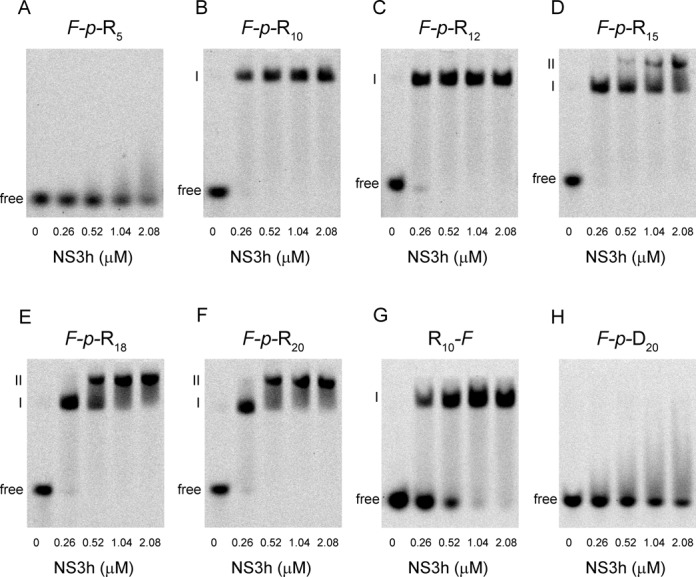
Electrophoretic mobility shift assays of fluorescein-labeled oligonucleotides with NS3h. The indicated fluorescein-labeled oligonucleotides at 0.25 μM were incubated with NS3h at the indicated concentrations. Free oligonucleotides migrate rapidly to the bottom of the gels, while oligonucleotides bound to NS3h are retarded. A laser scanner was used to visualize the fluorescent samples in the gels.
No retardation of the F-p-R5 oligonucleotide was observed in any of the RNA:NS3h mixtures assayed (Figure 4A) which is in accordance with the extremely low affinity observed in fluorescence titrations experiments (Figure 4A). Titrations of the F-p-R10 and longer oligonucleotides with NS3h produced one or two retarded bands depending on the oligonucleotide length and the RNA:protein ratio. Only one retarded band is observed for the F-p-R10 and F-p-R12 oligonucleotides, in accordance with a 1:1 stoichiometry, whereas two such bands are detected for the F-p-R15, F-p-R18 and F-p-R20 oligonucleotides. In these latter cases, the increase of the intensity of the more retarded band (band II) is concomitant with the decrease in the less retarded one (band I) (Figure 4 and Supplementary Figure S12), which is in accordance with the binding of two NS3h molecules on these longer oligonucleotides. Note that the stoichiometry for the F-p-R15 oligonucleotide diverges from the 1:1 stoichiometry obtained from fluorescence titrations experiments (Figure 3D and I). As will be discussed later this discrepancy may be the result of binding through a number of nucleotides lower than the minimum binding site size (see the Discussion section).
Additional gel retardation experiments were carried out with a 10-mer RNA labeled at its 3′ terminus (R10-F) and with a fluorescein-labeled 21-mer ssDNA (F-p-D20) (Figure 4G and H). One retarded band is observed for the R10-F oligonucleotide, as expected, whereas no retardation was observed for the ssDNA oligonucleotide, which is in accordance with the extremely low affinity for ssDNA reported by Wang et al. (21).
Fluorescence competition titrations of unlabeled RNA oligonucleotides
The change in fluorescence signal associated with NS3h binding to fluorescein-labeled oligonucleotides was exploited to monitor the interaction of NS3h with unlabeled RNA. According to the procedure described in (34) and the Materials and Methods section, we performed a series of competition titration experiments to characterize the binding of NS3h to unlabeled RNA oligonucleotides having the same AGUUG repetitive sequence as the fluorescein-labeled F-p-R oligonucleotides used above (see Table 1).
Fluorescence titrations of 50-nM F-p-R10 oligonucleotide with NS3h were performed in buffer B at 30°C and in the presence of different concentrations of unlabeled oligonucleotides of different lengths (10-, 12-, 15-, 18- and 20-mers) (Figure 5). In all cases, as the concentration of unlabeled oligonucleotide is increased, more protein is required to obtain the same value of ΔFrel, as would be expected if the unlabeled oligonucleotides compete with the fluorescein-labeled oligonucleotide for their binding to NS3h.
Figure 5.
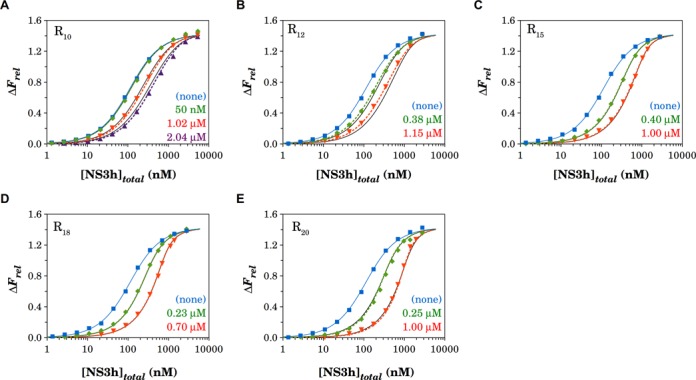
Competition titrations of unlabeled R oligonucleotides of different lengths with NS3h. Mixtures of F-p-R10 at 50 nM and each R oligonucleotide at the indicated concentrations were titrated with NS3h. Binding of NS3h to the F-p-R10 oligonucleotide was monitored by the relative fluorescence enhancement upon excitation at 495 nm. Titrations were performed in buffer B at 30°C. Colored lines are simulations of the model defined by Equations (11), (13) and (14) with values of parameters given in Table 2 for the binding of NS3h to the F-p-R10 oligonucleotide and with best-fitting parameter value given in Table 3 for the binding of NS3h to the R oligonucleotides. Black solid lines are simulations of the statistical thermodynamic model with parameter values shown in Table 5..
Competition titration experiments shown in Figure 5 were analyzed according to the quantitative model-independent approach outlined in the Materials and Methods section to obtain the dependence of the relative fluorescence increase, ΔFrel, as a function of the binding density to the unlabeled oligonucleotides (Supplementary Figure S13). In these experiments, the determination of maximum stoichiometries is not as direct and unambiguous than in the analysis of direct titrations as those obtained in Figure 3. However, it may be recognized that the monotonous hyperbolic dependence of the curves for the 10-, 12-, 15- and 18-mers is compatible with a maximum stoichiometry of 1 NS3h molecule per RNA (Supplementary Figure S13A–D), whereas the straight line passing through νu = 1 at a value of ΔFrel well below ΔFmax is not (34). Therefore this analysis suggests that one single NS3h molecule binds to the unlabeled 10-, 12-, 15- and 18-mers, whereas titration experiments in the presence of the 20-mer are compatible with a maximum stoichiometry of two NS3h molecules per oligonucleotide.
Therefore, taking into account these observations, binding to the unlabeled 10-, 12-, 15- and 18-mers was described using a single-site binding isotherm:
 |
(13) |
whereas binding to the unlabeled 20-mer was analyzed as a sequential binding of two NS3h molecules using a two-site binding isotherm:
 |
(14) |
where K1u and K2u are the macroscopic association constants characterizing the binding of NS3h to the unlabeled oligonucleotides (see Scheme 1).
The values of K1u and K2u were obtained by nonlinear regression analysis of the results using the model defined by binding isotherms given by Equations (13) or (14) and Equation (11), with values of K1f and ΔFmax for the F-p-R10 oligonucleotides as given in Table 2, and the mass balance Equation (10). Best-fitting values of K1u and K2u are given in Table 3.
Table 3. Empirical analysis of the competition titrations of the unlabeled R oligonucleotides with NS3h using F-p-R10 as the reference macromolecule.
| R10 | R12 | R15 | R18 | R20 | |
|---|---|---|---|---|---|
| K1 (106 M−1) | 1.69 ± 0.04 | 2.64 ± 0.06 | 7.4 ± 0.2 | 11.5 ± 0.3 | 16.7 ± 0.7 |
| K2 (106 M−1) | - | - | - | - | 0.6 ± 0.1 |
Additional competition titration experiments were carried out employing homo-oligonucleotides of adenine, (A)12 and (A)18, and of uracil, (U)12 and (U)20 (Supplementary Figure S14). Titration curves obtained in the presence of the (A)12 and (A)18 oligonucleotides were analyzed as described above. As expected, both oligomers bind a single NS3h molecule albeit with lower values of macroscopic association constants (Supplementary Figure S14A and B). In contrast, addition of the (U)12 oligomer at the concentrations tested (1.7 μM and 5.1 μM) produced no shift in the titration curves (Supplementary Figure S14C), whereas a slight shift was observed after addition of the (U)20 oligomer (Supplementary Figure S14D). These results indicate that binding of NS3h to uracil oligonucleotides is extremely weak under the reaction conditions employed.
Dependence of the macroscopic association constants on the oligonucleotide length
The macroscopic association constants K1 and K2, either for labeled or unlabeled oligonucleotides, are those that govern the sequential binding of one or two NS3h molecules to the oligonucleotide (Scheme 1) and contain hidden within them intrinsic association constants and statistical and, possibly, cooperativity factors. In order to extract information about these quantities, we first analyzed the dependence of the macroscopic association constant K1 on the oligonucleotide length (Figure 6). For lengths longer than 10 nucleotides, values of K1 varied linearly with the length of the RNA. This implies that binding of NS3h to the oligonucleotides can be described by the theory of non-specific interactions of large ligands to one-dimensional lattices (42), according to which the linear dependence of K1 on the oligonucleotide length is the result of the presence of multiple identical binding sites along the RNA, whose number increases with the length of the nucleic acid.
Figure 6.
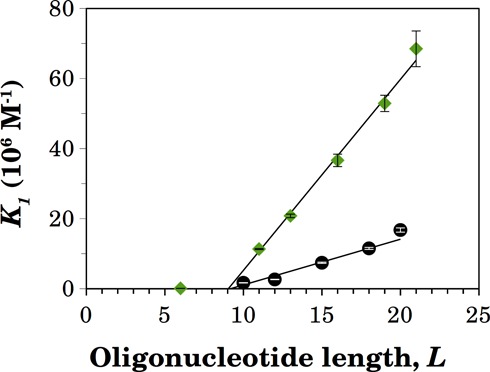
Length dependence of the macroscopic association constant K1 for the binding of NS3h to a naked oligonucleotide. Values of K1 were obtained from the analysis of the titration curves of the F-p-R oligonucleotides shown in Figure 3 (diamonds) and of the competition titrations of the R oligonucleotides shown in Figure 5 (circles). Error bars represent the standard error of estimated values of K1 provided by nonlinear regression analysis. The continuous lines are the plots of Equation (15) with best-fitting parameter values of n = (10.0 ± 0.2) nucleotides and Kint = (5.6 ± 0.2) 106 M−1 for F-p-R oligonucleotides and of n = (10.2 ± 0.6) nucleotides and Kint = (1.3 ± 0.2) 106 M−1 for unlabeled R oligonucleotides.
According to this theory, for lengths longer than the minimum number of nucleotides required for the protein to engage all possible contacts with the RNA (the ‘minimum binding site size’), the macroscopic association constant for the binding of the protein to a naked oligonucleotide is given by
 |
(15) |
where L denotes the length of the oligonucleotide, n is the minimum binding site size and Kint is the intrinsic association equilibrium constant. This equation plotted as a function of L describes a straight line with slope Kint and abscissa intercept (n − 1). According to this preliminary analysis, binding of NS3h to the fluorescein-labeled oligonucleotides containing the AGUUG repeat (Figure 6 and Supplementary Figure S15) involves an intrinsic association constant of 5.6 ± 0.2 106 M−1 and a minimum binding site size n of 10.0 ± 0.2 nucleotides, whereas the values of these parameters for the binding to the unlabeled oligonucleotides (Figure 6) are 1.3 ± 0.2 106 M−1 and 10.2 ± 0.6 nucleotides. It is evident from these results that the presence of the fluorescent label employed (see Supplementary Figure S1) mainly affects the value of the intrinsic association constant Kint of the interaction of NS3h with RNA (see the Discussion section). The same analysis was done with the macroscopic association constants obtained for other oligonucleotides and the resulting values of Kint and n are shown in Table 4.
Table 4. Intrinsic association constant, Kint, and minimum binding site size, n, obtained from the analysis of the dependence of K1 on the oligonucleotide length.
| n (nucleotides) | Kint (106 M−1) | ΔrG°app (kJ mol−1) (4) | |
|---|---|---|---|
| F-p-R | 10.0 ± 0.2 | 5.6 ± 0.2 | − 39.2 ± 0.1 |
| F-p-S | 10.7 ± 0.8 | 0.53 ± 0.08 | −33.2 ± 0.4 |
| F-p-T18 | 10 (1) | 2.2 ± 0.3 | −36.8 ± 0.3 |
| F-p-V12 | 10 (1) | 1.1 ± 0.1 | −35.1 ± 0.2 |
| R | 10.2 ± 0.6 | 1.3 ± 0.2 | −35.5 ± 0.4 |
| (A) | 10 (1) | 0.14 ± 0.02 (2) | −29.9 ± 0.4 |
| (U) | 10 (1) | < 0.01 (3) | > − 23 |
Values of parameters Kint and n in Equations (15) for the F-p-R, F-p-S and R oligonucleotides were obtained by weighted linear regression analysis of the dependence of K1 on the oligonucleotide length. (1) Values of Kint for F-p-T18, F-p-V12, (A)12 and (A)18 oligonucleotides were computed from Equation (15) using an n value of 10 nucleotides and (2) the value of Kint for the (A) oligonucleotides was calculated as the average of the respective Kint values for (A)12 and (A)18. (3) The limit value of Kint for (U) oligomers was computed from the analysis of titration curves shown in Supplementary Figure S14C and D. (4) The apparent standard state free energy change for the binding reaction of NS3h and each RNA was computed as  , using temperature T = 303.15 K and gas constant R = 8.314 10−3 kJ mol−1 K−1. Its standard error, SE, was estimated by error propagation as
  .
.
Binding of NS3h to long poly(A)
In order to expand the experimental basis employed for estimating the occluded site size, we additionally studied the interaction of NS3h with poly(A), which was previously shown to modulate the ATPase activity of NS3h (10,32). To this end, we performed competition experiments in which different mixtures of NS3h and the F-p-R10 oligonucleotide were titrated with poly(A) (Figure 7).
Figure 7.
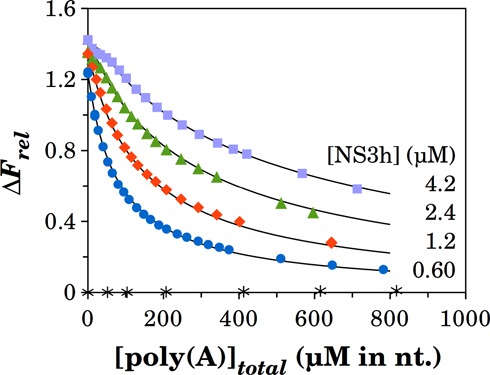
Competition of poly(A) and the F-p-R10 oligonucleotide for binding to NS3h. Mixtures of F-p-R10 at 51 nM and NS3h at the indicated concentrations were titrated with poly(A). Solid lines are simulations of the model defined by Equation (11) with values of K1 and ΔFmax for the F-p-R10 RNA as given in Table 2, and Equations (16–19) with best-fitting parameter values of KpA = (9.0 ± 0.1) 104 M−1, ωpA = 14 ± 1 and m = (10.9 ± 0.8) nucleotides. ΔFrel values of mixtures of F-p-R10 at 51 nM with poly(A) in the absence of NS3h (blank titration) are shown with asterisk labels.
Addition of poly(A) caused a decrease in the fluorescence intensity of the mixture toward that of the free F-p-R10 as expected if these molecules compete for their binding to NS3h. In that case, the mass balance equation for NS3h is
 |
(16) |
where νf and νpA are the binding densities for the F-p-R10 oligonucleotide and poly(A),
 |
(17) |
 |
(18) |
where [NS3h-R] and [NS3hpA] are the concentrations of NS3h bound to the F-p-R10 oligonucleotide and to poly(A), respectively, and [poly(A)]total is the total concentration of poly(A) in nucleotide residues. Values of νf were computed using Equation (11) with parameter values obtained above (Table 2). Binding to poly(A) was analyzed according to the formalism developed by McGhee and von Hippel for the non-specific interaction of large ligands to a one-dimensional lattice of infinite length (43). In such model, the generalized equation for the binding density is (44)
 |
(19a) |
where r is given by
 |
(19b) |
KpA, m and ωpA denote the intrinsic association constant, the occluded site size and the cooperativity factor, respectively, characterizing the binding of NS3h to poly(A).
Fitting these equations to the experimental results provided the best values of parameters shown in Figure 7. These results indicate that the intrinsic affinity of NS3h for poly(A) is about an order of magnitude lower than for the oligonucleotides and show the presence of positive cooperative interactions between NS3h molecules bound on adjacent sites. Additionally, this analysis provides an estimate of about 11-nucleotide residues for the occluded site size, m, which is defined as the average number of contiguous nucleotide residues made inaccessible to other proteins by the binding of one protein (43).
Statistical thermodynamic model for the interaction between NS3h and ssRNA
Up to this point, we have shown that ssRNA oligonucleotides used in this work can bind one or two NS3h molecules depending on their lengths and that binding of NS3h to free RNA can be described as a non-specific interaction with multiple identical and overlapped binding sites along the RNA (Figure 6). In order to fit a unique set of interaction parameters to the titration curves presented above, a general statistical thermodynamic model was formulated.
The grand canonical partition function for the two reactions depicted in Scheme 1 is
 |
(20) |
and the binding density is given by
 |
(21) |
where [NS3h] is the concentration of free NS3h, g is the maximum number of protein molecules that can bind to the RNA which, in this case, can take the values 1 or 2. K1 and K2 are, as before, the macroscopic association constants for the binding of the first and second NS3h molecules to the RNA and, as we have seen, must be functions of the oligonucleotide length. The definition of the first macroscopic constant, K1, was given above, and it is simply the product of the number of identical binding sites per RNA molecule and the intrinsic association constant Kint (see Equation (15)). The second macroscopic constant, K2, is also readily obtained from the combinatorial formalism developed by Epstein (42) and it is composed of the intrinsic association constant Kint, combinatorial factors and, unlike K1, a cooperativity factor. Two kinds of binding sites are distinguished for the ingress of the second NS3h molecule: (i) isolated sites, which are separated by at least one nucleotide from the NS3h already bound to the RNA, and (ii) contiguous sites, which are in immediate adjacency of the firstly bound NS3h. Thus, K2 can be expressed as the sum of a macroscopic constant for the binding of the second NS3h molecule to an isolated site (K2iso) and a constant for the binding to a contiguous site (K2con),
 |
(22) |
Under these definitions, K2iso is the product of the intrinsic association constant Kint and the average number of isolated binding sites per RNA–NS3h complex, whereas K2con is the product of Kint, a cooperativity factor ω and the average number of contiguous sites per RNA–NS3h complex:
 |
(23) |
 |
(24) |
where L denotes the length of the oligonucleotide, n is the minimum binding site size, Kint is the intrinsic association equilibrium constant and m is the occluded site size. The difference between m and n denotes the number of nucleotide residues that are covered—and occluded—by the protein but do not belong to the length of the minimum binding site.
Replacing Equations (23) and (24) with Equation (22), we obtain
 |
(25a) |
In the case that the minimum and occluded site size are coincident, n = m, this expression (25a) simplifies out to
 |
(25b) |
The model defined by Equations (15) and (20)–(25) together with Equations (11) and (12) was used to analyze the titration curves of the 5′-fluorescein-labeled oligomers with the AGUUG repeat excepting the titration curves of the F-p-R5 oligonucleotide (Figure 3) and, together with Equations (11), (13) and (14), the competition titration curves obtained with the unlabeled oligonucleotides with the AGUUG repeat (Figure 5). The value of minimum binding site size n for both labeled and unlabeled oligomers was fixed at a value of 10 nucleotides on the basis of the results shown in Table 4. Given that the estimated value of n is, within experimental error, equal to the value of occluded site size m estimated from the experiments with poly(A) (10.9 ± 0.8 nucleotides; Figure 7), Equation (25b) was employed. Additionally, in order to make the implementation of the model well posed, a special treatment of the titration curves of the F-p-R18 oligomer was required. We observed a maximum stoichiometry of 2 NS3h molecules per F-p-R18 oligomer. And, under our assumption that the 5′-fluorescein label adds one nucleotide to the oligonucleotide length L, its length (19 nucleotides) is not large enough to admit the binding of 2 NS3h molecules occupying n = 10 nucleotides each, and thus one of the two NS3h molecules bound in a 2:1 complex must engage its binding through 9 nucleotides. Although it is absolutely physically plausible that such interaction takes place, the model, as was formulated above, cannot cope with its possibility. Indeed, it can be verified from Equation (25b) that the value of K2 vanishes if L = 19 and n = 10 nucleotides. To solve this problem, the value of K2 for the binding of NS3h to F-p-R18 was modeled as (cf. Equation (25b)):
 |
(26) |
where x denotes a factor < 1 accounting for a smaller affinity than that dictated by Kint.ω.
Nonlinear least-square regression analysis provided the best-fitting values of the parameters shown in Table 5 and Supplementary Table S2. It can be seen that these sets of parameters provide a good description of the experimental results obtained with the labeled and unlabeled oligonucleotides (solid lines in Figures 3 and 5).
Table 5. Energetic binding parameters of the statistical thermodynamic model for the binding of NS3h to ssRNA.
| F-p-R oligomers | R oligomers | F-p-S oligomers | poly(A) | |
|---|---|---|---|---|
| Kint (106 M−1) | 5.37 ± 0.07 | 1.30 ± 0.02 | 0.44 ± 0.02 | 0.090 ± 0.001 |
| ω | 9 ± 1 | 8 ± 1 | n.d.(1) | 14 ± 1 |
Best-fitting values and standard errors of the parameters in Equations (15) and (22) were obtained by simultaneous nonlinear regression analysis of titration curves for each series of ssRNA, (Figures 3B–F, 5 and Supplementary Figure S11). For comparison, energetic parameters for the binding to poly(A) obtained from experiments shown in Figure 7 are also included. Best-fitting values of spectroscopic parameters for F-p-R and F-p-S oligonucleotides are given in Supplementary Table S2 and Supplementary Figure S11, respectively. Best fitting value of parameter x of Equation (26) is 0.35 ± 0.09. (1) The value of ω for the F-p-S oligonucleotides was poorly defined by the data, obtaining a variation coefficient larger than 100% in the fitting process.
The same analysis was applied to the titration curves of the 5′-fluorescein-labeled oligomers with the GUUCU repeat (F-p-S in Table 1; Supplementary Figure S11) and the best-fitting values of the parameters are also shown in Table 5.
DISCUSSION
Oligomeric state of dengue virus NS3h
It is generally accepted that superfamily 2 (SF2) helicases—to which Flaviviridae NS3 proteins belong—are active enzymes as monomers or dimers (19,20,45). For instance, HCV NS3 helicase—the most studied NS3 protein—has been proposed to function as a monomer (46,47) and as a dimer (48), with different oligomerization properties having been assigned to the full-length protein and the isolated helicase domain (49). Feito et al. (50) studied the quaternary structure of West Nile virus NS3 helicase and found it to be monomeric albeit the enzyme preparation used in that work was devoid of helicase activity. Mastrangello et al. (51) studied the oligomeric state of Kunjin virus NS3 and found that, in the absence of nucleic acids, both the full-length protein and the isolated helicase domain were monomeric molecules.
Dengue virus NS3 protein was proposed to be a monomer on the basis of crystallographic studies (13) and, more recently, of small-angle X-ray scattering measurements (52). In the present work, we have specifically studied the oligomeric nature of dengue virus NS3h by the determination of the hydrodynamic radius and MW in solution.
PFG-NMR experiments showed that the hydrodynamic radius (Rh) of NS3h did not change when the enzyme concentration was varied, both in the absence and presence of a 10-mer RNA oligonucleotide containing the AGUUG repeat (R10 in Table 1) and of the nonhydrolyzable ATP analog AMP-PNP. Mean values of Rh were (i) 3.0 (± 0.1) nm for NS3h alone, (ii) 3.1 (± 0.1) nm for NS3h in the presence of R10, (iii) 2.8 (± 0.3) nm for NS3h in the presence of AMP-PNP and (iv) 2.9 (± 0.2) nm for NS3h in the presence of both R10 and AMP-PNP (Figure 1). These values may be compared to the expected values for a globular folded protein taking into account only the number of amino acid residues (Equation (3) in (53)): 2.84 nm for a monomer (469 residues) and 3.46 nm for a dimer. Additionally, Rh values computed considering only the crystallographic coordinates of DENV4 NS3h monomers (18,54) provide estimates of 3.13 and 3.15 nm for apo-NS3h (PDB ID 2JLQ) and for NS3h complexed with ssRNA (PDB ID 2JLU), respectively. Notably, higher values of Rh were assigned by dynamic light scattering measurements to a monomeric form of Kunjin virus NS3h (3.4 nm; (51)) and of HCV NS3h (3.9 nm; (49)), both of which shares homology with dengue virus NS3h and has approximately the same number of amino acid residues.
Ultimately, the oligomeric state of NS3h associated with the observed value of Rh (Figure 1) was assessed by the determination of its MW by SEC-SLS experiments. We observed that NS3h eluted as a monodisperse protein with an MW nearly equal to that expected for a monomeric NS3h (53 kDa) both in the absence and presence of a 10-mer RNA oligonucleotide (Figure 2).
Interaction of dengue virus NS3h with ssRNA
Fluorescence titrations of fluorescein-labeled oligonucleotides and competition titrations of unlabeled oligonucleotides allowed us to obtain quantitative information about the stoichiometry (the minimum and the occluded binding site sizes) and the energetics (intrinsic affinity and cooperativity) of the interaction of dengue virus NS3h and ssRNA.
The first point to be made about the analysis of the titration curves is that all of them could be described by simple isotherms derived for a monomeric ligand (NS3h) (Figures 3, 5 and 7, Supplementary Figures S10, S11 and S14 and Equations (11)–(14) and (19)) which constitutes a further support to the findings discussed above.
Model-independent analysis of titration curves obtained with fluorescein-labeled oligonucleotides indicated that the maximum number of NS3h molecules that can bind to each oligonucleotide was 1 for the F-p-R5, F-p-R10, F-p-R12 and F-p-R15 oligomers and 2 for the F-p-R18 and F-p-R20 oligomers (Figure 3). The same stoichiometries were obtained in electrophoretic mobility shift experiments excepting the case of the F-p-R15 oligomer, which, in these experiments, was able to bound two NS3h molecules (Figure 4). In order to analyze this discrepancy, it must be noted that quite different measurement conditions were applied in these two experimental techniques. We can mention the following relevant points: the temperature was ∼4ºC during running in the mobility shift assays, whereas it was 30ºC in the fluorescence titrations; the composition of the running buffer greatly differs from that of the media employed during fluorescence titrations both in monovalent and divalent salts content (see the Materials and Methods section); besides the non-equilibrium condition inherently associated with the migration driven by an electric field, it is known that binding reactions can be influenced by the presence of the gel matrix (55).
In any case, binding of two NS3h molecules to the F-p-R15 oligomer would require that at least one NS3h molecule binds through a number of nucleotide residues smaller than the estimated value for the minimum binding site size (∼10 nt; Figure 6 and Table 4) and, such as it is observed in the titrations of the 6-mer F-p-R5 (Figure 6A), this interaction would occur with an affinity lower than that dictated by the value of the intrinsic association constant Kint (see Equation (15)). We tested the 2:1 stoichiometry model (described by Equation (12)) to fit the titration curves of the F-p-R15 oligomer and found that fitting was not improved and that the parameters characterizing the binding of the second NS3h molecule (K2 and ΔF2) remained highly undetermined (data not shown). More importantly, the estimated value of K1 was nearly equal to the value obtained with the 1:1 stoichiometry model (Equation (11))—(37 ± 1) 106 M−1 and (36 ± 2) 106 M−1, respectively—and thus does not alter the results of the analysis of the dependence of K1 on the oligonucleotide length.
Binding of NS3h to ssRNA can be described by the theory of non-specific interactions of large ligands to a one-dimensional lattice
A first conclusion that can be drawn from the analysis of the dependence of K1 on the oligonucleotide length (Figure 6) is that, from a phenomenological perspective, binding of one NS3h molecule to ssRNA can be described as a non-specific interaction with multiple identical and overlapped binding sites along the RNA. In other words, as mentioned in the Results section and explained elsewhere (42), a linear dependence of K1 on the oligonucleotide length implies that the whole set of K1 values may be described with a unique value of intrinsic association constant (Kint) and of minimum binding site size (n) (see Equation (15)) and, in turn, indicates that ‘end effects’ are not evident and that there is a unique binding mode in which NS3h establishes its association with ssRNA (42,56).
Additionally, the analysis of the dependence of K1 on the oligonucleotide length (Figure 6) provided a quantitative characterization of the effect of the fluorescent label on the interaction of NS3h with the ssRNA tested in this work. In particular, the introduction of the fluorescein label at the 5′ terminus produced an ∼4-fold increase in the value of the intrinsic association constants Kint evaluated as the slope of the plot of K1 as a function of oligonucleotide length ((5.6 ± 0.2) μM−1 and (1.3 ± 0.2) μM−1 for labeled and unlabeled oligonucleotides, respectively). This observation can best be discussed within the framework of the theory of the non-specific interaction of large ligands with one-dimensional lattices applied to the interaction of a protein with a nucleic acid for the case of a single binding mode. Two fundamental concepts of this theory are pointed out here: (i) the observed value of the ‘macroscopic’ association constant for the binding of one protein molecule is equal to the sum of ‘microscopic’ association constants over all possible binding sites along the nucleic acid, and (ii) the addition of nucleotides to the length of the nucleic acid involves an increment in the number of those possible binding sites. Therefore, a linear increment in the observed value of the macroscopic association constant K1 with the length of the nucleic acid implicates that the binding sites added as a results of the incorporation of nucleotides to the nucleic acid present the same value of microscopic association constant.
Taking into account these premises, it may be expected that the introduction of the fluorescein label at the end of an oligonucleotide would not alter the slope of the plot of K1 as a function of the oligonucleotide length. That is, the plot would be expected to be parallel to the plot obtained for the unlabeled oligonucleotides and only the value of the abscissa intercept would be affected. Naturally, such would be the case if the label only affects the microscopic association constant of the binding sites in which the 5′ terminus is directly involved and not of those binding sites incorporated as the oligonucleotide length is increased. On the contrary, the change in the value of intrinsic association constant Kint indicates that the action exerted by the 5′-fluorescein label extends beyond the binding sites involving the 5′ terminus. Moreover, the observed linearity in the values of K1 indicates that the label exerts an effect of virtually equal magnitude over all binding sites incorporated in the range of oligonucleotide lengths tested (from 10 to 20 nucleotides).
From an energetic point of view, the effect of 5′-fluorescein label on the interaction of NS3h with ssRNA involves a change in the apparent standard state free energy change for the binding reaction of about −3 kJ mol−1 (computed as ΔΔrG°unlabeled → labeled = ΔrG°labeled − ΔrG°unlabeled; see Table 4), a value that is close to the average contribution of each nucleotide residue within the RNA binding site of NS3h computed as ΔrG°unlabeled/n.
Another important point of this analysis is concerned with the estimation of the minimum binding site size n characterizing the interaction of NS3h with ssRNA. The results obtained through titrations of 5′-fluorescein-labeled oligonucleotides and through competition titrations of the unlabeled oligonucleotides are both consistent with a minimum site size of about 10 nucleotides (Table 4), which indicates that, unlike the value of the intrinsic association constant, the estimated value of n was little affected by the introduction of the 5′-fluorescein label.
The agreement between these results is somewhat surprising as there are at least two ways in which the introduction of the 5′-fluorescein label could affect the estimation of n. Firstly, its value will be affected by the contribution of the fluorescein label to the effective length L of the oligonucleotides (whereas the estimation of Kint is not; see Equation (15)). In this regard, we must recall here that the values of the oligonucleotide lengths employed in the analysis were assigned assuming that the introduction of fluorescein label through a phosphodiester bond was equivalent to the addition of 1 nucleotide residue (see the Materials and Methods section). Secondly, in addition to its contribution to the effective length, the introduction of the fluorescent label at the oligonucleotide end will affect the estimated value of n if its action over the binding sites located at the labeled end is of different magnitude than over those sites incorporated as the oligonucleotide length is increased. This can be deduced from the definition of macroscopic association constant K1.
Through competition experiments, it was found that binding of NS3h to poly(A) can be satisfactorily analyzed by the formalism developed by McGhee and von Hippel for the non-specific interaction of large ligands to a one-dimensional lattice of infinite length (Figure 7 and Equation (19)) (43,57). The analysis of these experiments indicated that binding of each NS3h molecule is accompanied by the occlusion of about 11-nucleotide residues. This estimate of the occluded site size (m) turns out to be approximately equal to the estimated value for the minimum site size (n).
The statistical thermodynamic model described in the Results section (Scheme 1 and Equations (15) and (25)), formulated according to the combinatorial approach developed by Epstein (42,57), allowed us to obtain estimates of the stoichiometric and energetic parameters characterizing the binding of NS3h to ssRNA from simultaneous fitting to the titration curves shown in Figure 3 (panels B–F) and in Figure 5 (see Table 5).
The minimum and occluded binding sites of dengue virus NS3h comprise between 10 and 11 nucleotides
Global fitting to the results indicated that the estimated values of the minimum and occluded site sizes are not significantly different (Table 5), both having a value of about 10 nucleotides. This value may be compared with the binding site size estimated from crystallographic studies of dengue virus NS3 complexed with ssRNA (18), where a stretch of 7-nucleotide residues was resolved within the RNA-binding cleft of the protein. More recently, from the analysis of the effect of poly(A) and poly(C) on the steady-state ATPase activity of dengue virus NS3h (32), we obtained an estimate for the occluded site size of 11 nucleotides, which is in excellent agreement with the results reported in this work.
Notably, similar values were obtained for other SF2 and SF1 helicases (46,58–60). A closely related example is that of HCV NS3h for which Levin et al. (46) reported a minimum and occluded site sizes of 8 and 11 nucleotides, respectively, based on fluorescence titrations with ssDNA. For the RecQ protein, another SF2 helicase, Shuo-Xing Dou et al. (60) reported a value of 10 nucleotides for the minimum binding site size based on fluorescent titrations of 5′-fluorescein-labeled ssDNA. These similarities in the binding site sizes may be rooted on the structural similarities displayed by these types of monomeric helicases (19,45).
It is important to recall here that the experiments presented in this work—as well as in the two examples referenced above—were carried out in reaction media containing a fixed total concentration of Mg2+, which is known to induce changes in the binding site sizes of other nucleic acid binding proteins (61,62). We are currently performing experiments to address this issue.
NS3h binds to ssRNA oligonucleotides and to poly(A) with different intrinsic affinities but with similar values of cooperative interaction factor
Analysis of binding experiments with labeled and unlabeled ssRNA indicated that the intrinsic affinity of NS3h for oligonucleotides containing the AGUUG repeat was higher than for the other sequences tested. In the case of unlabeled AGUUG oligonucleotides, the affinity was ∼10 times higher than for adenine oligonucleotides as well as for poly(A) and at least 100 times higher than for uracil oligonucleotides (Table 4). These results suggest that NS3h displays a preference for the alternating sequence present in the AGUUG oligonucleotides. However, we cannot exclude the possibility that such differences in affinity were due to some degree of folding of the adenine and uracil homopolymers (63,64).
Interestingly, while both poly(A) and poly(C) were found to modulate the ATPase activity of NS3h (at 25°C, 20-mM KCl and pH 6.5 (32)), poly(C) did not displace the F-p-R10 oligonucleotide under the reaction conditions employed in this work (data not shown). However, we verified that poly(C), as well as poly(A), did displace the F-p-R10 oligonucleotide when the concentration of KCl was lowered from 100 mM to 20 mM—as in the media where ATPase activity was previously measured—(data not shown). Although more experiments are needed to elucidate the origin of this apparent change in NS3h specificity toward poly(A) and poly(C), it may be mentioned that such change could be due to the presence of structured conformations of poly(C)—inaccessible to NS3h—which are thermodynamically favored by higher salt concentrations (65).
According to the models employed for the analysis of the titration experiments (42,43), the estimated value of the cooperativity factor ω indicates that NS3h binds to sites contiguous to other NS3h molecule about 10 times more tightly than to isolated sites along the RNA molecule (Table 5). Contrasting with the differences observed in the values of the intrinsic association constant, the estimated values of ω were almost equal for the oligonucleotides and poly(A) (Table 5). It is appealing to consider that the observed similarity in the values of ω arises from the fact that the same protein–protein interactions are involved. However, it must be kept in mind that cooperative interactions in the binding of a ligand to a nucleic acid can result from ligand–ligand interactions and/or short-range conformational and electrostatic changes that are induced in the nucleic acid on ligand binding (66). Regarding possible implications of cooperative binding to RNA for the function of DENV NS3h, it is important to mention that multiple helicase molecules along the loading strand of a double-stranded nucleic acid substrate were previously reported to be accompanied with an enhancement of helicase activity for SF1 and SF2 helicases, and ‘functional cooperative’ models have been proposed to explain these observations (20).
Comparison of the estimated values of the energetic parameters Kint and ω with those obtained for other helicases will be meaningful only after characterizing the effects of temperature, pH and salt concentration. Such studies are still required to get an insight of the forces involved in the interaction of NS3h with ssRNA.
SUPPLEMENTARY DATA
Supplementary Data are available at NAR Online.
Acknowledgments
The comprehensive and thought-provoking articles on protein–nucleic acid interactions by Professors Timothy M. Lohman and Wlodzimierz Bujalowski deserve particular acknowledgment here for their influence upon our work. We thank Martín Aran for his assistance with PFG-NMR measurements.
Footnotes
The authors wish it to be known that, in their opinion, the first two authors should be regarded as Joint First Authors.
FUNDING
This work was supported by the Agencia Nacional de Promoción Científica y Tecnológica (ANPCyT,Argentina) [PICT-2012-0497 to S.B.K., PICT-2010-2092 to A.V.G.]; the Universidad de Buenos Aires [UBACYT 20020120200149 to S.B.K.]; and the National Institutes of Health (NIH, United States ofAmerica) [1R01AI095175-01 to A.V.G.]. A.V.G. and L.G.G. are members of the Concejo Nacional deInvestigaciones Científicas y Técnicas (CONICET, Argentina). J.J.I. was funded by a doctoral fellowship UBACYT from Universidad de Buenos Aires. C.S. was funded by a postdoctoral fellowship from CONICET. Funding for open access charge: AgenciaNacional de Promoción Científica y Tecnológica (ANPCyT, Argentina).
Conflict of interest statement. None declared.
REFERENCES
- 1.Gubler D.J. Epidemic dengue/dengue hemorrhagic fever as a public health, social and economic problem in the 21st century. Trends Microbiol. 2002;10:100–103. doi: 10.1016/s0966-842x(01)02288-0. [DOI] [PubMed] [Google Scholar]
- 2.Bhatt S., Gething P.W., Brady O.J., Messina J.P., Farlow A.W., Moyes C.L., Drake J.M., Brownstein J.S., Hoen A.G., Sankoh O., et al. The global distribution and burden of dengue. Nature. 2013;496:504–507. doi: 10.1038/nature12060. [DOI] [PMC free article] [PubMed] [Google Scholar]
- 3.World Health Organization. Dengue: Guidelines for Diagnosis, Treatment, Prevention, and Control. World Health Organization, Geneva, Switzerland: 2009. [PubMed] [Google Scholar]
- 4.Weaver S.C., Vasilakis N. Molecular evolution of dengue viruses: contributions of phylogenetics to understanding the history and epidemiology of the preeminent arboviral disease. Infect. Genet. Evol. 2009;9:523–540. doi: 10.1016/j.meegid.2009.02.003. [DOI] [PMC free article] [PubMed] [Google Scholar]
- 5.Chambers T.J., Hahn C.S., Galler R., Rice C.M. Flavivirus genome organization, expression, and replication. Annu. Rev. Microbiol. 1990;44:649–688. doi: 10.1146/annurev.mi.44.100190.003245. [DOI] [PubMed] [Google Scholar]
- 6.Gebhard L.G., Filomatori C.V., Gamarnik A.V. Functional RNA elements in the dengue virus genome. Viruses. 2011;3:1739–1756. doi: 10.3390/v3091739. [DOI] [PMC free article] [PubMed] [Google Scholar]
- 7.Perera R., Kuhn R.J. Structural proteomics of dengue virus. Curr. Opin. Microbiol. 2008;11:369–377. doi: 10.1016/j.mib.2008.06.004. [DOI] [PMC free article] [PubMed] [Google Scholar]
- 8.Bollati M., Alvarez K., Assenberg R., Baronti Cé., Canard B., Cook S., Coutard B., Decroly E., Lamballerie X.d., Gould E.A., et al. Structure and functionality in flavivirus NS-proteins: perspectives for drug design. Antiviral Res. 2010;87:125–148. doi: 10.1016/j.antiviral.2009.11.009. [DOI] [PMC free article] [PubMed] [Google Scholar]
- 9.Cui T., Sugrue R.J., Xu Q., Lee A.K.W., Chan Y.-C., Fu J. Recombinant dengue virus type 1 NS3 protein exhibits specific viral RNA binding and NTPase activity regulated by the NS5 protein. Virology. 1998;246:409–417. doi: 10.1006/viro.1998.9213. [DOI] [PubMed] [Google Scholar]
- 10.Li H., Clum S., You S., Ebner K.E., Padmanabhan R. The serine protease and RNA-stimulated nucleoside triphosphatase and RNA helicase functional domains of dengue virus type 2 NS3 converge within a region of 20 amino acids. J. Virol. 1999;73:3108–3116. doi: 10.1128/jvi.73.4.3108-3116.1999. [DOI] [PMC free article] [PubMed] [Google Scholar]
- 11.Bartelma G., Padmanabhan R. Expression, purification, and characterization of the RNA 5′-triphosphatase activity of dengue virus type 2 nonstructural protein 3. Virology. 2002;299:122–132. doi: 10.1006/viro.2002.1504. [DOI] [PubMed] [Google Scholar]
- 12.Gebhard L.G., Kaufman S.B., Gamarnik A.V. Novel ATP-independent RNA annealing activity of the dengue virus NS3 helicase. PloS ONE. 2012;7:e36244. doi: 10.1371/journal.pone.0036244. [DOI] [PMC free article] [PubMed] [Google Scholar]
- 13.Xu T., Sampath A., Chao A., Wen D., Nanao M., Chene P., Vasudevan S.G., Lescar J. Structure of the dengue virus helicase/nucleoside triphosphatase catalytic domain at a resolution of 2.4 Å. J. Virol. 2005;79:10278–10288. doi: 10.1128/JVI.79.16.10278-10288.2005. [DOI] [PMC free article] [PubMed] [Google Scholar]
- 14.Jankowsky E., Fairman M.E. RNA-helicases—-one-fold-for-many-functions. Curr. Opin. Struct. Biol. 2007;17:316–324. doi: 10.1016/j.sbi.2007.05.007. [DOI] [PubMed] [Google Scholar]
- 15.Liao J.-C. Mechanical transduction mechanisms of RecA-like molecular motors. J. Biomol. Struct. Dyn. 2011;29:497–507. doi: 10.1080/07391102.2011.10507401. [DOI] [PubMed] [Google Scholar]
- 16.Gorbalenya A.E., Koonin E.V., Donchenko A.P., Blinov V.M. Two related superfamilies of putative helicases involved in replication, recombination, repair and expression of DNA and RNA genomes. Nucleic Acids Res. 1989;17:4713–4730. doi: 10.1093/nar/17.12.4713. [DOI] [PMC free article] [PubMed] [Google Scholar]
- 17.Cordin O., Banroques J., Tanner N., Linder P. The DEAD-box protein family of RNA helicases. Gene. 2006;367:17–37. doi: 10.1016/j.gene.2005.10.019. [DOI] [PubMed] [Google Scholar]
- 18.Luo D., Xu T., Watson R.P., Scherer-Becker D., Sampath A., Jahnke W., Yeong S.S., Wang C.H., Lim S.P., Strongin A., et al. Insights into RNA unwinding and ATP hydrolysis by the flavivirus NS3 protein. EMBO J. 2008;27:3209–3219. doi: 10.1038/emboj.2008.232. [DOI] [PMC free article] [PubMed] [Google Scholar]
- 19.Singleton M.R., Dillingham M.S., Wigley D.B. Structure and mechanism of helicases and nucleic acid translocases. Annu. Rev. Biochem. 2007;76:23–50. doi: 10.1146/annurev.biochem.76.052305.115300. [DOI] [PubMed] [Google Scholar]
- 20.Lohman T.M., Tomko E.J., Wu C.G. Non-hexameric DNA helicases and translocases: mechanisms and regulation. Nat. Rev. Mol. Cell Biol. 2008;9:391–401. doi: 10.1038/nrm2394. [DOI] [PubMed] [Google Scholar]
- 21.Wang C.-C., Huang Z.-S., Chiang P.-L., Chen C.-T., Wu H.-N. Analysis of the nucleoside triphosphatase, RNA triphosphatase, and unwinding activities of the helicase domain of dengue virus NS3 protein. FEBS Lett. 2009;583:691–696. doi: 10.1016/j.febslet.2009.01.008. [DOI] [PubMed] [Google Scholar]
- 22.Kolthoff I.M., Sandell E.B., Meehan E.J., Bruckenstein S. Quantitative Chemical Analysis. New York, NY: Macmillan Pub Co; 1969. [Google Scholar]
- 23.Kinney R.M., Butrapet S., Chang G.J., Tsuchiya K.R., Roehrig J.T., Bhamarapravati N., Gubler D.J. Construction of infectious cDNA clones for dengue 2 virus: strain 16681 and its attenuated vaccine derivative, strain PDK-53. Virology. 1997;230:300–308. doi: 10.1006/viro.1997.8500. [DOI] [PubMed] [Google Scholar]
- 24.Pace C.N., Vajdos F., Fee L., Grimsley G., Gray T. How to measure and predict the molar absorption coefficient of a protein. Protein Sci. 1995;4:2411–2423. doi: 10.1002/pro.5560041120. [DOI] [PMC free article] [PubMed] [Google Scholar]
- 25.Jezewska M.J., Galletto R., Bujalowski W. Interactions of the RepA helicase hexamer of plasmid RSF1010 with the ssDNA. Quantitative analysis of stoichiometries, intrinsic affinities, cooperativities, and heterogeneity of the total ssDNA-binding site. J. Mol. Biol. 2004;343:115–136. doi: 10.1016/j.jmb.2004.08.021. [DOI] [PubMed] [Google Scholar]
- 26.Cavaluzzi M.J., Borer P.N. Revised UV extinction coefficients for nucleoside-5′-monophosphates and unpaired DNA and RNA. Nucleic Acids Res. 2004;32:e13. doi: 10.1093/nar/gnh015. [DOI] [PMC free article] [PubMed] [Google Scholar]
- 27.Merrill M.R. NMR diffusion measurements using a composite gradient PGSE sequence. J. Magn. Reson. 1993;103:223–225. [Google Scholar]
- 28.Jones J.A., Wilkins D.K., Smith L.J., Dobson C.M. Characterisation of protein unfolding by NMR diffusion measurements. J. Biomol. NMR. 1997;10:199–203. [Google Scholar]
- 29.Stejskal E., Tanner J. Spin diffusion measurements: spin echoes in the presence of a time-dependent field gradient. J. Chem. Phys. 1965;42:288–292. [Google Scholar]
- 30.Schultz S.G., Solomon A. Determination of the effective hydrodynamic radii of small molecules by viscometry. J. Gen. Physiol. 1961;44:1189–1199. doi: 10.1085/jgp.44.6.1189. [DOI] [PMC free article] [PubMed] [Google Scholar]
- 31.Wilkins D.K., Grimshaw S.B., Receveur Vé., Dobson C.M., Jones J.A., Smith L.J. Hydrodynamic radii of native and denatured proteins measured by pulse field gradient NMR techniques. Biochemistry (Mosc.) 1999;38:16424–16431. doi: 10.1021/bi991765q. [DOI] [PubMed] [Google Scholar]
- 32.Incicco J.J., Gebhard L.G., González-Lebrero R.M., Gamarnik A.V., Kaufman S.B. Steady-state NTPase activity of dengue virus NS3: number of catalytic sites, nucleotide specificity and activation by ssRNA. PLoS ONE. 2013;8:e58508. doi: 10.1371/journal.pone.0058508. [DOI] [PMC free article] [PubMed] [Google Scholar]
- 33.Lohman T.M., Bujalowski W. Thermodynamic methods for model-independent determination of equilibrium binding isotherms for protein-DNA interactions: spectroscopic approaches to monitor binding. Methods Enzymol. 1991;208:258–290. doi: 10.1016/0076-6879(91)08017-c. [DOI] [PubMed] [Google Scholar]
- 34.Jezewska M.J., Bujalowski W. A general method of analysis of ligand binding to competing macromolecules using the spectroscopic signal originating from a reference macromolecule. Application to Escherichia coli replicative helicase DnaB protein−nucleic acid interactions. Biochemistry (Mosc.) 1996;35:2117–2128. doi: 10.1021/bi952344l. [DOI] [PubMed] [Google Scholar]
- 35.Wong I., Lohman T.M. Linkage of protein assembly to protein-DNA binding. Methods Enzymol. 1995;259:95–127. doi: 10.1016/0076-6879(95)59040-4. [DOI] [PubMed] [Google Scholar]
- 36.Lohman T.M., Bjornson K.P. Mechanisms of helicase-catalyzed DNA unwinding. Annu. Rev. Biochem. 1996;65:169–214. doi: 10.1146/annurev.bi.65.070196.001125. [DOI] [PubMed] [Google Scholar]
- 37.Everhart C.H., Johnson C.S. Jr. The determination of tracer diffusion coefficients for proteins by means of pulsed field gradient NMR with applications to hemoglobin. J. Magn. Reson. 1982;48:466–474. [Google Scholar]
- 38.Callaghan P.T. Pulsed field gradient nuclear magnetic resonance as a probe of liquid state molecular organization. Aust. J. Phys. 1984;37:359–387. [Google Scholar]
- 39.Stilbs P. Fourier transform pulsed-gradient spin-echo studies of molecular diffusion. Prog. Nucl. Magn. Reson. Spectrosc. 1987;19:1–45. [Google Scholar]
- 40.Cohen Y., Avram L., Frish L. Diffusion NMR spectroscopy in supramolecular and combinatorial chemistry: an old parameter—new insights. Angew. Chem. Int. Ed. 2005;44:520–554. doi: 10.1002/anie.200300637. [DOI] [PubMed] [Google Scholar]
- 41.Khaki A.R., Field C., Malik S., Niedziela-Majka A., Leavitt S.A., Wang R., Hung M., Sakowicz R., Brendza K.M., Fischer C.J. The macroscopic rate of nucleic acid translocation by hepatitis C virus helicase NS3h is dependent on both sugar and base moieties. J. Mol. Biol. 2010;400:354–378. doi: 10.1016/j.jmb.2010.04.065. [DOI] [PMC free article] [PubMed] [Google Scholar]
- 42.Epstein I.R. Cooperative and non-cooperative binding of large ligands to a finite one-dimensional lattice. A model for ligand oligonucleotide interaction. Biophys. Chem. 1978;8:327–339. doi: 10.1016/0301-4622(78)80015-5. [DOI] [PubMed] [Google Scholar]
- 43.McGhee J.D., von Hippel P.H. Theoretical aspects of DNA-protein interactions: co-operative and non-co-operative binding of large ligands to a one-dimensional homogeneous lattice. J. Mol. Biol. 1974;86:469–489. doi: 10.1016/0022-2836(74)90031-x. [DOI] [PubMed] [Google Scholar]
- 44.Bujalowski W., Lohman T.M., Anderson C.F. On the cooperative binding of large ligands to a one-dimensional homogeneous lattice: the generalized three-state lattice model. Biopolymers. 1989;28:1637–1643. doi: 10.1002/bip.360280912. [DOI] [PubMed] [Google Scholar]
- 45.Fairman-Williams M.E., Guenther U.-P., Jankowsky E. SF1 and SF2 helicases: family matters. Curr. Opin. Struct. Biol. 2010;20:313–324. doi: 10.1016/j.sbi.2010.03.011. [DOI] [PMC free article] [PubMed] [Google Scholar]
- 46.Levin M.K., Patel S.S. Helicase from hepatitis C virus, energetics of DNA binding. J. Biol. Chem. 2002;277:29377–29385. doi: 10.1074/jbc.M112315200. [DOI] [PubMed] [Google Scholar]
- 47.Levin M.K., Wang Y.-H., Patel S.S. The functional interaction of the hepatitis C virus helicase molecules is responsible for unwinding processivity. J. Biol. Chem. 2004;279:26005–26012. doi: 10.1074/jbc.M403257200. [DOI] [PubMed] [Google Scholar]
- 48.Locatelli G.A., Spadari S., Maga G. Hepatitis C virus NS3 ATPase/helicase: an ATP switch regulates the cooperativity among the different substrate binding sites. Biochemistry (Mosc.) 2002;41:10332–10342. doi: 10.1021/bi026082g. [DOI] [PubMed] [Google Scholar]
- 49.Sikora B., Chen Y., Lichti C.F., Harrison M.K., Jennings T.A., Tang Y., Tackett A.J., Jordan J.B., Sakon J., Cameron C.E., et al. Hepatitis C virus NS3 helicase forms oligomeric structures that exhibit optimal DNA unwinding activity in vitro. J. Biol. Chem. 2008;283:11516–11525. doi: 10.1074/jbc.M708125200. [DOI] [PMC free article] [PubMed] [Google Scholar]
- 50.Feito MJ., Gómez-Gutiérrez J., Ayora S., Alonso J.C., Peterson D., Gavilanes F. Insights into the oligomerization state–helicase activity relationship of West Nile virus NS3 NTPase/helicase. Virus Res. 2008;135:166–174. doi: 10.1016/j.virusres.2008.03.008. [DOI] [PubMed] [Google Scholar]
- 51.Mastrangelo E., Milani M., Bollati M., Selisko B., Peyrane F., Pandini V., Sorrentino G., Canard B., Konarev P.V., Svergun D.I., et al. Crystal structure and activity of Kunjin virus NS3 helicase; protease and helicase domain assembly in the full length NS3 protein. J. Mol. Biol. 2007;372:444–455. doi: 10.1016/j.jmb.2007.06.055. [DOI] [PubMed] [Google Scholar]
- 52.Luo D., Xu T., Hunke C., Grüber G., Vasudevan S.G., Lescar J. Crystal structure of the NS3 protease-helicase from dengue virus. J. Virol. 2008;82:173–183. doi: 10.1128/JVI.01788-07. [DOI] [PMC free article] [PubMed] [Google Scholar]
- 53.Marsh J.A., Forman-Kay J.D. Sequence determinants of compaction in intrinsically disordered proteins. Biophys. J. 2010;98:2383–2390. doi: 10.1016/j.bpj.2010.02.006. [DOI] [PMC free article] [PubMed] [Google Scholar]
- 54.Ortega A., Amorós D., Garcia de La Torre J. Prediction of hydrodynamic and other solution properties of rigid proteins from atomic- and residue-level models. Biophys. J. 2011;101:892–898. doi: 10.1016/j.bpj.2011.06.046. [DOI] [PMC free article] [PubMed] [Google Scholar]
- 55.Fried M.G., Bromberg J.L. Factors that affect the stability of protein-DNA complexes during gel electrophoresis. Electrophoresis. 1997;18:6–11. doi: 10.1002/elps.1150180103. [DOI] [PubMed] [Google Scholar]
- 56.Bujalowski W. Thermodynamic and kinetic methods of analyses of protein-nucleic acid interactions. From simpler to more complex systems. Chem. Rev. 2006;106:556–606. doi: 10.1021/cr040462l. [DOI] [PubMed] [Google Scholar]
- 57.Kelly R.C., Jensen D.E., von Hippel P.H. DNA “melting” proteins. IV. Fluorescence measurements of binding parameters for bacteriophage T4 gene 32-protein to mono-, oligo-, and polynucleotides. J. Biol. Chem. 1976;251:7240–7250. [PubMed] [Google Scholar]
- 58.Runyon G.T., Wong I., Lohman T.M. Overexpression, purification, DNA binding, and dimerization of the Escherichia coli uvrD gene product (helicase II) Biochemistry (Mosc.) 1993;32:602–612. doi: 10.1021/bi00053a028. [DOI] [PubMed] [Google Scholar]
- 59.Jezewska M.J., Rajendran S., Bujalowski W. Escherichia coli replicative helicase PriA protein-single-stranded DNA complex. Stoichiometries, free energy of binding and cooperativities. J. Biol. Chem. 2000;275:27865–27873. doi: 10.1074/jbc.M004104200. [DOI] [PubMed] [Google Scholar]
- 60.Dou S.-X., Wang P.-Y., Xu H.Q., Xi X.G. The DNA binding properties of the Escherichia coli RecQ helicase. J. Biol. Chem. 2004;279:6354–6363. doi: 10.1074/jbc.M311272200. [DOI] [PubMed] [Google Scholar]
- 61.Jezewska M.J., Rajendran S., Bujalowski W. Interactions of the 8-kDa domain of rat DNA polymerase β with DNA. Biochemistry (Mosc.) 2001;40:3295–3307. doi: 10.1021/bi002749s. [DOI] [PubMed] [Google Scholar]
- 62.Szymanski M.R., Jezewska M.J., Bujalowski P.J., Bussetta C., Ye M., Choi K.H., Bujalowski W. Full-length dengue virus RNA-dependent RNA polymerase-RNA/DNA complexes. Stoichiometries, intrinsic affinities, cooperativities, base and conformational specificities. J. Biol. Chem. 2011;286:33095–33108. doi: 10.1074/jbc.M111.255034. [DOI] [PMC free article] [PubMed] [Google Scholar]
- 63.Petrovic A.G., Polavarapu P.L. Structural transitions in polyriboadenylic acid induced by the changes in pH and temperature: vibrational circular dichroism study in solution and film states. J. Phys. Chem. B. 2005;109:23698–23705. doi: 10.1021/jp054280m. [DOI] [PubMed] [Google Scholar]
- 64.Newby Lambert M., Vöcker E., Blumberg S., Redemann S., Gajraj A., Meiners J.-C., Walter N.G. Mg 2+-induced compaction of single RNA molecules monitored by tethered particle microscopy. Biophys. J. 2006;90:3672–3685. doi: 10.1529/biophysj.105.067793. [DOI] [PMC free article] [PubMed] [Google Scholar]
- 65.Freier S.M., Hill K., Dewey T., Marky L.A., Breslauer K.J., Turner D.H. Solvent effects on the kinetics and thermodynamics of stacking in poly (cytidylic acid) Biochemistry (Mosc.) 1981;20:1419–1426. doi: 10.1021/bi00509a003. [DOI] [PubMed] [Google Scholar]
- 66.Lohman T.M., Mascotti D.P. Thermodynamics of ligand-nucleic acid interactions. Methods Enzymol. 1992;212:400–424. doi: 10.1016/0076-6879(92)12026-m. [DOI] [PubMed] [Google Scholar]
Associated Data
This section collects any data citations, data availability statements, or supplementary materials included in this article.