


Abstract
Genome-wide distribution of histone H3K18 and H3K27 acetyltransferases, CBP (CREBBP) and p300 (EP300), is used to map enhancers and promoters, but whether these elements functionally require CBP/p300 remains largely uncertain. Here we compared global CBP recruitment with gene expression in wild-type and CBP/p300 double-knockout (dKO) fibroblasts. ChIP-seq using CBP-null cells as a control revealed nearby CBP recruitment for 20% of constitutively-expressed genes, but surprisingly, three-quarters of these genes were unaffected or slightly activated in dKO cells. Computationally defined enhancer-promoter-units (EPUs) having a CBP peak near the enhancer-like element were more predictive, with CBP/p300 deletion attenuating expression of 40% of such constitutively-expressed genes. Examining signal-responsive (Hypoxia Inducible Factor) genes showed that 97% were within 50 kilobases of an inducible CBP peak, and 70% of these required CBP/p300 for full induction. Unexpectedly, most inducible CBP peaks occurred near signal-nonresponsive genes. Finally, single-cell expression analysis revealed additional context dependence where some signal-responsive genes were not uniformly dependent on CBP/p300 in individual cells. While CBP/p300 was needed for full induction of some genes in single-cells, for other genes CBP/p300 increased the probability of maximal expression. Thus, target gene context influences the transcriptional requirement for CBP/p300, possibly by multiple mechanisms.
INTRODUCTION
Only 1.5% of the human genome encodes proteins (1), while most non-coding regions lack annotation for transcriptional regulatory elements and are often not analyzed by genomic sequencing studies. Helping to illuminate this area, the ENCODE project has found evidence for more than 399 000 enhancer-like and 70 000 promoter-like elements (2). This puts human genetic studies in a new frame of reference, and suggests non-coding mutations that cause disease will remain underappreciated until transcriptional regulatory elements are located and the ability to predict their activity improves (i.e. knowing what, when, where, and how they regulate).
Currently, genomic approaches to identify enhancer/promoter associations with their target genes involve correlating gene expression with various enhancer-associated entities such as: DNA sequence motifs, recruited transcriptional regulatory proteins and non-coding RNAs, nucleosome position and packing, long-range chromatin and gene interactions, and modifications of DNA and histones (3). Although very useful for annotating non-coding loci, such approaches yield primarily correlative data that may not reflect functional requirement. Indeed, establishing functional relevance is especially problematic for histone modifications since analysis of histone mutants is typically not feasible in mammals; such studies carried out in yeast have revealed surprisingly modest or specific phenotypes for many N-terminal histone mutants (4–13) (reviewed in Bedford et al. (14)). Studies that examine the location/functional association of enhancer-correlated histone acetyltransferases on a genome-wide scale in mammalian cells have not been carried out so far, but should help elucidate this correlation/causation conundrum.
The closely related KAT3 histone/lysine acetyltransferase (HAT or KAT) coactivators, CBP (CREBBP) and p300 (EP300) (collectively CBP/p300) are reported to interact with more than 400 different proteins (15). In mouse embryonic fibroblasts (MEFs), CBP and p300 are essential for more than 90% of the acetylation found on lysines 18 and 27 in the tail of histone H3 (16,17). H3K27ac in particular is strongly correlated with active enhancers and promoters (18–20). Beyond their roles in histone and protein acetylation, CBP and p300 have also been proposed to coactivate transcription by enhancing elongation (21) and to function as adaptors between transcription factors and the basal transcriptional machinery, including Pol II (22–26). Consequently, CBP/p300 recruitment is often interpreted as causing a positive effect on transcription, typically via histone acetylation, however CBP and p300 have sometimes also been associated with repression (14,15,27).
These traits implicate CBP and p300 broadly in transcriptional regulation and multiple studies have focused on them as proxies to locate promoter-proximal and enhancer elements (28–32). Other regulatory element mapping studies have performed chromatin immunoprecipitation (ChIP)-seq for p300 or CBP in conjunction with H3K27ac and other chromatin associated marks (18,19,29,33–37). Yet, despite the utility of CBP and p300 for locating enhancers and promoter-proximal elements, their function at these regulatory regions remains largely unknown and uncertain (15,16,38–42).
For the first time, we report the use of ChIP-seq with both wild-type (WT) and CBP null cells to rigorously identify genomic sites of CBP recruitment. Under conditions of constitutive-growth and signaling (hypoxia mimetic) regimens, this information was compared to gene expression for both bulk cultures and single cells using a unique cell system where CBP and p300 are both deleted (16,39). Our findings show that CBP and p300 are important for the expression of many, but not all genes near sites of CBP recruitment. However, CBP/p300 function does not follow a straightforward rule, and target gene context (i.e. which gene and which individual cell) is important.
MATERIALS AND METHODS
Culture and treatment of mouse embryonic fibroblasts (MEFs)
Independent isolates of primary CBP/p300 dKO MEFs were generated as previously described (16). Briefly, CBPflox/flox;p300flox/flox embryos homozygous for Cre-LoxP conditional alleles of both CBP and p300 were harvested at e14.5 to produce MEFs that were maintained under 3% oxygen to delay the onset of senescence (43). MEFs were placed in a normoxia incubator 24 h before treatment with 100 μm 2,2′dipyridyl (DP, a hypoxia mimetic, Sigma D-7505). MEFs were infected with adenovirus expressing Cre recombinase (MOI 100) for 16 h and all experiments (ChIP, RNA and acid extraction of histones) were performed 4 days after Cre viral transduction. Deletion of CBP and p300 was confirmed by semi-quantitative genomic polymerase chain reaction (PCR), immunofluorescence (IF) and western blot.
Chromatin immunoprecipitation (ChIP) and ChIP-seq
ChIP assays were carried out as described previously (40). Briefly, primary MEFs were incubated for 20 min in 3% formaldehyde in phosphate buffered saline at room temperature (efficient crosslinking of the non-DNA binding protein CBP requires increased fixation stringency compared with that needed for many transcription factors), the cells were lysed and the lysates sonicated five times for 10 s each at 15 microns in a Soniprep 150 (Sanyo). For ChIP and ChIP-seq experiments, MEFs were treated for 2 h with DP or ethanol vehicle. The generation of CBP and p300 antibodies used for ChIP was previously reported (16). Hypoxia Inducible Factor (HIF)-1α antibody was from Novus (Cat. # NB100–105). Pol II antibody CTD4H8 was from Santa Cruz. For ChIP-seq, ChIP was performed using our CBP antibody on WT and CBP null (CBPΔflox/Δflox;p300+/+) MEFs. Chromatin was prepared and amplified as described in the Illumina ChIP-seq protocol and sequenced on an Illumina Solexa sequencer. Reads were mapped to the mouse genome build mm9 using BWA 0.5.9 (44) and filtered by removing duplicate reads as well as those with alignment quality score of <1. Total, mapped and finally used read counts for all samples are summarized in Supplementary Table S12. Data from biological replicates (independent MEF isolates) were pooled and peaks were called using MACS 1.4.2 (Model-based Analysis of ChIP-seq) software (45) with P-value cutoff of 1E-5. Peaks from an individual replicate were also called using the same cutoff and used as support, as shown in Supplementary Tables S1 and S7. Constitutive CBP peaks were identified by comparing WT E (ethanol vehicle) with CBP null E (paired calling), with dynamic parameter λlocal estimated from 1 or 10 kb window centered at the peak location in CBP null E sample. Because CBP-binding was also observed in the CBP null cells, λlocal can be overestimated from the control sample for local chromatin bias and additional peaks were called using λlocal estimated from 10 kb window of WT E sample only (single calling). All peaks required a ratio of peak scores WT E/CBP null E ≥ 2. The peak scores were defined as the maximum average coverage of each 40 bp window within 500 bp of the peak summit, instead of using read pileup at the peak summit, which is single base, or read per kilobase peak region per million reads (RPKM) which can be affected by peak size. A similar approach was applied to identify DP-inducible CBP peaks, by comparing WT DP with CBP null DP (paired calling) or WT DP with surrounding region (single calling). DP inducible peaks were defined as having a ratio of WT DP/WT EtOH ≥ 1.7 and a ratio of WT DP/CBP null DP ≥ 2. ChIP-seq results were viewed using the Integrative Genomics Viewer (IGV) 2.2 (46,47). Comparisons with the MEF enhancers defined by Shen et al. (36) used the enhancer locations and gene associations provided in Shen et al. Supplementary Table S7. CBP constitutive peaks from our study that were within 2 kb of the MEF predicted enhancers reported by Shen et al. were considered to be associated. We chose the 2 kb distance because published data (Supplementary Figure S15 in Shen et al.) shows that nearly 80% of p300 binding sites are within 2 kb of a predicted enhancer (36).
Indirect immunofluorescence
MEFs were seeded on glass slides 3 days after treatment with Cre-expressing adenovirus and grown overnight. The following day the cells were fixed, permeabilized and stained as previously described (16). CBP N-terminal (A-22), C-terminal (C-20) and p300 N-terminal (N-20) and C-terminal (C-20) antibodies used for IF were from Santa Cruz. Anti-rabbit CY3 secondary antibody was from Jackson Immunologicals (Cat # 711-165-152).
Acid extraction of histones and histone antibodies
Acid extraction of histones was performed as described in Shechter et al. (48). Briefly, cells were pelleted, resuspended in a hypotonic lysis buffer and ruptured by swelling and mechanical shearing. The intact nuclei were pelleted and resuspended in 0.4 N sulfuric acid after which the nuclear debris was pelleted leaving the histones in the acidic supernatant. The histones were then precipitated with tricloroacetic acid and washed with ice cold acetone before being dissolved in distilled water. The histones were quantitated, run on a 15% sodium dodecylsulphate-polyacrylamide gel electrophoresis and blotted on nitrocellulose membrane. Antibodies against H3K27ac and H3K18ac were from Diagenode (Cat # C15410196, Lot # A1723-0041D) and Abcam (Cat # ab1191, Lot # 940498).
Standard qRT-PCR and microarrays
MEFs were treated for 3 h with the hypoxia-mimetic 100 μm 2,2′-DP (Sigma D7505) or ethanol vehicle (treatment times for timecourse experiment in Figure 6 were as indicated). We chose a relatively short DP treatment time to increase the likelihood that induced genes would be direct transcriptional targets of HIF. For multi-cell cultures, RNA was made using Trizol (Invitrogen). RNA was quantified on a NanoDrop 8000 (Thermo Scientific) and 100 ng per reaction was reverse-transcribed using SuperScript II (Invitrogen). qRT-PCR was performed using primers designed by our lab (sequences available on request) and QuantiTect SYBR Master Mix (Qiagen) or Taqman Gene Expression Assays (Applied Biosystems) and QuantiTect Probe Master Mix (Qiagen) on an Opticon (MJ Research) or CFX Connect (Bio Rad) real time PCR instrument. Microarray experiments used the Affymetrix HT MG-430 PM Array. Biotinylated cRNA was prepared according to the standard Affymetrix 3′ IVT Express protocol starting with 100 ng of total RNA (GeneChip 3′ IVT Express Kit 702646 Rev. 8, 2008–2010, Affymetrix). Following fragmentation, 5 μg of cRNA was hybridized for 16 h at 45°C on each array. GeneChips were washed, stained and scanned in the Affymetrix GeneTitan system. Probe signals were quantile normalized and summarized by the RMA algorithm using the Affymetrix Expression Console Software v1.1. Microarray data were further analyzed using Spotfire software (TIBCO).
Figure 6.
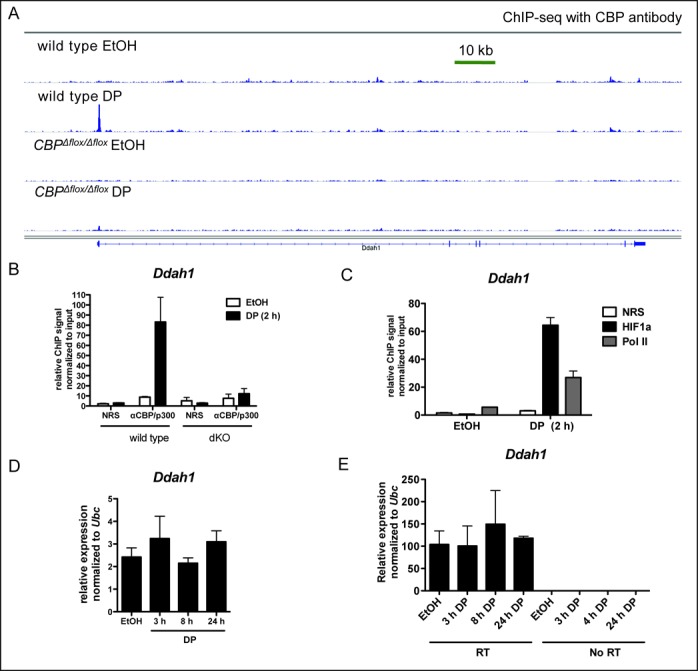
CBP recruitment does not guarantee induction of HIF target genes. (A) IGV browser views of CBP ChIP-seq data showing DP-inducible recruitment of CBP to the promoter of Ddah1 in mouse embryonic fibroblasts (MEFs). CBPΔflox/Δflox MEFs provide a negative control for the CBP antibody used. Read height for each track set to 150. (B) ChIP with pooled antibodies against CBP and p300 or normal rabbit serum (NRS) control at Ddah1 promoter in WT and CBPΔflox/Δflox;p300Δflox/Δflox (dKO) MEFs. (C) ChIP of HIF1α and Pol II at Ddah1 promoter in WT MEFs. (D) qRT-PCR of Ddah1 message in WT MEFs treated with DP for 3, 8 and 24 h. No statistical differences were found by one-way ANOVA with Tukey pairwise post tests. (E) qRT-PCR primary transcript analysis of Ddah1 unspliced primary transcript in WT MEFs. DNaseI-treated samples were prepared with and without reverse transcription (RT) as a control for potential genomic DNA contamination. No statistical differences were found by one-way ANOVA with Tukey pairwise post tests of reverse transcribed samples.
Single cell real time RT-PCR and RNA standards
WT and CBP/p300 dKO MEFs that also contain an eYFP reporter transgene that was expressed after Cre-mediated recombination (49) were treated with Cre-expressing adenovirus overnight to recombine the floxed alleles. Three days after exposure to Cre, the cells were serum-starved overnight, treated 3 h with 100 μm DP, then trypsinized and individual eYFP+ cells were sorted using a BD Biosciences Aria into individual wells of a 96-well plate each containing 4.5 μl Resuspension Buffer, 0.45 μl Lysis Enhancer (both from CellsDirect One-Step qRT-PCR Kit (Invitrogen)) and 0.1 μl RNAsin (Promega) and frozen until use. Reverse transcription (RT) and amplification of single cell RNA was carried out using a modification of the CellsDirect One-Step qRT-PCR Kit protocol and the protocol described by Dalerba et al. (50). Briefly, Taqman Gene Expression Assays (Applied Biosystems) for the genes of interest were diluted 1:100 in a mixture and 2.5 μl was added to each single cell well plus 5 μl of CellsDirect 2x Reaction Mix. Wells were heated to 90°C for 1 min in a PCR machine then the temperature was ramped slowly to 50°C at 0.1°C per second. Five microlitre 2x Reaction Mix and 1 μl Superscript III/Platinum Taq Mix was added to each well and RT was carried out for 20 min at 50°C, then wells were heated 2 min at 95°C followed by 20 cycles of preamplification 15 s 95°C, 4 min 60°C. Thirty microliter of DNase-free water was added to each well and 2 μl of each reaction was used for a subsequent 30 cycles of qPCR amplification (15 s 95°C, 1 min 60°C) and real time detection (CFX Connect, Bio Rad) with the separate individual Taqman Gene Expression Assays, and Quantitech Probe PCR Mastermix (Qiagen). RNA standards were produced by cloning relevant PCR products amplified from cDNA generated from DP-treated MEFs into pcDNA3 (Invitrogen) using the In-Fusion cloning system (Clontech) and in vitro transcribing and purifying RNA using MEGAscript and MEGAclear kits (Applied Biosystems). In vitro transcribed RNA was checked for size and degradation on an Agilent Bioanalyser and quantified on a NanoDrop 8000 (Thermo Scientific). The number of molecules per ng of RNA was determined using the RNA length and base composition. Appropriately diluted RNA standards were reverse transcribed and amplified as described for single cells.
Data access
Sequencing and microarray data from this study have been submitted to the NCBI Gene Expression Omnibus (GEO) and are listed as reference series GSE54454. ChIP-seq data files are subseries GSE54453. Microarray data files are subseries GSE54452.
RESULTS
ChIP-seq of CBP in wild-type MEFs and control MEFs lacking CBP
To relate CBP genomic distribution to CBP/p300 function, we first performed CBP chromatin immunoprecipitation followed by massively parallel DNA sequencing (ChIP-seq) using both WT and CBP null (CBPΔflox/Δflox;p300+/+) MEFs (Supplementary Figure S1A). The MEFs lacking CBP provide an excellent control for CBP antibody specificity. These ChIP-seq data were paired with gene expression from WT and CBP/p300 double knockout (dKO) MEFs. These primary MEFs (reported previously in (16)) bear conditional knockout alleles of CBP and p300 (CBPflox and p300flox) and were treated with adenovirus expressing Cre recombinase to produce dKO (CBPΔflox/Δflox;p300Δflox/Δflox) MEFs lacking CBP and p300. qRT-PCR and genomic DNA PCR have showed that the conditional alleles delete efficiently, and western blot, IF, and ChIP have confirmed that dKO cells have little or no detectable CBP or p300 protein (16). We further verified the absence of full length or truncated CBP and p300 in dKO MEFs by IF using individual antibodies raised against either the amino- or carboxy-terminus of CBP or p300 (Supplementary Figure S1B and C). Western blot showed that dKO MEFs lack appreciable acetylation of H3K18 or H3K27, confirming the >90% reduction of these modifications previously shown by western blot and mass spec analyses (16,17) (Figure 1).
Figure 1.

Acetylation of both H3K27 and H3K18 is strongly decreased in CBP/p300 dKO MEFs. (A) Coomassie Blue stain of acid extracted histones from wild-type (WT) and CBPΔflox/Δflox;p300Δflox/Δflox (dKO) MEFs. Histone positions and marker sizes indicated. Amount of histones loaded for Coomassie staining was the same as for the western blots shown in (B) and (C). (B and C) Western blots of acid extracted histones probed with antibodies against H3K27ac (B) and H3K18ac (C). (A–C) were run on the same gel.
Distance to nearest constitutive CBP peak fails to predict target gene CBP/p300 transcriptional dependence
Analysis of CBP ChIP-seq data from WT MEFs using MACS (Model based analysis for ChIP-seq) software identified 16 926 CBP peaks that were ≥2-fold above the background defined in control CBP null MEFs (Figure 2A, Supplementary Table S1). Forty-five percent of these CBP peaks were located more than 50 kb from any known gene promoter and only 15% were located within 2.5 kb of a transcriptional start site (Figure 2A). We assessed expression for genes where the TSS was within 2.5 kb of the nearest CBP peak, but surprisingly, out of 2132 microarray-represented expressed genes meeting this criteria, only 495 (23.2%) were reduced 20% or more in dKO MEFs (Figure 2B, Supplementary Table S2). Most genes close to a constitutive CBP peak showed no change or a slight increase in expression in dKO MEFs (Figure 2B). Genes for which the closest CBP peak was more distant from the TSS showed similar patterns of dependence on CBP/p300 as genes with a more proximal CBP peak (Figure 2C, 2.5–25 kb; 2D, 25–50 kb and 2E, more than 50 kb from TSS to nearest CBP peak, see also Supplementary Table S2). Together these data suggest that distance to the nearest CBP peak alone is a relatively poor predictor of gene expression requirement for CBP and p300, and that a large number of genes may be mildly repressed by CBP and p300.
Figure 2.
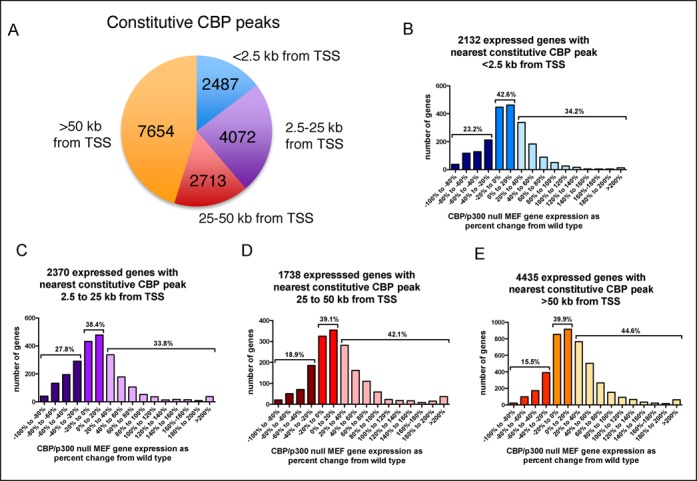
The impact of CBP/p300 on gene expression is minimally affected by distance from a gene TSS to the nearest constitutive CBP peaks. (A) Location of constitutive CBP peaks relative to closest gene transcriptional start sites (TSS). (B–E) Frequency distribution of the CBP/p300 dependence of expressed genes with a constitutive CBP peak (B) <2.5 kb (C) 2.5–25 kb (D) 25–50 kb or (E) >50 kb from the TSS. For B–E, gene expression measured by microarray is reported as the percent change in expression of CBP/p300 dKO MEFs from WT MEFs. Only probesets that were at least 2-fold above background in all WT and dKO samples (n = 3 each) were included and different probesets for the same gene were averaged.
Gene up-regulation in dKO cells could be due to loss of CBP/p300 repressive activity, increased availability of transcriptional co-factors when other genes are down-regulated, or increased expression of non-CBP/p300 coactivators (as seen with the CREB coactivator CTRC in dKO MEFs (16)). Indeed, transient assays using reporter plasmids and ectopically expressed proteins previously showed that p300 has repressor activity in particular contexts (51,52). Endogenous Myb-responsive genes also appear to require an interaction with CBP/p300 for either activation or repression (27,53). The use of dKO cells here further suggests that a surprisingly large percentage of constitutively expressed endogenous genes might be moderately repressed by CBP/p300.
TSS proximal CBP recruitment is less pronounced for the genes that most require CBP/p300 for expression
We next looked at the distribution of the CBP ChIP signal for genes with a CBP peak within 2.5 kb of the TSS (Figure 2B). In general, most of these genes showed the strongest CBP ChIP signal in the region very close to the TSS (Figure 3A, Supplementary Table S3). However, we observed that the CBP ChIP signal appeared weaker or more diffuse at genes with decreased expression in the absence of CBP/p300 (Figure 3A, left side; compare the profiles of CBP/p300 dependent genes at the top of the heatmap with those of genes that do not require CBP/p300 in the middle of the heatmap and those with increased expression in the absence of CBP/p300 at the bottom of the heatmap). A similar, but more muted pattern is seen in CBP ChIP of control CBP null MEFs (Figure 3A, right side). It is unlikely these diminished peaks are due entirely to residual CBP protein because recombination of the conditional CBP alleles was very efficient in this experiment (Supplementary Figure S1A), and CBP and p300 protein is not detectable by 2 days following recombination of the floxed alleles (16) (chromatin for the CBP ChIP-seq was harvested 4 days after recombination). Other possible explanations are some degree of antiserum crossreactivity (Supplementary Figure S1D shows a CBP western), or that these TSS proximal regions have higher background than the surrounding area because of open chromatin and/or the presence of many transcriptional machinery components.
Figure 3.
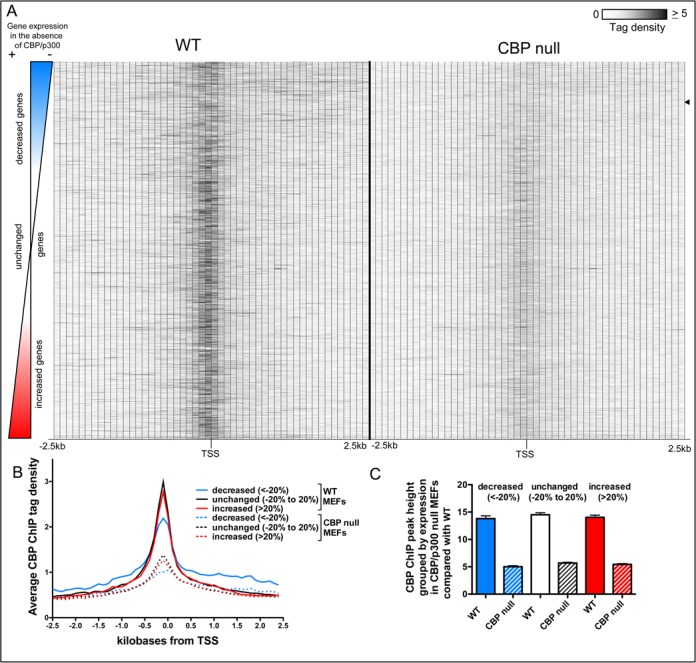
The average CBP chromatin immunoprecipitation (ChIP) signal around the TSS of constitutively expressed genes is lower for genes that require CBP/p300 for their expression. (A) Heatmap of average CBP ChIP tags in the 2.5 kb (100 bp bins) on either side of the TSS of constitutively expressed genes with a called CBP peak in the same region. Genes are ranked by the effect of CBP/p300 loss on their expression. Average CBP ChIP tags from both WT and control CBP null MEFs are shown. Black arrow indicates lower limit of genes decreased at least 50% in CBP/p300 dKO MEFs compared with WT. (B) Histograms of average density of CBP ChIP tags from WT (solid lines) and CBP null (dotted lines) MEFs in 100 bp bins in the 2.5 kb on either side of the TSS of constitutively expressed genes with a called CBP peak in the same region. Genes grouped by the effect of CBP/p300 loss upon their expression, decreased (blue lines, at least a 20% decrease in expression), unchanged (black lines, expression in dKO cells within 20% of expression in WT) and increased (red lines, more than a 20% increase in expression.) (C) Mean CBP ChIP peak height at center of the peak closest to the TSS for constitutively expressed genes having a called CBP peak within 2.5 kb of their TSS. Mean +/− 95% CI. Gene groupings the same as in (B).
We next generated histograms of the average CBP tag density in 100 bp bins of the 2.5 kb on either side of the TSS for genes grouped by the effect of CBP/p300 deletion on their expression. These histograms confirmed that genes with decreased expression in the absence of CBP/p300 demonstrate lower CBP ChIP tag density in the TSS proximal region (Figure 3B). To determine whether this group of CBP/p300 dependent genes had smaller peaks, we measured the mean height of the closest called CBP peak to the TSS for genes with a CBP peak within 2.5 kb of the TSS (Figure 3C). We found that the CBP peak heights did not differ significantly for genes that require CBP/p300 for their expression versus those that do not (Figure 3C, one way ANOVA with Tukey post test of CBP peak measurements in WT MEFs, mean +/− 95% CI). Instead, it appears that the CBP peaks for genes with decreased expression in the absence of CBP/p300 are less tightly clustered near the TSS. This interpretation is supported by the histogram analysis (Figure 3B). The shoulders of the histogram for genes with decreased expression in dKO MEFs are higher than the other histograms indicating increased CBP ChIP tag density more distal to the TSS and especially in the gene bodies (Figure 3B). Together these data indicate that increased recruitment of CBP close to the TSS is correlated with less dependence on CBP/p300 for gene expression.
Genes associated with enhancers that recruit CBP are more likely to be CBP/p300 dependent than genes without such enhancers
CBP and p300 are invaluable for locating gene distal regulatory elements, so we were not surprised to find that many constitutive CBP peaks were quite far from known gene TSSs (Figure 2A). However, determining which genes distal enhancers influence remains a challenge. We utilized the dataset of enhancer-promoter-units (EPUs) defined by Shen et al. that uses H3K27ac status among other criteria (36) to associate TSS distal constitutive CBP peaks with genes they might be regulating. Shen et al. defined 46 079 EPU enhancer-like elements in MEFs, and nearly 80% of recruitment sites they found for p300 (the CBP paralog) were within 2 kb of one of these predicted enhancers. Based upon this co-occurrence distance, we determined that 6467 of the MEF enhancers predicted by Shen et al. were within 2 kb of a constitutive CBP peak defined in our study (Figure 4A, Supplementary Table S4). Of the 6625 microarray-represented genes that were expressed in MEFs and reported by Shen et al. to be controlled by one or more MEF EPU enhancer-like elements, 2127 genes were associated with one or more EPU element that were within 2 kb of a constitutive CBP peak (Figure 4B, Supplementary Tables S4 and S5). We next examined the constitutive expression of genes associated with EPU enhancer-like elements within 2 kb of a constitutive CBP peak (Figure 4B), and those more than 2 kb from a peak (Figure 4C). About 40% of genes associated with an EPU element within 2 kb of a CBP peak showed decreased expression upon deletion of CBP and p300. However, the majority of genes associated with both EPU enhancer-like element classes (59.3% for those near CBP peaks and 83.5% for those more than 2 kb from CBP peaks) displayed >20% decrease in expression in the absence of CBP and p300 (Figure 4B and C). As with CBP recruitment near gene TSS (Figure 3C), there was no difference in the size of the CBP peaks at EPUs associated with genes showing decreased, unchanged or increased expression in the absence of CBP/p300 (Figure 4D, Supplementary Table S6).
Figure 4.
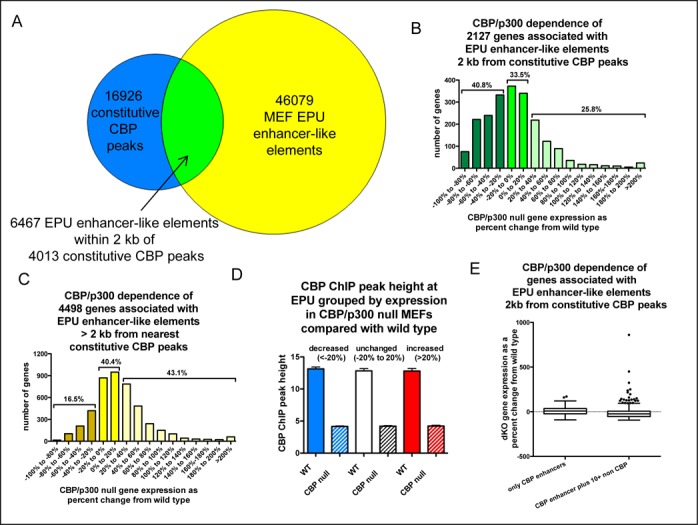
Genes computationally assigned to enhancer-like elements near constitutive CBP peaks are more likely to require CBP/p300 for their expression. (A) Venn diagram of constitutive CBP peaks defined in this study (small circle), enhancer promoter unit (EPU) enhancer-like elements defined in MEFs by Shen et al. (large circle) and constitutive CBP peaks that are within 2 kb of an EPU enhancer-like element (region of overlap). (B and C) Frequency distributions of CBP/p300 dependence of genes associated with EPU enhancer-like elements that are (B) ≤2 kb from a constitutive CBP peak or (C) >2 kb from a CBP constitutive CBP peak. (D) Average height of CBP peaks within 2 kb of EPUs grouped by the sensitivity to loss of CBP/p300 of the associated genes. Mean +/− 95% C.I. (E) Genes associated with 10 or more EPU-enhancer-like elements lacking a CBP peak do not generally show CBP/p300 independence compared to genes whose only enhancer-like elements recruit CBP. Box plot of CBP/p300 dependence of expression for genes from (B) associated with only EPU enhancer-like elements ≤2 kb from CBP constitutive peaks (n = 114) or additionally associated with at least 10 EPU enhancer-like elements >2 kb away from the nearest CBP constitutive peak (n = 840). For B–D, gene expression measured by microarray is reported as the percent change in expression of CBP/p300 dKO MEFs from WT MEFs. Only probesets that were at least 2-fold above background in all WT and dKO samples (n = 3 each) were included and duplicate probesets for the same gene were averaged. Venn diagram plotted with http://omics.pnl.gov/software/VennDiagramPlotter.php
Shen et al. showed that many genes are linked to multiple EPU enhancer-like elements (36). We therefore speculated that genes that were expressed in the absence of CBP/p300 and associated with EPU elements near CBP peaks might use other EPU elements that are distant from CBP peaks. Counterintuitively, we found that this was not the case. Genes with more than 10 EPU enhancer-like elements that were more than 2 kb from a CBP peak (in addition to at least one EPU element close to a CBP peak) were slightly more dependent on CBP/p300 on average for their expression than genes with only EPU elements that were near CBP peaks (Figure 4E, two-tailed t-test, P < 0.0001).
Signal-dependent CBP recruitment and gene expression in response to the hypoxia mimetic, 2,2′-dipyridyl
Examining a signal-dependent system provides two useful advantages. First, it simplifies analysis of the association between distal regulatory elements and gene expression. Second, it provides a mechanistic comparison to the results obtained for constitutive gene expression. To this end, we examined CBP recruitment and gene expression in response to the hypoxia mimetic 2,2′-DP, as CBP and p300 are well known coactivators of the HIF family of transcription factors (54,55).
The physiologically important CH1 domain of CBP and p300 (56) directly binds HIF1α through its C-terminal activation domain (57,58), and the interaction between CBP/p300 and HIF is modeled to play a critical role in hypoxia-inducible gene expression (55). Previously, we showed that CBP and p300 are strongly recruited to regulatory elements in response to HIF-inducing stimuli and that full induction of many, but not all, HIF-responsive genes requires the intact CH1 domain of CBP and p300 (41,42). To test this model on a genome-wide scale, we treated MEFs with DP and assessed CBP recruitment in WT and CBP null MEFs by ChIP-seq, and gene expression in WT and dKO MEFs by Affymetrix microarray.
Both promoters and enhancers recruit CBP in response to DP treatment
We found 2734 DP-inducible CBP peaks in WT MEFs that were ≥2-fold above the background in CBP null MEFs (Supplementary Table S7). Unlike constitutive CBP peaks, DP-inducible CBP peaks were more often located near gene promoters (43% were within 2.5 kb of a TSS, Figure 5A), but a sizeable fraction of inducible peaks (19%) were more than 50 kb away from any known gene TSS (Figure 5A). Frequency distributions of the DP-inducible CBP peaks in the 200 kb surrounding TSSs showed that they clustered near promoters (Figure 5B) with the highest frequency just 5′ of the TSS (Figure 5C).
Figure 5.

Dipyridyl (DP)-inducible CBP peaks are often near gene promoters and contain canonical hypoxia responsive elements (HREs), but are not reliable predictors of DP-inducible expression. (A) Location of DP-inducible CBP peaks relative to nearest gene TSS. (B and C) Distribution of DP-inducible CBP peaks located within 100 kb (B) or 1 kb (C) of the nearest gene (TSS). (D and E) Location of RCGTG HREs within 300 bases surrounding DP-inducible CBP peak summits including all HREs in the peak sequence (D) or only the centermost HRE in the peak (E). (F) Percentage of peaks containing RCGTG HREs broken down by distance from nearest TSS. (G) DP-inducibility of genes with a DP-inducible CBP peak within 2.5 kb of their TSS. WT DP gene expression shown as a percentage change from the uninduced (EtOH vehicle) WT gene expression. Percentages above the bars indicate the fraction of the 952 genes falling into each category.
Most DP inducible CBP peaks contain a canonical HRE
We next examined the sequences under DP-inducible CBP peaks for canonical hypoxia responsive elements (HREs, RCGTG, with R representing A or G), which are binding sites for HIF. We found that 90% (2471/2734) of the DP-inducible CBP peaks contained at least one RCGTG HRE in the 150 bases on either side of the peak summits (Supplementary Table S7). The frequency distribution of HREs shows clustering at the center of the peak for all HREs present in the sequence (Figure 5D), or if only the most central HRE is examined (Figure 5E). This is expected if CBP is recruited via HIF bound to an HRE, and suggests that DP-dependent CBP recruitment occurs primarily via HIF. TSS proximal and distal DP-inducible CBP peaks contained HREs at similar frequencies, although peaks that were within 2.5 kb of a TSS had a slightly higher incidence (Figure 5F, 94% compared with 87% for all other groups, two-sided t-test, P < 0.0002).
DP-dependent CBP recruitment near a gene promoter does not reliably predict induced gene expression
We next investigated the inducibility of genes that recruit CBP near their TSS in response to DP. Surprisingly, we found that of the 952 microarray-represented genes expressed in MEFs and having a DP-inducible CBP peak within 2.5 kb of the TSS, only 399 genes (41.9%) showed a signal increase of more than 20% in response to DP treatment (Figure 5G, Supplementary Table S8). For more than half of the genes with a DP-inducible CBP peak within 2.5 kb of the TSS (527/952), the DP-inducible expression value was within 20% of the uninduced expression value (the remaining 26 genes were repressed 20–60% by DP). We confirmed this finding for several genes including Ddah1 (Figure 6, see also Zfp653, Vps8 and Rnf7 in Supplementary Figure S2). The Ddah1 promoter displayed prodigious DP-dependent CBP recruitment in our ChIP-seq experiment (Figure 6A). We confirmed the DP-inducible recruitment of CBP and p300 by conventional ChIP, as well as the recruitment of HIF1α and Pol II at the same locus (Figure 6B and C). Ddah1 mRNA showed no increase at 3, 8 and 24 h following DP treatment by qRT-PCR for mature spliced mRNA (Figure 6D) or primary unspliced transcripts (Figure 6E). Unlike DP-inducible CBP recruitment to ‘poised’ regulatory elements at unexpressed genes like Epo (Supplementary Figure S3), MEFs express Ddah1 in the absence of DP (Figure 6E). Thus, the Ddah1 TSS region recruits CBP in response to DP (Figure 6A and B), as well as more Pol II (Figure 6C), but transcription does not increase (Figure 6D and E).
Inducible gene expression is a good indicator of nearby inducible CBP recruitment
The relatively poor correlation between DP-inducible CBP recruitment near a promoter and inducible expression of the gene surprised us. We next inverted the relationship by asking whether most DP-inducible genes are located near inducible CBP peaks. We looked at genes induced at least 2-fold by DP and with a known location in the mouse genome, and determined the distance to the inducible CBP peak that was closest to the TSS of each gene (Supplementary Table S9). We found that 79.3% (119/150) had a DP-inducible CBP peak within 2.5 kb of the TSS and most (89/150 or 59.3%) had such a peak within 500 bases of the TSS. Only five of the 150 genes (Cdk5r1, Flrt3, Klf10, Sik1 and Sox9) did not have a scored DP-inducible CBP ChIP-seq peak within 50 kb of their TSS. Close examination of these loci showed that three (Cdk5r1, Klf10 and Sox9) had very weak DP-inducible CBP peaks at their promoters that did not meet peak calling criteria (data not shown). Thus DP-inducible gene expression is a very good predictor of a nearby inducible CBP peak.
We next examined the expression of DP-inducible genes in dKO compared with WT MEFs (Figure 7, Supplementary Table S10). Similar to what we had seen for mutation of just the CH1 domain of CBP and p300 (41,42), the expression of many, but not all, DP-inducible genes were decreased in dKO compared with WT MEFs (Figure 7A). While expression of 43.3% of DP-inducible genes was reduced 50% or more by the loss of CBP and p300, more than a quarter were decreased <20%, including a few whose expression increased (Figure 7B). Indeed, even narrowing our focus to HIF target genes defined in previous studies (59–61), it was clear that loss of CBP/p300 did not affect all HIF targets equally and that some were quite unaffected (Figure 7A, filled dots in scatterplot, Supplementary Table S10).
Figure 7.

HIF target genes differ in their dependence on CBP and p300 for expression. Affymetrix microarray data from WT and CBPΔflox/Δflox;p300Δflox/Δflox (dKO) MEFs treated for 3 h with DP. (A) 324 probesets representing 210 genes that were upregulated at least 2-fold by DP. Filled dots indicate 74 probesets (45 genes) defined as HIF target genes in Schödel et al., Greijer et al. or Manalo et al.(59–61) Affymetrix signal is expressed as log2 values. (B) dKO DP expression for the 210 DP inducible genes from (A) expressed as the percent change from WT DP. Multiple probesets for the same gene were averaged. (A and B) All data shown are the average of three independent MEF isolates for each genotype. Probesets included in analyses were not below 2-fold above background (3.9) for all WT DP samples and were at least 2-fold induced by DP in all three WT MEFs.
The proximity of DP-inducible CBP peaks to inducible gene TSS provides imperfect predictive value for the CBP/p300 dependence of gene expression
Since most DP-inducible genes have a nearby inducible CBP peak, we searched for characteristics of the peaks that could predict the CBP/p300 dependence of genes. First, we performed ChIP for HIF-1α, since decreased HIF recruitment at CBP/p300 dependent genes could explain their reduced expression in dKO MEFs. We found that while expression of Egln3, Slc2a1 and Pfkfb3 differs substantially in response to loss of CBP and p300 (Figure 8A-C), HIF-1α is recruited, along with CBP and p300 to sites near all of these genes in response to DP treatment (Figure 8E–G). Importantly, HIF-1α was recruited equivalently in WT and dKO MEFs for all three of these genes (Figure 8E–G), indicating that HIF-1α availability was not generally responsible for differences in their expression. While some genes we tested did appear to exhibit reduced HIF-1α recruitment in dKO compared with WT MEFs, this did not consistently correlate with a reduction in gene expression. This is shown for Higd1a (Figure 8H), which does not demonstrate significantly reduced expression (Figure 8D, WT DP versus dKO DP, two-tailed t-test, P = 0.51). This strongly suggests that changes in HIF-1α ChIP signal in dKO MEFs at some loci may stem from technical considerations, such as changes in protein/DNA cross-linking efficiency in the absence of CBP/p300, rather than actual changes in HIF recruitment. Taken together, these data demonstrate that for HIF-1α target genes, CBP/p300 recruitment does not necessarily equate with CBP/p300 requirement for gene expression.
Figure 8.
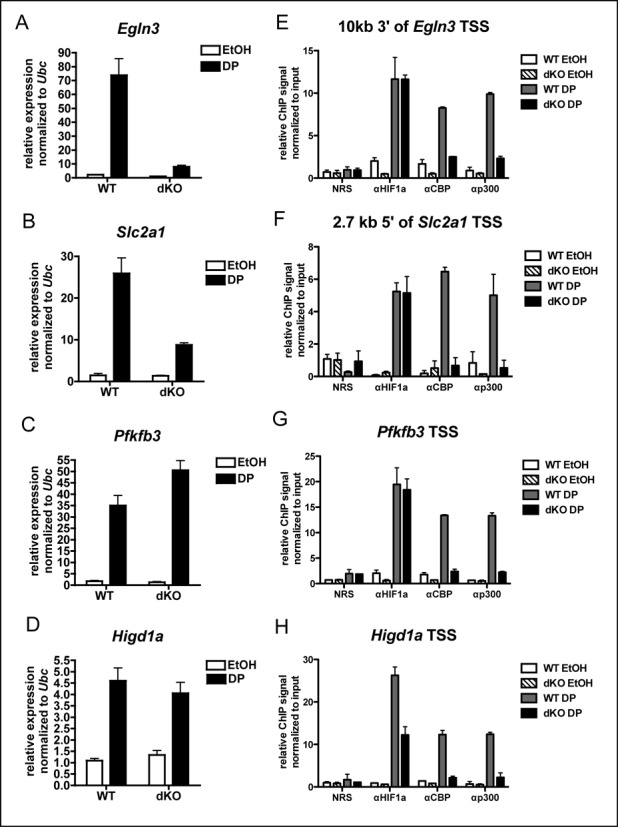
Differential HIF1α, CBP or p300 recruitment does not explain variable dependence on CBP and p300 for DP-inducible expression. (A–D) qRT-PCR on WT (n = 2) and CBPΔflox/Δflox;p300Δflox/Δflox (dKO, n = 3) MEFs treated for 3 h with DP or ethanol vehicle (EtOH, mean ± SEM). Expression between samples normalized to expression of Ubc. (E–H) ChIP using antibodies to proteins indicated (NRS is normal rabbit serum control) at hypoxia response elements located as indicated relative to gene TSS following 2 h treatment with DP. ChIP signals are normalized to the input signal for each sample. (n = 2, mean ± SEM).
We next evaluated whether the location of DP-inducible CBP recruitment relative to an inducible TSS correlated with gene expression dependence on CBP/p300. Based on our findings from constitutively expressed genes (Figure 3), we first analyzed the CBP ChIP tag density around the TSS of genes that were induced at least 2-fold by DP. As with constitutively expressed genes, DP inducible genes that required CBP/p300 for their full expression had a reduced TSS-proximal CBP ChIP tag density compared to genes with unchanged expression in the absence of CBP/p300 (Figure 9A, Supplementary Figure S4 and Table S11). However, unlike constitutively expressed genes, the TSS-proximal CBP ChIP tag density for genes with decreased expression in the absence of CBP/p300 was similar to that for genes with increased expression (Figure 9A). There was also a weak relationship between increased distance of the closest called DP-inducible CBP peak to the TSS (regardless of whether the peak was upstream or downstream of the TSS) and reduced expression in the absence of CBP and p300 (Figure 9B). We found no correlation between peak height and CBP/p300 gene dependence for the entire gene set (regardless of peak distance from the TSS (data not shown) or when we limited the analysis to genes with peaks within 2.5 kb of the TSS (Figure 9C). There also was no difference between the sequences flanking the HREs in DP-inducible CBP peaks associated with genes that showed decreased expression in the absence of CBP and p300 versus those that were unchanged or increased. There was, however, a hint that the peaks associated with genes having unchanged or increased expression in the absence of CBP and p300 occur in a somewhat more GC-rich environment (compare Figure 9D with E, also Supplementary Table S9). As we saw for constitutively expressed genes, genes that require CBP/p300 for their DP-inducible expression have less TSS proximal CBP recruitment than genes with unchanged expression in the absence of CBP/p300 (Figure 9A). However, DP-inducible genes for which CBP/p300 loss produces increased expression have similar levels of TSS proximal CBP recruitment as genes with decreased expression. Consequently, the function of TSS proximal CBP recruitment appears more complicated for DP-inducible genes than for constitutively expressed genes (however, statistically significant conclusions may be obscured because of the relatively small sample size of DP-inducible genes).
Figure 9.
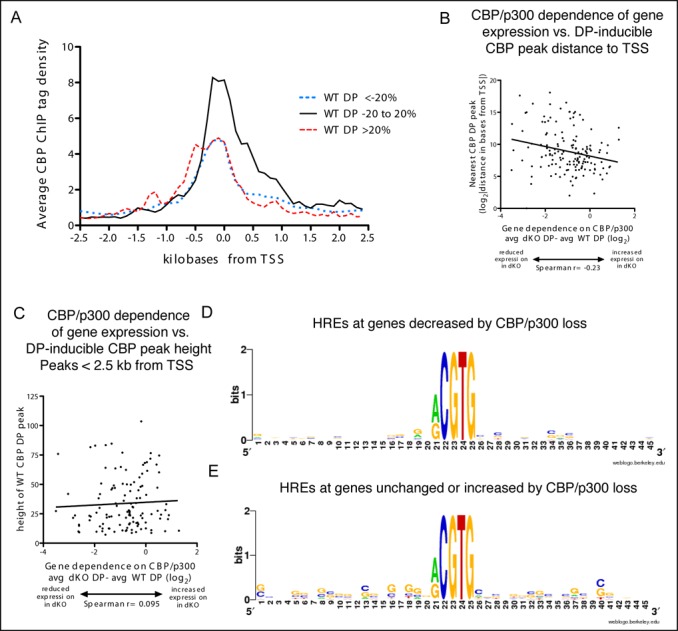
DP-inducible genes are usually located near DP-inducible CBP peaks, but their CBP/p300 dependence is poorly predicted by peak size or distance. (A) Histograms of average density of CBP ChIP tags in 100 bp bins in the 2.5 kb on either side of the TSS of DP-inducible genes with a called CBP peak in the same region. Genes grouped by the effect of CBP/p300 loss upon their induced expression, decreased (dotted line, at least a 20% decrease in expression), unchanged (solid line, expression in dKO cells within 20% of expression in WT) and increased (dashed line, more than a 20% increase in expression.) (B and C) Distance (B) or height (C) of the closest DP-inducible CBP peak to the TSS of genes induced at least 2-fold by DP. Distances in bases (B) were log2 transformed to reduce variance. Height analysis (C) includes 117 DP-inducible genes with a DP-inducible CBP peak <2.5 kb from TSS. CBP/p300 dependence expressed as the average (log2) expression in DP-treated CBPΔflox/Δflox;p300Δflox/Δflox (dKO) MEFs minus the average (log2) expression in DP-treated WT MEFs. A score of −1 represents a 50% decrease in dKO DP gene expression compared with WT DP, a score of 1 represents a 2-fold increase. (D and E) Sequence surrounding centermost RCGTG HREs from DP-inducible CBP peaks closest to TSS of genes decreased (D, avg dKO DP − avg WT DP < −1 log2) or unchanged or increased (E, avg dKO DP − avg WT DP > −0.15 log2) in the absence of CBP and p300. D and E generated using weblogo.berkeley.edu.
At the single-cell level, CBP and p300 influence gene expression by maximizing induction and/or increasing the odds of maximal induction
Most gene expression data, including that presented so far, represents the average across a population of cells. Transactivation models are thus typically based on bulk population data and assume uniform cell behavior (Figure 10A, scenario A). Nonetheless, previous studies of single cells have shown that this is sometimes not the case (Figure 10A, scenario B) (62–64), and little is known about CBP/p300 in this context. Moreover, understanding single cell behavior may provide insight into disease processes where CBP or p300 are mutated (e.g. increased phenotypic variation in a mutant cell population could allow some cells to survive drug treatment). We therefore examined CBP/p300-dependent coactivation in single cells to determine whether CBP/p300 uniformly increases gene expression in the population, or whether CBP/p300 influences the probability of expression.
Figure 10.
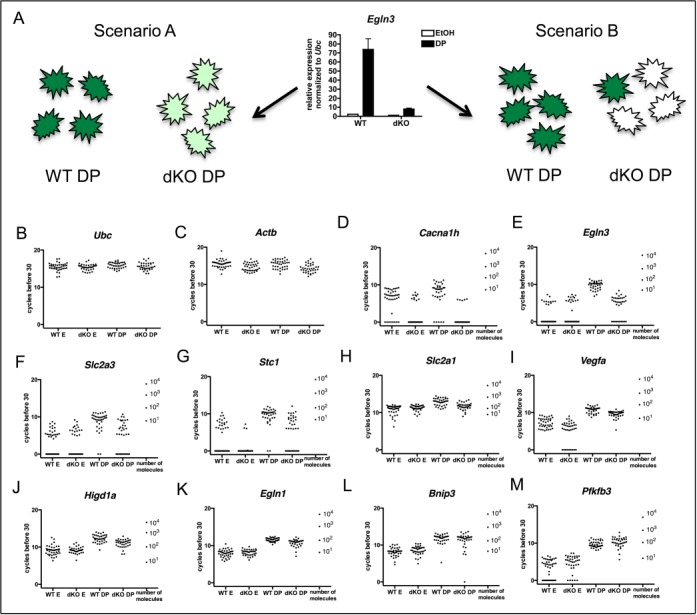
Individual CBP/p300 dKO cells display a range of expression of genes that require CBP and p300 for full expression in multi-cell cultures. (A) Model of two possible scenarios of expression in single cells that produce the same average result when looking at mRNA from cell populations. (B–M) mRNA expression in individual WT and dKO mouse embryonic fibroblast cells treated 3 h with DP or ethanol vehicle (E). (B,C) Housekeeping genes Ubc and Actb (note Actb expression shows some CBP/p300 dependence). (D-M) DP inducible genes. Number of mRNA molecules based on in vitro transcribed mRNA standards are given for each gene. WT E, n = 40; dKO E, n = 37; WT DP, n = 37 and dKO DP, n = 35.
To address these possibilities, we utilized WT and CBPflox/flox;p300flox/flox (dKO) MEFs that also contain a Cre recombinase responsive YFP reporter transgene. This allowed us to FACS purify single cells where Cre-mediated recombination has occurred (YFP+). Single cells were lysed and mRNA was reverse transcribed using gene-specific primers, then amplified, allowing expression of multiple genes to be examined in the same cell. We used the expression of two housekeeping genes, Ubc and Actb, to eliminate wells with degraded RNA or without a cell (Figure 10B and C).
We examined 10 genes shown to be DP-inducible by Affymetrix microarray analysis of RNA from bulk cells and that were associated with DP-inducible CBP peaks (Supplementary Figure S5 and Table S9) that display a range of dependence on CBP and p300 for their expression. We found that for Cacna1h, Egln3, Slc2a3 and Stc1, which are strongly dependent on CBP/p300 for their expression when measured in bulk populations, more dKO than WT DP-treated cells expressed undetectable mRNA levels (Figure 10D–G). However, for two of these genes, Slc2a3 and Stc1, the range of mRNA expression in WT and dKO DP-treated cells overlapped completely (Figure 10F and G). In contrast, for Cacna1h and Egln3, no dKO DP-treated cells achieved the highest levels of expression seen in WT DP-treated cells (Figure 10D and E). The CBP/p300-dependence of Slc2a3 and Stc1 is a uniform phenomenon only when averaged across a cell population; at the single cell level any given dKO DP-treated cell can express these genes as highly as any given WT DP-treated cell. Some genes with more limited requirement for CBP/p300 (Slc2a1, Vegfa, Higd1a and Egln1, Figure 10H–K) also showed evidence that the highest level of gene activation was not attained in the absence of CBP/p300, although these genes were induced in most cells with or without CBP/p300. These results suggest that CBP and p300 can act to increase the rate and/or probability of transcription, depending on target gene context.
The range of expression we measured between individual DP-treated WT cells was substantial (as much as ∼100-fold), but some genes, showed even greater variance amongst dKO cells (Figure 10, note especially panels K, L and M; variance values in Table 1). High variance in gene expression between seemingly homogeneous single cells has been reported in many studies (65). It has previously been hypothesized that changes to chromatin state caused by mutation of regulators like CBP and p300 might contribute to variability in gene expression (66,67). It is not clear, however, whether the increased variation in gene expression we see would affect cell phenotype.
Table 1. Variance of wild-type (WT) and CBPΔflox/Δflox;p300Δflox/Δflox (dKO) dipyridyl (DP) inducible gene expression in single cells shown in Figure 10.
| Gene symbol | Variance of WT DP cells | Variance of dKO DP cells |
|---|---|---|
| Bnip3 | 1.809 | 2.259 |
| Egln1 | 0.2557 | 0.9930 |
| Egln3 | 1.184 | 0.9107 |
| Higd1a | 1.055 | 1.173 |
| Pfkfb3 | 0.7344 | 1.971 |
| Slc2a1 | 0.8908 | 0.9594 |
| Slc2a3 | 2.211 | 3.154 |
| Stc1 | 1.362 | 3.014 |
| Vegfa | 0.7303 | 0.9827 |
Undetectable gene expression values were reassigned to 1 log2 unit less than the lowest detected value for the DP-induced expression of the gene (WT or dKO) for calculation of variance.
Interestingly, when we examined the expression of multiple genes in the same cell, we found that the four DP-inducible genes that are the most dependent on CBP/p300 in bulk cell populations (Cacna1h, Egln3, Slc2a3 and Stc1), were not uniformly regulated amongst individual dKO DP-treated cells lacking CBP and p300 (Figure 11). Pairwise comparisons between the expression of these genes in dKO cells showed at best a modest correlation (Table 2). We observed the gamut of expression patterns in dKO cells for these CBP/p300 dependent genes from all four expressed (Figure 11, dKO DP cells #10 and #30), to none detectable (dKO DP cells #23 and #24), as well as most combinations of one, two and three of the genes expressed. We confirmed that CBP and p300 are efficiently deleted in individual YFP+ dKO cells and thus are not the cause of the observed variation between cells (Supplementary Figure S6).
Figure 11.

Genes that require CBP and p300 for expression are not tightly co-regulated in individual CBP/p300 dKO cells. Stacked bar chart showing CBP/p300 dependent genes. Each bar represents gene expression in a WT or dKO cell treated for 3 h with DP. Absence of a gene from a bar indicates the mRNA was not detected in that cell. Real time PCR cycle data (shown in Figure 9) were adjusted for each gene so that in cells that did not amplify a product, the cycle was set to zero and the cell with the lowest non-zero cycle value for that gene was set to one. All other cells cycle values for the gene were adjusted so that they maintained the same relationship to the lowest non-zero cycle value [i.e. cycle value – (lowest non-zero cycle value – 1)].
Table 2. Pearson correlation coefficients for gene pairs measured in CBPΔflox/Δflox;p300Δflox/Δflox (dKO) dipyridyl (DP) treated single cells.
| Cacna1h | Egln3 | Slc2a3 | Stc1 | |
|---|---|---|---|---|
| Cacna1h | 1.0 | |||
| Egln3 | −0.1429 | 1.0 | ||
| Slc2a3 | 0.002806 | 0.3531 | 1.0 | |
| Stc1 | 0.03127 | 0.4812 | 0.4349 | 1.0 |
In summary, CBP is widely recruited in the genome in both constitutive and signaling-dependent settings. This study produced several novel insights. First, genome-wide analysis revealed that nearly all DP-inducible genes show DP-dependent recruitment of CBP to a nearby HRE. Second, genome-wide analysis also showed that some genes recruit CBP in a signal-dependent manner without a concomitant induction of gene expression (Figures 5, 6 and Supplementary Figure S2). Target gene context clearly influences the degree to which CBP and p300 are required for expression; however, the gene characteristics governing this phenomenon remain opaque. Third, our analysis of gene expression in individual cells (Figure 10) revealed novel patterns of CBP/p300 dependence that are not observable in bulk cell cultures. These observations suggest that the coactivation mechanisms provided by CBP and p300 for specific genes also appear to be context dependent and may affect both the rate and the probability of transcription.
DISCUSSION
This study demonstrates, on a genome-wide scale, that CBP recruitment is an imperfect indicator of gene expression that requires CBP and p300. Although CBP/p300 are clearly important for transcription on a broad scale, context has a major role in determining the extent and manner of CBP/p300-dependence for individual genes. In this regard, ‘context’ remains poorly defined, but may include characteristics of the target locus (e.g. DNA sequence), signaling pathway, and the individual cell. Thus, even if CBP (and p300) recruitment is highly correlated with enhancer- and promoter-element location, their presence alone is insufficient to predict a high degree of functional requirement.
Six conclusions related to gene ‘context’ in cell populations emerge from this study. First, among constitutively expressed genes with nearby CBP peaks, CBP recruitment to TSS-proximal locations tends to be weaker for genes with CBP/p300 dependent expression (Figure 3). Second, constitutively expressed genes computationally associated with a distal CBP peak were more likely to show CBP/p300 dependence than those with CBP recruitment within 2.5 kb of the TSS, but in both cases the majority of constitutive genes showed minimal or no CBP/p300 dependence (Figures 2 and 4). Third, CBP recruitment in response to the hypoxia mimetic DP was more often TSS-proximal than that seen for constitutive CBP peaks. Even so, less than half of the genes with inducible TSS-proximal CBP peaks showed inducible expression (Figure 5). Fourth, while almost all DP-inducible genes had nearby inducible CBP peaks, more than a quarter of inducible genes demonstrated little or no CBP/p300 dependence (Figure 7). Fifth, CBP/p300-dependent DP inducible genes had less TSS proximal CBP recruitment than unaffected genes. However, the picture is complicated by similar TSS proximal CBP ChIP signal between genes with decreased and increased expression in the absence of CBP/p300 (Figure 9). Sixth, no other features examined, including CBP peak size, HIF1α recruitment, or HRE sequence could predict gene expression dependent on CBP/p300 (Figures 8 and 9).
Single cell measurements of DP-inducible gene expression showed that genes requiring CBP/p300 for full induction in bulk cultures have unique expression patterns in individual cells and were not consistently co-regulated (Figure 11). Moreover, while some of these genes failed to attain full induction in any cell lacking CBP/p300, others could achieve maximal induction in CBP/p300 dKO cells, but at lower frequency than in WT cells (Figure 10). This suggests that CBP/p300 may act through different transcriptional mechanisms, depending on the target gene.
Mutation of CBP and p300 also has non-uniform effects on cAMP- dependent transcription
The non-uniform requirement for CBP and p300 displayed by constitutively-expressed and HIF-target genes is not unique. We previously reported similar effects on cAMP-responsive transcription in dKO MEFs (16) and in MEFs bearing point mutations in the KIX domain of CBP and p300 that decrease binding to the cAMP-responsive transcription factor, CREB (40). For CREB target genes, the coactivator CRTC2, which is not known to have acetyltransferase activity, can rescue the expression of some CBP/p300-dependent cAMP-responsive genes. Indeed, knockdown of CRTC2 reduced the expression of CBP/p300-independent CREB-targets (16) indicating that unrelated non-HAT coactivators can buffer the loss of the CBP/p300 HATs in some contexts.
Why is CBP recruited more widely that it is utilized?
Many genes that do not require CBP and p300 for their expression nonetheless recruit CBP proximal to their TSS or to computational associated enhancer-like elements (Figures 2–4). Possible explanations for this observation include: (i) Incorrect assignment of genes to regulatory elements; (ii) Recruitment of CBP/p300 by transcription factors bound to regulatory elements despite their utilization only in certain contexts (the so-called ‘toolbox’ analogy, where a worker takes a full toolbox to a job site but the nature of the job dictates which tools are actually used (14,15)); (iii) Compensation for the loss of CBP and p300 by other coactivators at some loci; (iv) Presence of CBP and p300 in the starting cells initiates a self propagated epigenetic state that continues and controls transcription of some genes once CBP and p300 are deleted (a similar notion is suggested in Chong et al. (68)); (v) CBP/p300 are recruited to provide target-locus functionality (which may not be transcriptional) under contexts that were not tested here (e.g. signaling, developmental, temporal).
The difficulty of correctly associating genes and their regulatory elements, especially ones located distally, makes it likely that misassignment will occur. However, genes computationally linked to EPU enhancer-like elements (36) that were within 2 kb of CBP peaks identified in our study were more likely to exhibit CBP/p300 dependence than genes with CBP recruitment events close to their TSS (where misassignment seems less likely, compare Figures 2B with 4B). In our study, the computational method of gene-regulatory element assignment created by Shen and colleagues outperformed proximity-based assignments for functional assessment.
For both CREB and HIF target genes, we have observed that CBP and p300 are recruited to genes that do not require them for their expression (Figures 7 and 8) (16). This suggests that some transcription factors may routinely recruit multiple coactivators, but which coactivation mechanisms are actually utilized is determined by the individual enhancer and/or promoter contexts (i.e. the ‘toolbox’ analogy). It is possible that CBP/p300 provide coactivation functions at CBP/p300-independent genes, but that in their absence, other coactivators can ‘buffer’ transcription and carry out these functions. Indeed, other mammalian coactivators for HIF have been described, although none but CBP/p300 are known to possess H3K18ac and H3K27ac activity (41,69–74). Regardless, both explanations call into question the function of H3K27ac at active regulatory elements, since CBP and p300 appear to be the primary and perhaps sole acetyltransferases to deposit this mark (17) (Figure 1B). In the absence of CBP/p300, many genes usually associated with H3K27ac-marked regulatory elements (the enhancer-like elements defined by Shen et al. (36)) are expressed normally. This reinforces the notion that H3K27ac is often correlative with active gene expression, rather than causative.
What is the target gene context that determines where CBP and p300 are required for full expression?
We did not identify a DNA sequence motif that correlated CBP recruitment in response to DP and the requirement of CBP and p300 for expression. However, we did find a relationship between lower density CBP recruitment proximal to the gene TSS and CBP/p300-dependence for both constitutively expressed (Figure 3) and DP-inducible genes (Figure 9 and Supplementary Figure S4). This is consistent with the ‘coactivator-rich, coactivator-poor’ hypothesis that we postulated previously to explain the highest recruitment of CBP and p300 by CREB target genes that required them least for their expression (14,16,39). In this model, CBP (or p300) recruitment are also proxy for the recruitment of other coactivators (including other HATs) at a gene locus; thus genes which recruit the most CBP/p300 are also the most buffered by the presence of other coactivators. It is also reasonable to hypothesize that some combinations of transcription factors and cofactors, or certain epigenetic marks, may counteract or override the requirement for CBP/p300. Previous studies in our lab using plasmids failed to faithfully recapitulate the requirement of different promoters for CBP/p300, and made it impossible to perform simple regulatory element mutagenesis studies (16). The plasmid-based results suggest that normal regulation of genes by CBP and p300 requires appropriate chromatin/chromosomal/nuclear context or larger sections of the genome.
Many factors may contribute to modest overlap between CBP recruitment and H3K27ac defined enhancer-like elements
We were surprised that only about 14% of the H3K27ac-associated enhancer-like elements in MEFs found by Shen et al. (36) were within 2 kb of a constitutive CBP peak in our study. Even allowing for differences in MEF strain backgrounds, growth conditions, and peak calling thresholds, the lack of overlap is substantial. Some of the CBP peaks we found may represent ‘poised’ enhancers (19), where CBP or p300 recruitment occurs without H3K27ac. It is also possible that some of the enhancer-like elements defined by Shen et al. (36) may recruit only p300, not CBP; however, a study comparing genome-wide CBP and p300 recruitment showed that they colocalize for most regions (75). Another intriguing possibility is that the H3K27ac mark is less transient than CBP and p300 recruitment, and thus shows where CBP and p300 have been, rather than only where they are. CBP and p300 may also acetylate histones over large distances through chromatin looping, suggesting that CBP or p300 recruitment and H3K27ac may mark different types of regulatory elements that are brought into proximity.
Effect of CBP/p300 loss on gene expression at the single cell level
Two models for how enhancers act have been put forward previously. The rate model posits that enhancers increase the rate of transcription at gene promoters. The probability model puts forward that enhancers improve the likelihood that a promoter will become transcriptionally active (76,77). In the rate model, a gene locus needs the enhancer activity to achieve maximal transcription, while in the probability model it does not. In order to distinguish between these models, gene expression must be measured in single cells.
Our analysis of single cells suggests that CBP and p300 can coactivate transcription by both of these mechanisms, depending on the gene context. Cacna1h and Egln3 required CBP and p300 for maximal induction in response to DP (Figure 10D and E), suggesting that CBP and p300 impact the transcriptional rate of these genes. For Slc2a3 and Stc1, CBP and p300 affected only the probability of transcription, since some individual dKO DP cells expressed these genes to the same level as WT DP cells (Figure 10F and G). CBP recruitment location did not obviously correlate with which of these two CBP/p300 coactivation mechanisms is utilized. For example, DP-inducible CBP recruitment occurred about 0.5 kb from the TSS for Cacna1h and Stc1, but was promoter distal for Egln3 (∼12 kb 3′ of the TSS in the first intron) and Slc2a3 (∼18.5 kb 5′ of the TSS).
Amongst individual cells, there was a tendency for greater gene expression variance when CBP/p300 was deficient (Table 1). This suggests a broader phenotypic landscape in the mutant population. It is interesting to speculate how coactivator gene mutations in general might thereby enhance population fitness, which could be advantageous to cancer cells (78–80). Indeed, mutations in epigenetic regulators, including CBP and p300, have been increasingly implicated in cancer (81). It will be useful to examine whether increased variation in gene expression is common to mutations in this class of proteins.
Histone H3K27 acetylation is extremely dependent on the related acetyltransferases, CBP and p300, and these three entities are increasingly used to map enhancer and promoter-proximal regulatory elements. In this study we asked what the functional connection was between genome-wide recruitment of CBP and gene expression. Surprisingly, we found that the majority of CBP recruitment events do not appear to stimulate nearby genes. Furthermore, single-cell analysis suggests that when CBP and p300 are required for expression, they can act by more than one transcriptional mechanism, depending on the target gene. These findings are significant as they reinforce the idea that correlation is not necessarily causation for these widely studied enhancer/promoter marks, and that individual cell and gene context needs to be considered when assessing transcriptional mechanisms.
SUPPLEMENTARY DATA
Supplementary data are available at NAR Online.
Acknowledgments
We thank Stephanie Lerach for excellent technical assistance. Thanks to the Vector Development and Production Core at SJCRH. The Hartwell Center at SJCRH provided oligonucleotides.
FUNDING
National Institutes of Health [R21 DE018183, R01 CA161202 to P.K.B.]; Cancer Center (CORE) support grant [P30 CA021765]; American Lebanese Syrian Associated Charities of St. Jude Children's Research Hospital. Funding for open access charge: St. Jude Children's Research Hospital.
Conflict of interest statement. None declared.
REFERENCES
- 1.Lander E.S., Linton L.M., Birren B., Nusbaum C., Zody M.C., Baldwin J., Devon K., Dewar K., Doyle M., FitzHugh W., et al. Initial sequencing and analysis of the human genome. Nature. 2001;409:860–921. doi: 10.1038/35057062. [DOI] [PubMed] [Google Scholar]
- 2.Dunham I., Kundaje A., Aldred S.F., Collins P.J., Davis C.A., Doyle F., Epstein C.B., Frietze S., Harrow J., Kaul R., et al. An integrated encyclopedia of DNA elements in the human genome. Nature. 2012;489:57–74. doi: 10.1038/nature11247. [DOI] [PMC free article] [PubMed] [Google Scholar]
- 3.Rivera C.M., Ren B. Mapping human epigenomes. Cell. 2013;155:39–55. doi: 10.1016/j.cell.2013.09.011. [DOI] [PMC free article] [PubMed] [Google Scholar]
- 4.Dai J., Hyland E.M., Yuan D.S., Huang H., Bader J.S., Boeke J.D. Probing nucleosome function: a highly versatile library of synthetic histone H3 and H4 mutants. Cell. 2008;134:1066–1078. doi: 10.1016/j.cell.2008.07.019. [DOI] [PMC free article] [PubMed] [Google Scholar]
- 5.Durrin L.K., Mann R.K., Kayne P.S., Grunstein M. Yeast histone H4 N-terminal sequence is required for promoter activation in vivo. Cell. 1991;65:1023–1031. doi: 10.1016/0092-8674(91)90554-c. [DOI] [PubMed] [Google Scholar]
- 6.Thompson J.S., Ling X., Grunstein M. Histone H3 amino terminus is required for telomeric and silent mating locus repression in yeast. Nature. 1994;369:245–247. doi: 10.1038/369245a0. [DOI] [PubMed] [Google Scholar]
- 7.Wallis J.W., Rykowski M., Grunstein M. Yeast histone H2B containing large amino terminus deletions can function in vivo. Cell. 1983;35:711–719. doi: 10.1016/0092-8674(83)90104-6. [DOI] [PubMed] [Google Scholar]
- 8.Kayne P.S., Kim U.J., Han M., Mullen J.R., Yoshizaki F., Grunstein M. Extremely conserved histone H4 N terminus is dispensable for growth but essential for repressing the silent mating loci in yeast. Cell. 1988;55:27–39. doi: 10.1016/0092-8674(88)90006-2. [DOI] [PubMed] [Google Scholar]
- 9.Parra M.A., Kerr D., Fahy D., Pouchnik D.J., Wyrick J.J. Deciphering the roles of the histone H2B N-terminal domain in genome-wide transcription. Mol. Cell. Biol. 2006;26:3842–3852. doi: 10.1128/MCB.26.10.3842-3852.2006. [DOI] [PMC free article] [PubMed] [Google Scholar]
- 10.Parra M.A., Wyrick J.J. Regulation of gene transcription by the histone H2A N-terminal domain. Mol. Cell. Biol. 2007;27:7641–7648. doi: 10.1128/MCB.00742-07. [DOI] [PMC free article] [PubMed] [Google Scholar]
- 11.Dion M.F., Altschuler S.J., Wu L.F., Rando O.J. Genomic characterization reveals a simple histone H4 acetylation code. Proc. Natl. Acad. Sci. U.S.A. 2005;102:5501–5506. doi: 10.1073/pnas.0500136102. [DOI] [PMC free article] [PubMed] [Google Scholar]
- 12.Martin A.M., Pouchnik D.J., Walker J.L., Wyrick J.J. Redundant roles for histone H3 N-terminal lysine residues in subtelomeric gene repression in Saccharomyces cerevisiae. Genetics. 2004;167:1123–1132. doi: 10.1534/genetics.104.026674. [DOI] [PMC free article] [PubMed] [Google Scholar]
- 13.Jin Y., Rodriguez A.M., Wyrick J.J. Genetic and genomewide analysis of simultaneous mutations in acetylated and methylated lysine residues in histone H3 in Saccharomyces cerevisiae. Genetics. 2009;181:461–472. doi: 10.1534/genetics.108.098897. [DOI] [PMC free article] [PubMed] [Google Scholar]
- 14.Bedford D.C., Brindle P.K. Is histone acetylation the most important physiological function for CBP and p300. Aging (Albany NY) 2012;4:247–255. doi: 10.18632/aging.100453. [DOI] [PMC free article] [PubMed] [Google Scholar]
- 15.Bedford D.C., Kasper L.H., Fukuyama T., Brindle P.K. Target gene context influences the transcriptional requirement for the KAT3 family of CBP and p300 histone acetyltransferases. Epigenetics. 2010;5:9–15. doi: 10.4161/epi.5.1.10449. [DOI] [PMC free article] [PubMed] [Google Scholar]
- 16.Kasper L.H., Lerach S., Wang J., Wu S., Jeevan T., Brindle P.K. CBP/p300 double null cells reveal effect of coactivator level and diversity on CREB transactivation. EMBO J. 2010;29:3660–3672. doi: 10.1038/emboj.2010.235. [DOI] [PMC free article] [PubMed] [Google Scholar]
- 17.Jin Q., Yu L.R., Wang L., Zhang Z., Kasper L.H., Lee J.E., Wang C., Brindle P.K., Dent S.Y., Ge K. Distinct roles of GCN5/PCAF-mediated H3K9ac and CBP/p300-mediated H3K18/27ac in nuclear receptor transactivation. EMBO J. 2011;30:249–262. doi: 10.1038/emboj.2010.318. [DOI] [PMC free article] [PubMed] [Google Scholar]
- 18.Creyghton M.P., Cheng A.W., Welstead G.G., Kooistra T., Carey B.W., Steine E.J., Hanna J., Lodato M.A., Frampton G.M., Sharp P.A., et al. Histone H3K27ac separates active from poised enhancers and predicts developmental state. Proc. Natl. Acad. Sci. U.S.A. 2010;107:21931–21936. doi: 10.1073/pnas.1016071107. [DOI] [PMC free article] [PubMed] [Google Scholar]
- 19.Rada-Iglesias A., Bajpai R., Swigut T., Brugmann S.A., Flynn R.A., Wysocka J. A unique chromatin signature uncovers early developmental enhancers in humans. Nature. 2011;470:279–283. doi: 10.1038/nature09692. [DOI] [PMC free article] [PubMed] [Google Scholar]
- 20.Heintzman N.D., Hon G.C., Hawkins R.D., Kheradpour P., Stark A., Harp L.F., Ye Z., Lee L.K., Stuart R.K., Ching C.W., et al. Histone modifications at human enhancers reflect global cell-type-specific gene expression. Nature. 2009;459:108–112. doi: 10.1038/nature07829. [DOI] [PMC free article] [PubMed] [Google Scholar]
- 21.Guermah M., Palhan V.B., Tackett A.J., Chait B.T., Roeder R.G. Synergistic functions of SII and p300 in productive activator-dependent transcription of chromatin templates. Cell. 2006;125:275–286. doi: 10.1016/j.cell.2006.01.055. [DOI] [PubMed] [Google Scholar]
- 22.Kee B.L., Arias J., Montminy M.R. Adaptor-mediated recruitment of RNA polymerase II to a signal- dependent activator. J. Biol. Chem. 1996;271:2373–2375. doi: 10.1074/jbc.271.5.2373. [DOI] [PubMed] [Google Scholar]
- 23.Nakajima T., Uchida C., Anderson S.F., Lee C.G., Hurwitz J., Parvin J.D., Montminy M. RNA helicase A mediates association of CBP with RNA polymerase II. Cell. 1997;90:1107–1112. doi: 10.1016/s0092-8674(00)80376-1. [DOI] [PubMed] [Google Scholar]
- 24.Nakajima T., Uchida C., Anderson S.F., Parvin J.D., Montminy M. Analysis of a cAMP-responsive activator reveals a two-component mechanism for transcriptional induction via signal-dependent factors. Genes Dev. 1997;11:738–747. doi: 10.1101/gad.11.6.738. [DOI] [PubMed] [Google Scholar]
- 25.Neish A.S., Anderson S.F., Schlegel B.P., Wei W., Parvin J.D. Factors associated with the mammalian RNA polymerase II holoenzyme. Nucleic Acids Res. 1998;26:847–853. doi: 10.1093/nar/26.3.847. [DOI] [PMC free article] [PubMed] [Google Scholar]
- 26.Cho H., Orphanides G., Sun X., Yang X.J., Ogryzko V., Lees E., Nakatani Y., Reinberg D. A human RNA polymerase II complex containing factors that modify chromatin structure. Mol. Cell. Biol. 1998;18:5355–5363. doi: 10.1128/mcb.18.9.5355. [DOI] [PMC free article] [PubMed] [Google Scholar]
- 27.Zhao L., Glazov E.A., Pattabiraman D.R., Al-Owaidi F., Zhang P., Brown M.A., Leo P.J., Gonda T.J. Integrated genome-wide chromatin occupancy and expression analyses identify key myeloid pro-differentiation transcription factors repressed by Myb. Nucleic Acids Res. 2011;39:4664–4679. doi: 10.1093/nar/gkr024. [DOI] [PMC free article] [PubMed] [Google Scholar]
- 28.Visel A., Blow M.J., Li Z., Zhang T., Akiyama J.A., Holt A., Plajzer-Frick I., Shoukry M., Wright C., Chen F., et al. ChIP-seq accurately predicts tissue-specific activity of enhancers. Nature. 2009;457:854–858. doi: 10.1038/nature07730. [DOI] [PMC free article] [PubMed] [Google Scholar]
- 29.Blow M.J., McCulley D.J., Li Z., Zhang T., Akiyama J.A., Holt A., Plajzer-Frick I., Shoukry M., Wright C., Chen F., et al. ChIP-Seq identification of weakly conserved heart enhancers. Nat. Genet. 2010;42:806–810. doi: 10.1038/ng.650. [DOI] [PMC free article] [PubMed] [Google Scholar]
- 30.Attanasio C., Nord A.S., Zhu Y., Blow M.J., Li Z., Liberton D.K., Morrison H., Plajzer-Frick I., Holt A., Hosseini R., et al. Fine tuning of craniofacial morphology by distant-acting enhancers. Science. 2013;342:1241006. doi: 10.1126/science.1241006. [DOI] [PMC free article] [PubMed] [Google Scholar]
- 31.Visel A., Taher L., Girgis H., May D., Golonzhka O., Hoch R.V., McKinsey G.L., Pattabiraman K., Silberberg S.N., Blow M.J., et al. A high-resolution enhancer atlas of the developing telencephalon. Cell. 2013;152:895–908. doi: 10.1016/j.cell.2012.12.041. [DOI] [PMC free article] [PubMed] [Google Scholar]
- 32.May D., Blow M.J., Kaplan T., McCulley D.J., Jensen B.C., Akiyama J.A., Holt A., Plajzer-Frick I., Shoukry M., Wright C., et al. Large-scale discovery of enhancers from human heart tissue. Nat. Genet. 2012;44:89–93. doi: 10.1038/ng.1006. [DOI] [PMC free article] [PubMed] [Google Scholar]
- 33.Heintzman N.D., Stuart R.K., Hon G., Fu Y., Ching C.W., Hawkins R.D., Barrera L.O., Van Calcar S., Qu C., Ching K.A., et al. Distinct and predictive chromatin signatures of transcriptional promoters and enhancers in the human genome. Nat. Genet. 2007;39:311–318. doi: 10.1038/ng1966. [DOI] [PubMed] [Google Scholar]
- 34.Kim T.K., Hemberg M., Gray J.M., Costa A.M., Bear D.M., Wu J., Harmin D.A., Laptewicz M., Barbara-Haley K., Kuersten S., et al. Widespread transcription at neuronal activity-regulated enhancers. Nature. 2010;465:182–187. doi: 10.1038/nature09033. [DOI] [PMC free article] [PubMed] [Google Scholar]
- 35.Schnetz M.P., Handoko L., Akhtar-Zaidi B., Bartels C.F., Pereira C.F., Fisher A.G., Adams D.J., Flicek P., Crawford G.E., Laframboise T., et al. CHD7 targets active gene enhancer elements to modulate ES cell-specific gene expression. PLoS Genet. 2010;6:e1001023. doi: 10.1371/journal.pgen.1001023. [DOI] [PMC free article] [PubMed] [Google Scholar]
- 36.Shen Y., Yue F., McCleary D.F., Ye Z., Edsall L., Kuan S., Wagner U., Dixon J., Lee L., Lobanenkov V.V., et al. A map of the cis-regulatory sequences in the mouse genome. Nature. 2012;488:116–120. doi: 10.1038/nature11243. [DOI] [PMC free article] [PubMed] [Google Scholar]
- 37.Zhang B., Day D.S., Ho J.W., Song L., Cao J., Christodoulou D., Seidman J.G., Crawford G.E., Park P.J., Pu W.T. A dynamic H3K27ac signature identifies VEGFA-stimulated endothelial enhancers and requires EP300 activity. Genome Res. 2013;23:917–927. doi: 10.1101/gr.149674.112. [DOI] [PMC free article] [PubMed] [Google Scholar]
- 38.Holmqvist P.H., Mannervik M. Genomic occupancy of the transcriptional co-activators p300 and CBP. Transcription. 2013;4:18–23. doi: 10.4161/trns.22601. [DOI] [PMC free article] [PubMed] [Google Scholar]
- 39.Kasper L.H., Thomas M.C., Zambetti G.P., Brindle P.K. Double null cells reveal that CBP and p300 are dispensable for p53 targets p21 and Mdm2 but variably required for target genes of other signaling pathways. Cell Cycle. 2011;10:212–221. doi: 10.4161/cc.10.2.14542. [DOI] [PMC free article] [PubMed] [Google Scholar]
- 40.Xu W., Kasper L.H., Lerach S., Jeevan T., Brindle P.K. Individual CREB-target genes dictate usage of distinct cAMP-responsive coactivation mechanisms. EMBO J. 2007;26:2890–2903. doi: 10.1038/sj.emboj.7601734. [DOI] [PMC free article] [PubMed] [Google Scholar]
- 41.Kasper L.H., Brindle P.K. Mammalian gene expression program resiliency: the roles of multiple coactivator mechanisms in hypoxia-responsive transcription. Cell Cycle. 2006;5:142–146. doi: 10.4161/cc.5.2.2353. [DOI] [PubMed] [Google Scholar]
- 42.Kasper L.H., Boussouar F., Boyd K., Xu W., Biesen M., Rehg J., Baudino T.A., Cleveland J.L., Brindle P.K. Two transactivation mechanisms cooperate for the bulk of HIF-1-responsive gene expression. EMBO J. 2005;24:3846–3858. doi: 10.1038/sj.emboj.7600846. [DOI] [PMC free article] [PubMed] [Google Scholar]
- 43.Parrinello S., Samper E., Krtolica A., Goldstein J., Melov S., Campisi J. Oxygen sensitivity severely limits the replicative lifespan of murine fibroblasts. Nat. Cell Biol. 2003;5:741–747. doi: 10.1038/ncb1024. [DOI] [PMC free article] [PubMed] [Google Scholar]
- 44.Li H., Durbin R. Fast and accurate short read alignment with Burrows-Wheeler transform. Bioinformatics. 2009;25:1754–1760. doi: 10.1093/bioinformatics/btp324. [DOI] [PMC free article] [PubMed] [Google Scholar]
- 45.Zhang Y., Liu T., Meyer C.A., Eeckhoute J., Johnson D.S., Bernstein B.E., Nusbaum C., Myers R.M., Brown M., Li W., et al. Model-based analysis of ChIP-Seq (MACS) Genome Biol. 2008;9:R137. doi: 10.1186/gb-2008-9-9-r137. [DOI] [PMC free article] [PubMed] [Google Scholar]
- 46.Robinson J.T., Thorvaldsdottir H., Winckler W., Guttman M., Lander E.S., Getz G., Mesirov J.P. Integrative genomics viewer. Nat. Biotechnol. 2011;29:24–26. doi: 10.1038/nbt.1754. [DOI] [PMC free article] [PubMed] [Google Scholar]
- 47.Thorvaldsdottir H., Robinson J.T., Mesirov J.P. Integrative Genomics Viewer (IGV): high-performance genomics data visualization and exploration. Brief. Bioinform. 2013;14:178–192. doi: 10.1093/bib/bbs017. [DOI] [PMC free article] [PubMed] [Google Scholar]
- 48.Shechter D., Dormann H.L., Allis C.D., Hake S.B. Extraction, purification and analysis of histones. Nat. Protoc. 2007;2:1445–1457. doi: 10.1038/nprot.2007.202. [DOI] [PubMed] [Google Scholar]
- 49.Srinivas S., Watanabe T., Lin C.S., William C.M., Tanabe Y., Jessell T.M., Costantini F. Cre reporter strains produced by targeted insertion of EYFP and ECFP into the ROSA26 locus. BMC Dev. Biol. 2001;1:4. doi: 10.1186/1471-213X-1-4. [DOI] [PMC free article] [PubMed] [Google Scholar]
- 50.Dalerba P., Kalisky T., Sahoo D., Rajendran P.S., Rothenberg M.E., Leyrat A.A., Sim S., Okamoto J., Johnston D.M., Qian D., et al. Single-cell dissection of transcriptional heterogeneity in human colon tumors. Nat. Biotechnol. 2011;29:1120–1127. doi: 10.1038/nbt.2038. [DOI] [PMC free article] [PubMed] [Google Scholar]
- 51.Girdwood D., Bumpass D., Vaughan O.A., Thain A., Anderson L.A., Snowden A.W., Garcia-Wilson E., Perkins N.D., Hay R.T. P300 transcriptional repression is mediated by SUMO modification. Mol. Cell. 2003;11:1043–1054. doi: 10.1016/s1097-2765(03)00141-2. [DOI] [PubMed] [Google Scholar]
- 52.Guidez F., Howell L., Isalan M., Cebrat M., Alani R.M., Ivins S., Hormaeche I., McConnell M.J., Pierce S., Cole P.A., et al. Histone acetyltransferase activity of p300 is required for transcriptional repression by the promyelocytic leukemia zinc finger protein. Mol. Cell. Biol. 2005;25:5552–5566. doi: 10.1128/MCB.25.13.5552-5566.2005. [DOI] [PMC free article] [PubMed] [Google Scholar]
- 53.Kasper L.H., Fukuyama T., Lerach S., Chang Y., Xu W., Wu S., Boyd K.L., Brindle P.K. Genetic interaction between mutations in c-Myb and the KIX domains of CBP and p300 affects multiple blood cell lineages and influences both gene activation and repression. PLoS One. 2013;8:e82684. doi: 10.1371/journal.pone.0082684. [DOI] [PMC free article] [PubMed] [Google Scholar]
- 54.Arany Z., Huang L.E., Eckner R., Bhattacharya S., Jiang C., Goldberg M.A., Bunn H.F., Livingston D.M. An essential role for p300/CBP in the cellular response to hypoxia. Proc. Natl. Acad. Sci. U.S.A. 1996;93:12969–12973. doi: 10.1073/pnas.93.23.12969. [DOI] [PMC free article] [PubMed] [Google Scholar]
- 55.Semenza G.L. HIF-1: upstream and downstream of cancer metabolism. Curr. Opin. Genet. Dev. 2010;20:51–56. doi: 10.1016/j.gde.2009.10.009. [DOI] [PMC free article] [PubMed] [Google Scholar]
- 56.Bedford D.C., Kasper L.H., Wang R., Chang Y., Green D.R., Brindle P.K. Disrupting the CH1 domain structure in the acetyltransferases CBP and p300 results in lean mice with increased metabolic control. Cell Metab. 2011;14:219–230. doi: 10.1016/j.cmet.2011.06.010. [DOI] [PMC free article] [PubMed] [Google Scholar]
- 57.Dames S.A., Martinez-Yamout M., De Guzman R.N., Dyson H.J., Wright P.E. Structural basis for Hif-1 alpha /CBP recognition in the cellular hypoxic response. Proc. Natl. Acad. Sci. U.S.A. 2002;99:5271–5276. doi: 10.1073/pnas.082121399. [DOI] [PMC free article] [PubMed] [Google Scholar]
- 58.Freedman S.J., Sun Z.Y., Poy F., Kung A.L., Livingston D.M., Wagner G., Eck M.J. Structural basis for recruitment of CBP/p300 by hypoxia-inducible factor-1 alpha. Proc. Natl. Acad. Sci. U.S.A. 2002;99:5367–5372. doi: 10.1073/pnas.082117899. [DOI] [PMC free article] [PubMed] [Google Scholar]
- 59.Greijer A., van der Groep P., Kemming D., Shvarts A., Semenza G., Meijer G., van de Wiel M., Belien J., van Diest P., van der Wall E. Up-regulation of gene expression by hypoxia is mediated predominantly by hypoxia-inducible factor 1 (HIF-1) J. Pathol. 2005;206:291–304. doi: 10.1002/path.1778. [DOI] [PubMed] [Google Scholar]
- 60.Manalo D.J., Rowan A., Lavoie T., Natarajan L., Kelly B.D., Ye S.Q., Garcia J.G., Semenza G.L. Transcriptional regulation of vascular endothelial cell responses to hypoxia by HIF-1. Blood. 2005;105:659–669. doi: 10.1182/blood-2004-07-2958. [DOI] [PubMed] [Google Scholar]
- 61.Schodel J., Oikonomopoulos S., Ragoussis J., Pugh C.W., Ratcliffe P.J., Mole D.R. High-resolution genome-wide mapping of HIF-binding sites by ChIP-seq. Blood. 2011;117:e207–217. doi: 10.1182/blood-2010-10-314427. [DOI] [PMC free article] [PubMed] [Google Scholar]
- 62.Peixoto A., Monteiro M., Rocha B., Veiga-Fernandes H. Quantification of multiple gene expression in individual cells. Genome Res. 2004;14:1938–1947. doi: 10.1101/gr.2890204. [DOI] [PMC free article] [PubMed] [Google Scholar]
- 63.Peixoto A., Evaristo C., Munitic I., Monteiro M., Charbit A., Rocha B., Veiga-Fernandes H. CD8 single-cell gene coexpression reveals three different effector types present at distinct phases of the immune response. J. Exp. Med. 2007;204:1193–1205. doi: 10.1084/jem.20062349. [DOI] [PMC free article] [PubMed] [Google Scholar]
- 64.Marinov G.K., Williams B.A., McCue K., Schroth G.P., Gertz J., Myers R.M., Wold B.J. From single-cell to cell-pool transcriptomes: stochasticity in gene expression and RNA splicing. Genome Res. 2014;24:496–510. doi: 10.1101/gr.161034.113. [DOI] [PMC free article] [PubMed] [Google Scholar]
- 65.Altschuler S.J., Wu L.F. Cellular heterogeneity: do differences make a difference. Cell. 2010;141:559–563. doi: 10.1016/j.cell.2010.04.033. [DOI] [PMC free article] [PubMed] [Google Scholar]
- 66.Raj A., Peskin C.S., Tranchina D., Vargas D.Y., Tyagi S. Stochastic mRNA synthesis in mammalian cells. PLoS Biol. 2006;4:e309. doi: 10.1371/journal.pbio.0040309. [DOI] [PMC free article] [PubMed] [Google Scholar]
- 67.Raj A., Rifkin S.A., Andersen E., van Oudenaarden A. Variability in gene expression underlies incomplete penetrance. Nature. 2010;463:913–918. doi: 10.1038/nature08781. [DOI] [PMC free article] [PubMed] [Google Scholar]
- 68.Chong M.M., Simpson N., Ciofani M., Chen G., Collins A., Littman D.R. Epigenetic propagation of CD4 expression is established by the Cd4 proximal enhancer in helper T cells. Genes Dev. 2010;24:659–669. doi: 10.1101/gad.1901610. [DOI] [PMC free article] [PubMed] [Google Scholar]
- 69.Luo W., Chang R., Zhong J., Pandey A., Semenza G.L. Histone demethylase JMJD2C is a coactivator for hypoxia-inducible factor 1 that is required for breast cancer progression. Proc. Natl. Acad. Sci. U.S.A. 2012;109:E3367–E3376. doi: 10.1073/pnas.1217394109. [DOI] [PMC free article] [PubMed] [Google Scholar]
- 70.Luo W., Hu H., Chang R., Zhong J., Knabel M., O'Meally R., Cole R.N., Pandey A., Semenza G.L. Pyruvate kinase M2 is a PHD3-stimulated coactivator for hypoxia-inducible factor 1. Cell. 2011;145:732–744. doi: 10.1016/j.cell.2011.03.054. [DOI] [PMC free article] [PubMed] [Google Scholar]
- 71.Dengler V.L., Galbraith M.D., Espinosa J.M. Transcriptional regulation by hypoxia inducible factors. Crit. Rev. Biochem. Mol. Biol. 2014;49:1–15. doi: 10.3109/10409238.2013.838205. [DOI] [PMC free article] [PubMed] [Google Scholar]
- 72.Galbraith M.D., Allen M.A., Bensard C.L., Wang X., Schwinn M.K., Qin B., Long H.W., Daniels D.L., Hahn W.C., Dowell R.D., et al. HIF1A employs CDK8-mediator to stimulate RNAPII elongation in response to hypoxia. Cell. 2013;153:1327–1339. doi: 10.1016/j.cell.2013.04.048. [DOI] [PMC free article] [PubMed] [Google Scholar]
- 73.Melvin A., Rocha S. Chromatin as an oxygen sensor and active player in the hypoxia response. Cell Signal. 2012;24:35–43. doi: 10.1016/j.cellsig.2011.08.019. [DOI] [PMC free article] [PubMed] [Google Scholar]
- 74.Carrero P., Okamoto K., Coumailleau P., O'Brien S., Tanaka H., Poellinger L. Redox-regulated recruitment of the transcriptional coactivators CREB-binding protein and SRC-1 to hypoxia-inducible factor 1alpha. Mol. Cell. Biol. 2000;20:402–415. doi: 10.1128/mcb.20.1.402-415.2000. [DOI] [PMC free article] [PubMed] [Google Scholar]
- 75.Ramos Y.F., Hestand M.S., Verlaan M., Krabbendam E., Ariyurek Y., van Galen M., van Dam H., van Ommen G.J., den Dunnen J.T., Zantema A., et al. Genome-wide assessment of differential roles for p300 and CBP in transcription regulation. Nucleic Acids Res. 2010;38:5396–5408. doi: 10.1093/nar/gkq184. [DOI] [PMC free article] [PubMed] [Google Scholar]
- 76.Walters M.C., Fiering S., Eidemiller J., Magis W., Groudine M., Martin D.I. Enhancers increase the probability but not the level of gene expression. Proc. Natl. Acad. Sci. U.S.A. 1995;92:7125–7129. doi: 10.1073/pnas.92.15.7125. [DOI] [PMC free article] [PubMed] [Google Scholar]
- 77.Sen R., Grosschedl R. Memories of lost enhancers. Genes Dev. 2010;24:973–979. doi: 10.1101/gad.1930610. [DOI] [PMC free article] [PubMed] [Google Scholar]
- 78.Matsushita H., Vesely M.D., Koboldt D.C., Rickert C.G., Uppaluri R., Magrini V.J., Arthur C.D., White J.M., Chen Y.S., Shea L.K., et al. Cancer exome analysis reveals a T-cell-dependent mechanism of cancer immunoediting. Nature. 2012;482:400–404. doi: 10.1038/nature10755. [DOI] [PMC free article] [PubMed] [Google Scholar]
- 79.DuPage M., Mazumdar C., Schmidt L.M., Cheung A.F., Jacks T. Expression of tumour-specific antigens underlies cancer immunoediting. Nature. 2012;482:405–409. doi: 10.1038/nature10803. [DOI] [PMC free article] [PubMed] [Google Scholar]
- 80.Chalancon G., Ravarani C.N., Balaji S., Martinez-Arias A., Aravind L., Jothi R., Babu M.M. Interplay between gene expression noise and regulatory network architecture. Trends Genet. 2012;28:221–232. doi: 10.1016/j.tig.2012.01.006. [DOI] [PMC free article] [PubMed] [Google Scholar]
- 81.Suva M.L., Riggi N., Bernstein B.E. Epigenetic reprogramming in cancer. Science. 2013;339:1567–1570. doi: 10.1126/science.1230184. [DOI] [PMC free article] [PubMed] [Google Scholar]
Associated Data
This section collects any data citations, data availability statements, or supplementary materials included in this article.