


Abstract
Alternative splicing (AS) is a fundamental mechanism for the regulation of gene expression. It affects more than 90% of human genes but its role in the regulation of pancreatic beta cells, the producers of insulin, remains unknown. Our recently published data indicated that the ‘neuron-specific’ Nova1 splicing factor is expressed in pancreatic beta cells. We have presently coupled specific knockdown (KD) of Nova1 with RNA-sequencing to determine all splice variants and downstream pathways regulated by this protein in beta cells. Nova1 KD altered the splicing of nearly 5000 transcripts. Pathway analysis indicated that these genes are involved in exocytosis, apoptosis, insulin receptor signaling, splicing and transcription. In line with these findings, Nova1 silencing inhibited insulin secretion and induced apoptosis basally and after cytokine treatment in rodent and human beta cells. These observations identify a novel layer of regulation of beta cell function, namely AS controlled by key splicing regulators such as Nova1.
INTRODUCTION
Alternative splicing (AS) affects more than 90% of human genes (1). It allows individual genes to produce structurally and functionally distinct mRNAs and their relative protein isoforms, explaining the discrepancy between the estimated 24,000 protein-coding genes in the human genome and the >100,000 different proteins synthesized (2). Changes in AS may have a major impact on cell survival, exposure of novel antigenic epitopes, alteration of surface location of antigens and post-translational modifications (3–5). There is a growing interest in the role of AS in several autoimmune diseases (6,7), but nearly nothing is known on its role in pancreatic beta cell function and its dysfunction and apoptosis in diabetes.
We have recently shown that beta cell exposure to pro-inflammatory cytokines modifies AS of more than 3000 expressed genes, including genes involved in chemotaxis and apoptosis, and of more than 50 splicing-regulating proteins (8,9). Our group has recently clarified the cross-talk between the diabetes candidate gene Glis3, cytokines and the splicing factor SRp55. This splicing factor is down-regulated after cytokine treatment or knockdown (KD) of the diabetes candidate gene Glis3 providing an important ‘proof of concept’ for the role of AS in diabetes (9).
Regulation of splicing involves the cooperation between serine/arginine-rich (SR) proteins, heterogeneous nuclear ribonucleoproteins (hnRNP) and several other tissue-specific regulators (10). Nova1 has been defined as a ‘neuron-specific’ splicing factor (11–13) but we recently reported that Nova1 is also expressed in the beta cells of the human and rat islets of Langerhans (8).
Nova1 binds to YCAY-rich elements (14–17) and it is a central regulator of neuronal AS (16,18–24). By combining protein–RNA crosslinking and Nova-immunoprecipitation, Darnell and colleagues identified >200 Nova RNA targets in the mouse brain (13). These transcripts regulate the development of brain synapses (19). Some of the known Nova1 target genes in brain are also expressed in beta cells, including Gabrg2, Neuroligin and Neurexin family members, Inhibitory synapse-associated neuroligin and neurexin binding partners (8) but the global role of Nova1 in pancreatic beta cell function and survival remains unknown.
High-throughput mRNA sequencing (RNA-seq) provides the opportunity to study AS in an unbiased manner and on a genome-wide scale. RNA-seq allows the discovery of novel transcripts and the estimation of their abundance. This is extremely useful when dealing with poorly annotated transcriptomes (25) and is a powerful method to identify splicing networks regulated by different splicing factors (26).
In this study, we have combined siRNA technology, RNA-seq and functional studies to characterize the role of Nova1 in the regulation of beta cell mRNA splicing and its implication in the function and viability of these cells. This combined approach showed that Nova1 is a master regulator of AS in beta cells, controlling key pathways involved in beta cell function and survival. These findings unveil a novel role for Nova1, outside the brain, and indicate that AS is a novel layer of regulation of pancreatic beta cell dysfunction and apoptosis in diabetes.
MATERIALS AND METHODS
Ethic statements
Human islet collection and handling were approved by the local Ethical Committee in Pisa, Italy. Wistar rats were used according to the rules of the Belgian Regulations for Animal Care with approval of the Ethical Committee for Animal Experiments of the ULB, Brussels, Belgium.
Culture of INS-1E cells, INS-1 832/13 cells, FACS-purified rat beta cells and human islet cells
Rat insulin-producing INS-1E cells, kindly provided by C. Wollheim, University of Geneva, Geneva, Switzerland (27), were cultured in RPMI 1640 medium supplemented with 5% FBS, 10 mM HEPES, 1 mM Na-pyruvate and 50 μM 2-mercaptoethanol (28). INS-1 832/13 cells were cultured in the same medium as INS-1E cells.
Pancreatic islets were isolated from adult male Wistar rats (Charles River Laboratories, Brussels, Belgium) and primary beta cells FACS-purified (FACSAria; BD Bioscience, San Jose, CA, USA) and cultured as described (29).
Human islets from four non diabetic donors were isolated in Pisa using collagenase digestion and density gradient purification (30). The donors (two women, two men) were 51±14 years old and had a BMI 22±1 [kg/m2]. Beta cell content, as evaluated by immunofluorescence for insulin using a specific anti-insulin antibody (8), was 62±6%.
The human islets were cultured in M199 culture medium containing 5.5 mM glucose and sent to Brussels, Belgium, within 1–5 days after isolation, where they were dispersed and cultured in Ham's F-10 medium containing 6.1 mM glucose (Invitrogen-Life Technologies, Paysley, UK) as described (8,31).
Cell treatment
The following cytokine concentrations were used, based on previous dose-response experiments performed by our group (32–34): recombinant human IL-1β (R&D Systems, Abingdon, UK) 10 or 50 units/ml respectively for INS-1E cells or primary rat beta cells and human islet cells; recombinant rat IFN-γ (R&D Systems) 100 or 500 units/ml respectively for INS-1E cells and primary rat beta cells, and human IFN-γ (Peprotech, London, UK) 1000 units/ml for human islet cells.
RNA interference
The siRNAs used in the study are described in Supplementary Table S1. The optimal conditions and concentrations of siRNA for beta cell transfection (30 nM) were previously established by our group (31,35). Cells were transfected using the Lipofectamine RNAiMAX lipid reagent (Invitrogen) as previously described (35,36). Allstars Negative Control siRNA (Qiagen, Venlo, The Netherlands) was used as negative control (siCTL). This siCTL does not affect beta cell gene expression or insulin release, as compared with non-transfected cells (35). After 16 h of transfection, cells were cultured for a 24 h or 48 h recovery period before exposure to cytokines.
Assessment of cell viability
The percentage of viable, apoptotic and necrotic cells was determined after 15-min incubation with DNA-binding dyes propidium iodide (5 μg/ml; Sigma-Aldrich, Poole, UK) and Hoechst dye 33342 (5 μg/ml; Sigma-Aldrich) by two independent researchers, one of them unaware of samples identity. A minimum of 600 cells were counted for each experimental condition. In some experiments, apoptosis was also confirmed by caspase-3 and -9 cleavage and KD of Bim, a key pro-apoptotic BH3-only protein in beta cells (37).
RNA-sequencing
Three preparations of FACS-purified rat primary beta cells were used for RNA-sequencing as described (8). Briefly, total RNA was isolated using the RNeasy Micro Kit (Qiagen) which favors purification of RNA molecules longer than 200 nucleotides, and sample preparation was done as described by the manufacturer (Illumina, Eindhoven, The Netherlands). mRNA was purified from 1 μg total RNA using oligo (dT) beads, before it was fragmented and randomly primed for reverse transcription followed by second-strand synthesis to create ds cDNA fragments. The generated cDNA had undergone paired-end repair to convert overhangs into blunt ends. After 39-monoadenylation and adaptor ligation, cDNAs were purified on a 2% agarose gel and 200 basepair (bp) products were excised from the gel. Following gel digestion, purified cDNA was amplified by PCR using primers specific for the ligated adaptors. The generated libraries were submitted to quality control with the Agilent bio-analyzer 2100 (Agilent Technologies, Wokingham, UK) before sequencing. The RNA integrity number values for all samples were 7.5 and above. One microliter cDNA was loaded on an Agilent DNA chip (DNA-1000) to verify cDNA quality and quantity. Only libraries reaching satisfactory conditions were used for sequencing, on an Illumina HiSeq 2000 system. The raw data generated during the sequencing procedure on the HiSeq 2000 will be deposited in Gene Expression Omnibus under submission number GSE59633.
RNA-seq data analysis
Sequencing reads were mapped to the rat genome (version Rnor_5.0) using Tophat software version 2.02 (25) and the default options. Mapped reads were used with Cufflinks software suite in combination with rat transcripts annotations from Ensembl database (38) version 70 for transcripts assembly using the novel transcripts discovery options. Transcript quantification from the mapped reads and the newly assembled transcripts was performed using the Flux Capacitor approach developed by one of us (M.S.) (http://flux. sammeth.net, (39)). All genes and transcripts have been assigned a relative coverage rate as measured in RPKM units (‘reads per kilobase per million mapped reads’) (40). Lists of differentially expressed genes and transcripts were generated from the Flux Capacitor output using custom scripts in Perl or R.
To define genes up- or down-regulated by Nova1 KD, the log2 of the proportion between the sum of the RPKM for all gene transcripts under Nova1 KD condition and the same sum in control condition was taken as measure of change in gene expression. The P-value was obtained by performing a Fisher exact test (number of reads mapped to the gene and number of reads mapped to all other genes in the Nova1 KD condition versus the control condition) and corrected by the Benjamini–Hochberg method (taking for each gene the three samples as independent tests). A difference in gene expression was considered significant if the corrected P-value was lower than 0.05. As an additional criteria, a gene with corrected P < 0.05 was considered to be ‘modified by Nova1 KD’ only if its expression changed significantly in the same direction—i.e. ‘up’ or ‘down’—across all of the three samples. In order to quantify Nova1 KD-modified splicing, differences in ‘splice indices’—the proportion between the RPKM for a transcript and the sum of the RPKM for all the transcripts from the same gene—under Nova1 KD condition were compared to the control condition. Additionally, a P-value on the significance of changes in splicing patterns was obtained by performing a Fisher exact test (number of reads assigned to a certain transcript after deconvolution versus the number of reads mapped to all other transcripts of the same gene, comparing Nova1 KD with control condition) and was corrected by the Benjamini–Hochberg method (taking for each transcript the three samples as independent tests). A change in AS was considered significant after applying the same criteria as for the gene expression. Up/down-regulated genes/transcripts were analyzed using Ingenuity Pathway Analysis (IPA, Ingenuity Systems, http://www.ingenuity.com) or UCSC_TFBS DAVID (Database for Annotation, Visualization and Integrated Discovery, http://david.abcc.ncifcrf.gov) (41). Potential binding sites for Nova1 were identified using the SpliceAid database (http://www.introni.it/splicing.html).
Large-scale prediction of Nova1 binding site clusters in modified exons
To predict potential YCAY Nova1 binding sites, 200 nucleotides were extracted on both sides of each intron-exon junctions of all regulated exons as in previous studies (20,42). To avoid overlapping sequences, the short exons were shared equally on both junctions. For negative control, 10 sets of an equal number of sequences were extracted following the same procedure for exons selected randomly from expressed but not regulated by Nova1. We then used the Regulatory Sequences Analysis Tools software suite (43) program matrix-scan (44) to predict clusters of YCAY motif in the regulated exons and negative control. The matrix-scan program reports individual motif as well as regions where they occur in clusters, called cis-regulatory elements enriched regions (CRER). These are regions that have a higher number of predicted site occurrences than expected by chance. To detect them, first individual sites were predicted using the Nova1 motif. They were filtered using a threshold on a P-value of 2.5e-03. Windows of variable sizes from 10 to 60 nucleotides were then defined over the input sequences and the number of predicted sites was counted within each window. Second, the expected number of matches was calculated within each window and then used to estimate the significance of the over-representation of matches. The binomial distribution was used to estimate the probability to observe by chance at least as many matches as those counted in the window. This cluster probability, called ‘CRER P-value’, has to be distinguished from the ‘site P-value’: the site P-value estimates the risk of false positive for an individual match, whereas the CRER P-value estimates the risk of error when considering that a window contains more matches than expected by chance. A Wilcoxon–Mann–Whitney test was used to compare the P-values of predicted YCAY clusters in Nova1-modified exons and in negative control.
Human islet and rat beta cell RNA extraction, RT-PCR and qRT-PCR
Independent human islet preparations, clonal INS-1E and FACS-purified primary rat beta cells were used for validation and mechanistic experiments. PolyA mRNA was isolated using the Dynabeads mRNA DIRECT kit (Invitrogen) and reverse transcribed as previously described (28). qRT-PCR was done using the iQ SYBR Green Supermix (BIO-RAD, Nazareth Eke, Belgium) on a LightCycler (Roche Diagnostics, Mannheim, Germany) or iCycler MyiQ Single Color (BIO-RAD) instrument (45,46). Data were expressed as the number of copies using the standard curve method and corrected for the housekeeping genes β-actin or glyceraldehyde-3-phosphate dehydrogenase (GAPDH). Splice variants were examined by conventional PCR. Primers used for qRT- and RT-PCR are listed in Supplementary Table S2.
Glucose oxidation and insulin secretion
D-[U-14C] glucose (specific activity: 300 mCi/mM, concentration: 1 mCi/ml, Perkin Elmer, Waltham, MA, USA) was used to evaluate glucose oxidation in control and Nova1 KD cells exposed to different glucose concentrations as described (47). The rate of glucose oxidation was expressed as pmol/120 min·105 cells.
For determination of insulin secretion, INS-1E cells were incubated for 1 h in glucose-free RPMI GlutaMAX-I medium and then incubated for 30 min in Krebs-Ringer solution. Cells were then exposed to 1.7 mM, 16.7 mM or 16.7 mM glucose with forskolin (20 μM) for 30 min. Insulin was measured in the supernatant by the rat insulin ELISA kit (Mercodia, Uppsala, Sweden). Results were normalized by the insulin content measured after cell lyses.
Electrophysiological measurements
Experiments were conducted on single INS-1 832/13 cells after transfection as described above. The siRNA used in these experiments is listed in the Supplementary Table S2 as siNova1#2. Whole-cell currents were measured as described previously (48) using an EPC-10 patch-clamp amplifier and the software Pulse (Heka Elektronik, Lamprecht/Pfalz, Germany; version 8–31). A current-voltage (I–V) protocol was performed on each cell to measure the inward voltage-dependent current. In this protocol a 50-ms depolarization from −70 mV to increasing voltages from −50 mV to +40 mV was applied to the cell. The standard extracellular solution consisted of (in mM): 118 NaCl, 20 tetraethyl-ammonium chloride (TEA-Cl; to block voltage-gated K+ currents), 5.6 KCl, 2.6 CaCl2, 1.2 MgCl2, 5 glucose and 5 HEPES (pH 7.4 using NaOH). The pipette solutions contained 125 Cs-Glut, 10 NaCl, 10 CsCl, 1 MgCl2, 0.05 EGTA, 3 Mg-ATP, 5 HEPES (pH 7.15 using CsOH) and 0.1 cAMP.
Western blot
After cell culture and treatment, cells were washed with cold phosphate buffered saline and lysed using Laemmli buffer. Total protein was extracted and resolved by 6–12% sodium dodecyl sulphate-polyacrylamide gel electrophoresis, transferred to a nitrocellulose membrane and immunoblotted with the specific antibodies for the protein of interest as described (31). The primary antibodies were goat anti-Nova1 (0.03 μg/ml; Abcam, Cambridge, UK), rabbit anti-cleaved caspases 9 and 3 (1:1000; Cell Signaling, Danvers, USA), rabbit anti-PLCβ1 (1:1000; Santa Cruz Biotechnology, CA, USA), rabbit anti-Bim (1:1000; Cell Signaling), rabbit anti-FoxO3A (1:1000; Cell Signaling), rabbit anti-Phospho-FoxO3A (1:1000; Cell Signaling), rabbit anti-Akt (1:1000; Cell Signaling) and mouse anti-α-tubulin (1:10000, Sigma). The proteins were detected using horseradish peroxidase-conjugated secondary antibody (1:5000; Santa Cruz Biotechnology). Protein signal was visualized using chemiluminescence Supersignal (Pierce) and quantified using Scion Image (Scion Corporation, Frederick, MD, USA). The intensity values for the proteins were corrected by the values of the housekeeping protein α-tubulin.
Statistical analysis
The statistical analysis of the RNA-seq data is described above. Data for the confirmation and functional studies are shown as means ± SEM. Comparisons were performed by paired two-tailed Student's t-test or by ANOVA followed by a paired Student's t-test with Bonferroni's correction as adequate. A P ≤ 0.05 was considered statistically significant.
RESULTS
Nova1 acts as a splicing factor in pancreatic beta cells
In order to elucidate the function of Nova1 in pancreatic beta cells, we used RNA interference to KD Nova1 in FACS-purified primary rat beta cells obtaining a decrease of Nova1 expression of >50% (Figure 1A). This siRNA-induced decrease of Nova1 expression was also confirmed at protein level in INS-1E cells (Figure 1B). Nova1 was previously shown to modulate the splicing of Neurexin1 (20), to cause exon 9 inclusion in Gabrg2 transcripts (21) and to produce its own exon 4 exclusion in mouse brain (22). Nova1 KD in INS-1E cells induced similar changes in these three genes, causing an increase in exon 9 exclusion in Gabrg2 transcripts, a decrease in its own exon 4 exclusion and a change in the splicing pattern of Neurexin1 (Figure 1C). These results were reproduced in primary beta cells (data not shown), confirming that modulation of Nova1 expression indeed affects AS in beta cells.
Figure 1.
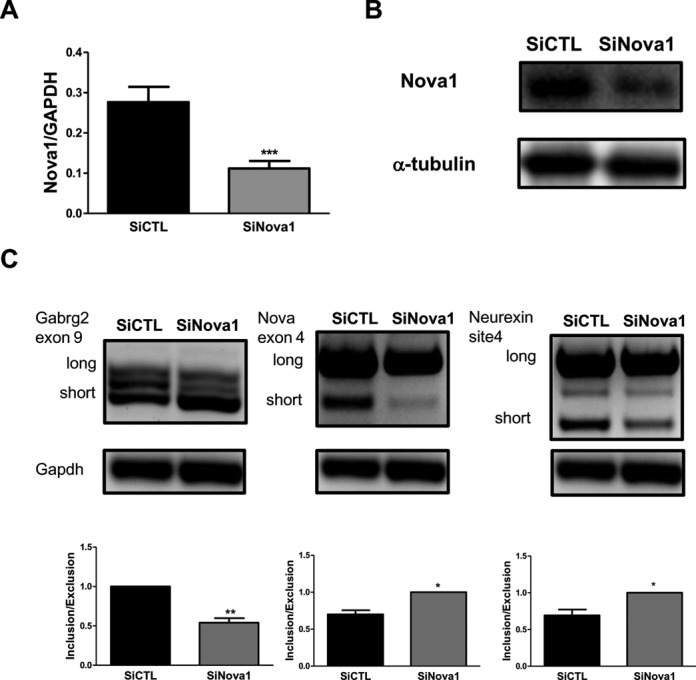
Nova1 regulates the AS of several genes in pancreatic beta cells. (A) Primary rat beta cells were transfected with siCTL or siNova1 and then collected after 48 h for mRNA expression analyses. Expression of Nova1 after its KD is shown. Results are mean ± SEM (n = 7). ***P < 0.001 versus siCTL by paired t-test. (B) Representative western blot of Nova1 expression after its KD in INS-1E cells (n = 5). (C) Agarose gel showing that Nova1 controls AS of Gabrg2 exon 9, its own exon 4 and Neurexin1 site 4. Long and short indicates the variants with or without the corresponding analysed exons. The results shown are representative of five different experiments where Nova1 has been KD. The percentage of inclusion/exclusion of each exon was quantified by densitometry (considering the highest value in each individual experiment as 1) and is shown under the respective gels. *P < 0.05 or **P < 0.01 versus siCTL by paired t-test.
RNA-sequencing of pancreatic beta cells following Nova1 KD
In order to understand the global role of Nova1 in the regulation of gene expression and AS in beta cells, three independent preparations of FACS-purified rat beta cells (purity between 90 and 95%) were exposed to siControl (siCTL) or siNova1, and then RNA-sequenced. We obtained an average of 177 million total reads (paired end 100 nucleotides) reaching a high transcriptome resolution, which enabled quantification of transcript abundance and analysis of AS. The reads were aligned onto the rat genome (Rnor_5.0), allowing the mapping of 77–85% of the raw reads (Supplementary Table S3).
We next used the Cufflinks software suite (25) to identify potentially novel transcripts (Supplementary Figure S1A). The number of transcripts detected as present with a RPKM higher than 0 was 43,460, corresponding to 18,257 known genes. Compared to the 29,094 transcripts (26,313 genes) annotated in Ensembl version 70, this represents a significant increase in the knowledge of the beta cell rat transcriptome, with 2.4 isoforms per gene in the present newly assembled transcriptome as compared to the 1.1 isoforms per gene annotated in Ensembl (Supplementary Figure S1B and C). Most of these genes and transcripts are well expressed (RPKM>0.5) in beta cells as shown in Supplementary Figure S1D and E.
Of the 18,257 genes detected as present by the RNA-seq, 3373 (18%) were significantly modified by a 48-h KD of Nova1, with 2374 and 999 respectively up- and down-regulated. Only 8% of these modified genes, however, had a fold change higher than 1.5-fold (Figure 2A). On the other hand, the changes induced by the Nova1 KD were more marked at the isoform level, with 57% of the isoforms modified showing a fold change >1.5 (Figure 2B). This suggests that Nova1 affects both transcription and splicing in beta cells, but with a more marked effect on splicing (see below).
Figure 2.
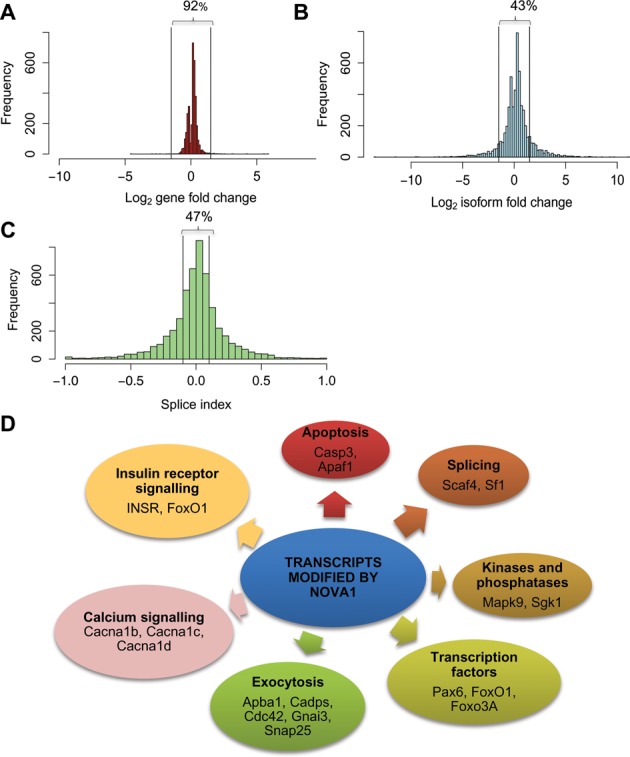
Effect of Nova1 KD on the fold change of genes and isoforms. (A–B) The histograms show the distributions of fold change at the gene level (A) and at the isoform level (B) after Nova1 KD and RNA-seq analysis of three independent primary rat beta cell preparations. Only 8% of all the modified genes show a log fold change higher than 1.5 (up-regulated) or lower than 0.67 (down-regulated). At the isoform level this proportion is much higher, i.e. 57%. (C) Distribution of the ‘splicing index’ values (see Results for details about the splicing index) after Nova1 KD. Most of the significantly alternatively spliced isoforms have a splicing index higher than 10% (delimited by the two vertical lines). (D) Overview of the key Nova1 modified pathways and transcripts after IPA pathways analysis.
Nova1 KD modified the splicing of 4961 (11% of the total) isoforms, with 2702 and 2259 isoforms respectively up- and down-regulated. Similarly to the fold-change distribution, the distribution of the splicing index showed that 53% of spliced isoforms had a splicing index—the difference between the proportion between the RPKM of a transcript and the sum of the RPKM for all the transcripts from the same gene—higher or lower than the threshold percentage of 10% (Figure 2C). This further supports the role of Nova1 as a splicing factor in pancreatic beta cells. Analyzes of the number of exons included or excluded in Nova1-silenced pancreatic beta cells indicated respectively 2202 and 1818 exons preferentially included or excluded after Nova1 KD. It has been shown that Nova1 modifies 325 exons corresponding to 267 genes in mouse brain (20), of which 189 (71%) are also expressed in pancreatic beta cells. Nova1 modulates the splicing of 80% of the common genes shared by brain and pancreatic beta cells (present data, hypergeometric P-value: 3.9E-26).
It has been shown that Nova1 binds to the YCAY motif in brain that appears in clusters in the vicinity of intron-exon junctions (20,42). We set out to predict potential YCAY clusters in all Nova1-modified exons to check if they showed a particular enrichment. As reported previously, Nova1-regulated splicing is position dependent: alternative exons are more often included when Nova1 binds to downstream introns and more often excluded via binding to upstream introns (20,42). We thus predicted separately YCAY clusters in the regions surrounding the upstream and downstream exon-intron junction regions for up-regulated and down-regulated exons after Nova1 KD, respectively. The results showed more significant YCAY clusters in the downstream regions of down-regulated exons after Nova1 KD compared to randomly selected exons (Wilcoxon–Mann–Whitney P-value: 0.002). The corresponding upstream regions of the same exons showed less significant YCAY clusters (Wilcoxon–Mann–Whitney P-value: 0.027; Supplementary Figure S1F). These observations are in line with the regulatory code of Nova1 as it promotes exon inclusion when bound to upstream regions. Nova1 KD promotes the down-regulation in those exons. In contrast, the downstream junction regions of up-regulated exons after Nova1 KD showed less significant YCAY clusters (Wilcoxon–Mann–Whitney P-value: 0.036; Supplementary Figure S1F). We did not observe differences in the occurrence of significant YCAY clusters in the upstream regions (Supplementary Figure S1G).
We next analyzed the nature of the primary rat beta cell transcript networks modified by Nova1 (the complete list is accessible at http://lmedex.ulb.ac.be/data.php with a password provided upon request) using IPA (Figure 2D and Supplementary Figure S2A) and the DAVID software (Figure 2D). This analysis suggested that the main pathways affected by Nova1 are exocytosis, calcium signaling, apoptosis, insulin receptor signaling, splicing and transcription; there were also several kinases and phosphatases regulated by Nova1 (Figure 2D). IPA showed that differentially spliced transcripts belong prominently to the functions ‘Cell-to-Cell Signaling interaction’, ‘Cell Death’, ‘Molecular Transport’, ‘Post-Translational Modification’ and ‘Cellular Assembly and Organization’ (Supplementary Figure S2A). We also performed IPA analysis on the 154 common transcripts modified by Nova1 in brain and beta cells, observing that they belong to similar categories to those described for the complete list of target genes in beta cells (Supplementary Figure S2B). Moreover, detailed analysis of the canonical pathways of Nova1 target genes shared by brain and beta cells indicates that they are mainly involved in calcium signaling and synaptic long-term potentiation.
In order to further validate our RNA-seq analysis, we selected additional Nova1-target genes for independent evaluation by RT-PCR and confirmed their changes in splicing after Nova1 KD in INS-1E cells (Supplementary Figure S3). The selected genes play a role in key cellular functions such as splicing (Sfrs9), potassium channels (Kcnma1), kinases (Mapk9 and Map3k9), Rho GTPases (Arhgef12) and reductases (Cyb5r4).
Inhibition of Nova1 impairs insulin release and decreases voltage-dependent Ca2+ current
Nova1 KD decreased glucose or glucose + forskolin-induced insulin release, but did not affect basal insulin release (Figure 3A). In order to determine if the observed decrease in insulin secretion in Nova1 KD cells was mostly related to defective exocytosis, as suggested by the observations above, or to a putative decrease in glucose metabolism and ATP generation, we measured glucose metabolism in INS-1E cells KD for Nova1. There was no difference in glucose oxidation between the control and Nova1 KD cells, respectively (1.7 mM glucose, 1.08 ± 0.21 versus 1.07 ± 0.22 and 16.7 mM glucose, 6.12 ± 0.74 versus 7.23 ± 0.78 pmol/105 cells·120−1 min).
Figure 3.
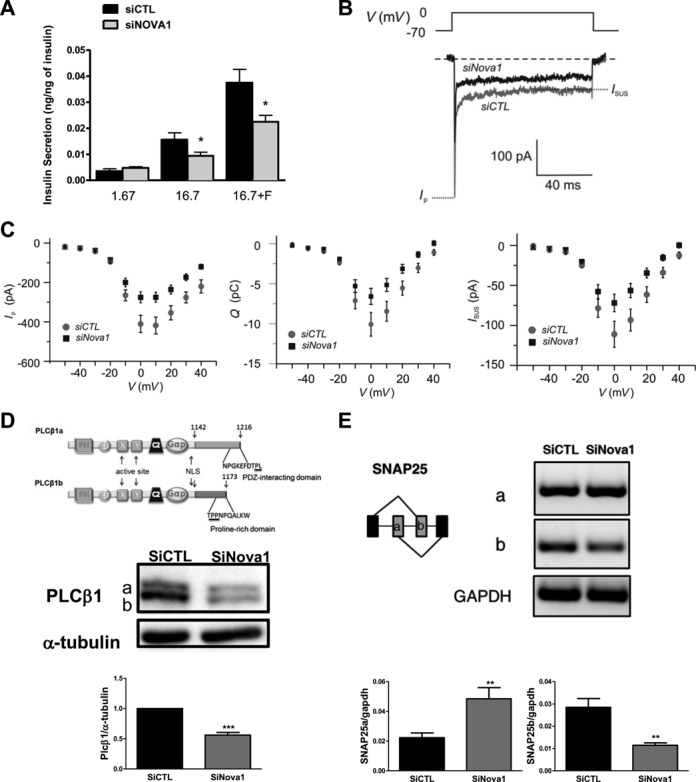
Nova1 regulates insulin secretion and voltage-dependent current influx. INS-1E cells (A, D, E) and INS-1 832/13 cells (B–C) were transfected with siCTL or siNova1. After 48 h cells were used for insulin secretion assay (A), voltage-dependent current influx analysis (B–C) protein analysis (D) and mRNA analysis (E). (A) INS-1E cells were incubated for 30 min with 1.7 mM glucose, 16.7 mM glucose or 16.7 mM glucose plus forskolin (20 μM) (n = 5) and the insulin released evaluated by ELISA. *P < 0.05 versus siCTL by paired t-test. (B) A current voltage protocol where 50-ms depolarizations from −70 mV to voltages between −50 mV and +40 mV were applied to INS-1 832/13 cells. Shown in the figure are the currents measured when a siCTL cell (gray trace) and a siNova1 cell (black trace), respectively, were depolarized to 0 mV. (C) The average sustained current Isus (measured as described in B), charge (Q) and peak-current Ip as a function of the membrane voltage (V) are from the experiments described in B. Ip is a measure of the voltage-dependent Na+ current and Isus and Q are measures of the voltage-dependent Ca2+ current. Data are representative of n = 28 to 33 experiments in each group. (D) Schematic overview of PLCβ1 indicating the splicing variants and a representative western blot (n = 4) of PLCβ1 variants expression after Nova1 KD. α-tubulin was used as a control for protein loading. The quantification of PLCβ1 expression is shown. ***P < 0.001 versus siCTL by paired t-test. (E) Snap25 AS was evaluated by RT-PCR after Nova1 KD. The quantification of both splice variants by qRT-PCR is shown. **P < 0.01 versus siCTL by paired t-test. An agarose gel of one experiment is shown. (D) and (E) are representative of four similar experiments.
Since Nova1 modifies the splicing of several calcium channels (Figure 2D), which may also modulate insulin exocytosis (49), we next examined the voltage-dependent Ca2+ current after Nova1 KD in INS-1 832/13 cells. Similar to the observations made in INS-1E cells (Figure 3A), Nova1 KD also inhibits insulin secretion in INS-1 832/13 cells (data not shown). In parallel, Nova1 KD induced a 35±10% decrease (n = 28–33; P < 0.05) in the voltage-dependent Ca2+ current. This was confirmed by measurements of the current-voltage relationship using 50-ms depolarizations from −70 mV to voltages between −50 and +40 mV. The measured current consists of a rapidly activating Na+ current and a slower activating Ca2+ current. Maximum current was achieved when the membrane was depolarized to 0 mV (Figure 3B and C). These results are in agreement with the observed reduced insulin secretion (Figure 3A).
In line with the pathway analysis suggesting that Nova1 modulates genes involved in exocytosis, we found in the RNA-seq data two target genes of Nova1 that are involved in insulin secretion, namely PLCβ1 and SNAP-25. A decrease in the expression of the main isoform of the phospholipase PLCβ1 in MIN6 cells decreases insulin secretion (50). We presently observed that splicing of PLCβ1 is modified after Nova1 KD, with a main decrease of the isoform b (Figure 3D) that correlates with the observed decrease in insulin secretion. We identified potential binding sites for Nova1 in the sequence of PLCβ1 using the SpliceAid database. The expression of PLCβ1 variants was also modified (40±4% decrease, P < 0.001) after Nova1 KD confirming that Nova1 affects transcription. Nova1 modified the splicing of the vesicle fusion protein Snap25 (51) switching exon 5a/5b and leading to a lower expression of exon 5b in INS-1E cells (Figure 3E). Isoform b is more effective in mediating Ca 2+-triggered secretion (52) and the change in splicing is functionally significant, as previously described in the brain (53). We confirmed that Snap25 has potential Nova1 binding sites in the sequences of the different exons 5a, 5b and in the surrounding introns, with a high score according to SpliceAid database (Figure 4A). We designed a specific siRNA that targets splice variant b but not the a one (Figure 4B). KD of the splice variant b in INS-1E cells decreased glucose or glucose + forskolin-induced insulin release (Figure 4C), similar to the findings observed after Nova1 KD.
Figure 4.
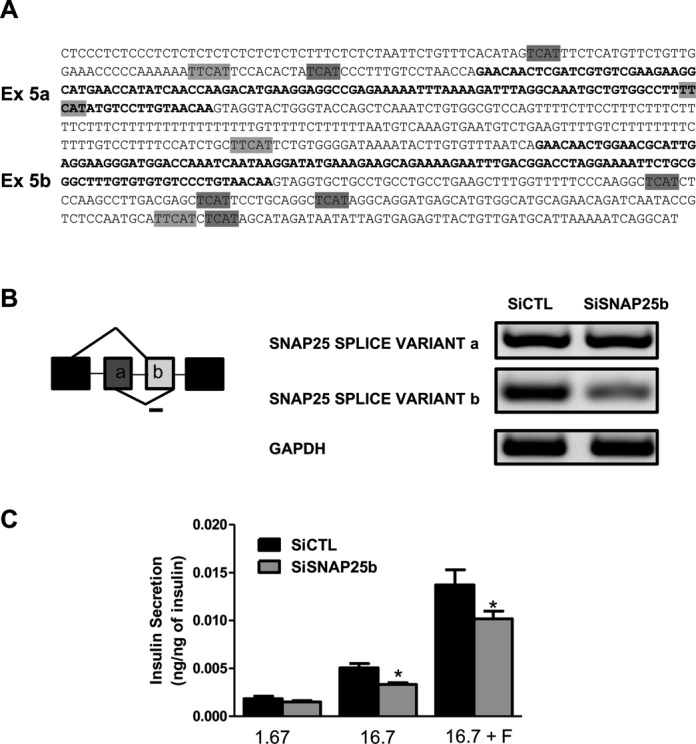
KD of Nova1-regulated Snap25 splice variant b decreases insulin secretion. (A) Snap25 exons 5a and 5b (bold) and the surrounding intron sequences are shown. Potential binding sites for Nova1 are highlighted in gray. (B) Schematic overview of Snap25 alternative exons 5a and 5b. The line indicates the position of the siRNA designed to KD Snap25 splice variant b. INS-1E cells were transfected with control or a Snap25 splice variant b siRNA and after 48 h collected for mRNA analysis. A representative agarose gel (of five similar experiments) showing the expression of both variants and gapdh is shown. (C) INS-1E cells were incubated for 30 min with 1.7 mM glucose, 16.7 mM glucose or 16.7 mM glucose plus forskolin (20 μM) (n = 5) and the insulin released evaluated by ELISA. *P < 0.05 versus siCTL by paired t-test.
Nova1 regulates insulin receptor AS in pancreatic beta cells
Analyzing the genes of the upstream pathway of the FoxO family of transcription factors (54,55), we observed an interesting finding revealed by the RNA-seq data, namely that Nova1 KD modifies the splicing of the insulin receptor (INSR) gene. Due to AS of exon 11, the INSR exists in two isoforms, A and B, which differ by the absence or presence of a 12 amino acid sequence respectively (Figure 5A). There is evidence for lower signaling potential for INSR-A as compared to INSR-B (54,56). The number of RNA-seq reads that cover the exon 11 was clearly decreased following Nova1 silencing (Figure 5B), and using the SpliceAid database we identified 10 potential binding sites for Nova1 with high score in INSR exon 11 and the intron 11 (Figure 5C). We confirmed the change in splicing by RT-PCR (Figure 5D), observing a decrease of 30±4% (n = 3; P < 0.05) of the exon 11 inclusion after Nova1 KD (Figure 5D). This resulted in an increase in the isoform INSR-A and a decrease in the isoform INSR-B. Additional studies are now required to clarify the functional impact of this change.
Figure 5.
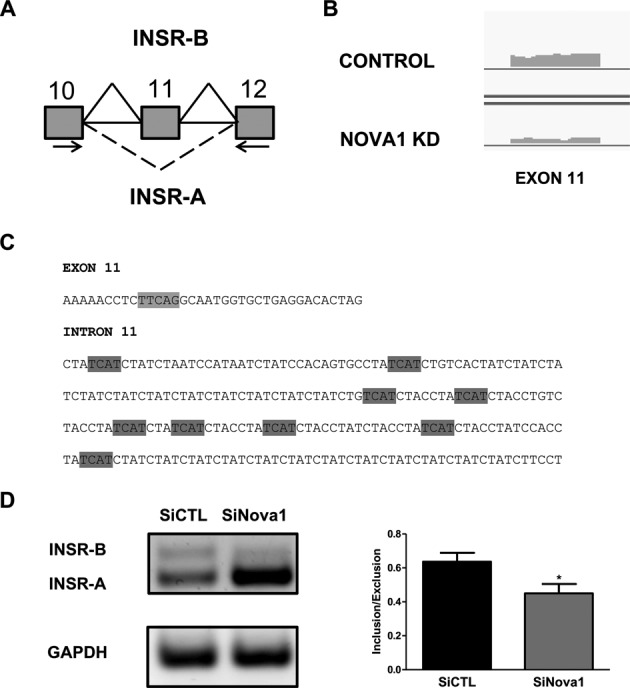
Nova1 modifies the splicing of the insulin receptor exon 11 in beta cells. (A) Schematic figure representing INSR splice variants. Arrows indicate the primers used for the analysis of exon 11. (B) Representative scheme of the RNA-seq reads covering INSR exon 11 in control and Nova1 KD preparations. (C) Sequences of INSR exon 11 and intron 11. Potential binding sites identified for Nova1 are highlighted in gray. (D) INS-1E cells were transfected with siCTL or siNova1 and collected after 48 h for mRNA analysis. INSR exon 11 splicing was evaluated by RT-PCR. The agarose gel is representative of three independent experiments. The percentage of inclusion/exclusion of exon 11 is shown in the graph. *P < 0.05 versus siCTL by paired t-test.
Nova1 KD increases basal and cytokine-induced apoptosis
The expression of Nova1 was significantly decreased when rat beta cells were exposed to the pro-inflammatory cytokines IL-1β + IFN-γ (Figure 6A). These cytokines induce beta cell death via the intrinsic pathway of apoptosis (37,57), and we next examined whether inhibition of Nova1 by specific siRNAs also led to beta cell apoptosis.
Figure 6.
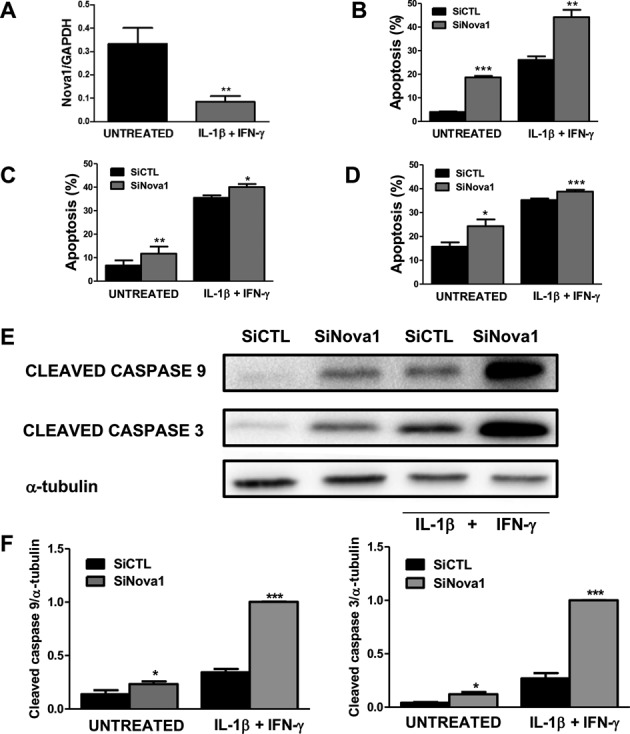
Nova1 KD increases apoptosis under basal condition and following cytokine treatment. Primary rat beta cells were exposed to the pro-inflammatory cytokines IL-1β + IFN-γ for 48 h and then collected for mRNA expression analyses. Results are mean ± SEM (n = 8). **P < 0.01 versus untreated by paired t-test (A). After transfection with siRNA control or siRNA Nova1 (> 50% inhibition of Nova1 expression in the three cell types) INS-1E cells (B, E, F), FACS-purified primary rat beta cells (C) and dispersed human islets (D) were exposed or not to cytokines (n = 4). After 24 h for INS-1E cells or 48 h for primary beta cells or dispersed human islets, apoptosis was evaluated. (E) Cleaved caspases-9 and -3 expression after Nova1 KD. Blots are representative of four independent experiments. α-tubulin was used as a control for protein loading. (F) Densitometry analysis of western blot for cleaved caspases 9 and 3 normalized by the housekeeping protein α-tubulin. Results are mean ± SEM (n = 4). *P < 0.05, **P < 0.01 or ***P < 0.001 versus siCTL untreated or after cytokine treatment by paired t-test.
Nova1 KD (Supplementary Figure S4) increased basal and cytokine-induced apoptosis in INS-1E cells, FACS-purified rat primary beta cells and dispersed human islets (Figure 6B, C and D, respectively), suggesting a key role of Nova1 for maintenance of beta cell viability. Apoptosis secondary to Nova1 KD, with or without concomitant exposure to pro-inflammatory cytokines, was mediated by the intrinsic (mitochondrial) pathway of apoptosis, as suggested by increased cleavage of caspases 9 and 3 in INS-1E cells (Figure 6E and F).
Beta cell survival is critically dependent on the balance between anti- and pro-apoptotic Bcl-2 proteins (37). The BH3-only protein Bim is an important mediator of cytokine-induced beta cell apoptosis (58) and Nova1 KD induced Bim protein expression (Figure 7A and B). Bim has three main isoforms generated by AS, namely BimEL, BimL and BimS (59), and Nova1 KD induced a similar increase in these three isoforms (the blots are quantified in Figure 7B).
Figure 7.
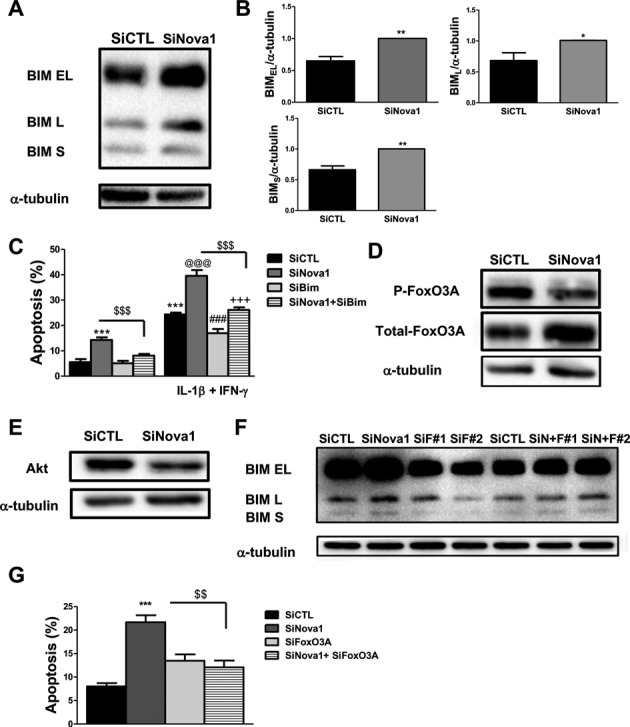
Bim mediates the potentiation of apoptosis in Nova1-deficient cells. INS-1E cells were transfected with control or Nova1 siRNAs. After 48 h, cells were collected for western blot analysis. (A) One representative western blot of Bim variants expression is shown. (B) Densitometry analysis of the western blots for Bim splicing variants. Results are mean ± SEM (n = 5). *P < 0.05 or **P < 0.01 versus siCTL by paired t-test. (C) INS-1E cells transfected with control, Nova1 and Bim siRNAs were exposed to cytokines for 24 h; apoptosis was then measured using nuclear dyes. Results are mean ± SEM (n = 5). ***P < 0.001 versus siCTL without cytokines; @@@P < 0.001 versus siNova1, ###P < 0.001 versus siBim; +++P < 0.001 versus siNova1 + siBim; $$$P < 0.001 as indicated by the bars. ANOVA followed by paired t-test with Bonferroni's correction. (D) Western blot of total-FoxO3A and P-FoxO3A after Nova1 KD. α-tubulin was used as a control for protein loading. Blots are representative of five experiments. (E) Western blot of Akt after Nova1 KD is shown. α-tubulin was used as a control for protein loading. The blot is representative of four experiments. (F) Western blot showing Bim expression after Nova1 KD, FoxO3A KD (with two different siRNAs F#1 and F#2) and the double KD of Nova1 and FoxO3A (n = 3). (G) Apoptosis was measured using nuclear dyes after Nova1 KD, FoxO3A KD and the double KD of Nova1 and FoxO3A. Results are mean ± SEM (n = 4). ***P < 0.001 versus siCTL and $$P < 0.01 as indicated by the bars. ANOVA followed by paired t-test with Bonferroni's correction.
To confirm the role of Bim in Nova1 KD-induced apoptosis, we performed a double KD of Nova1 and Bim. We have previously shown that this Bim siRNA markedly decreases the expression of the three splice variants of Bim in cytokine-treated INS-1E cells (58), which was presently confirmed, with a Bim depletion >50% (data not shown). Silencing of Bim abrogated the basal and cytokine-induced increase in apoptosis by Nova1 KD (Figure 7C), supporting a role for Bim in the observed increase in beta cell apoptosis following Nova1 KD.
Nova1 silencing modifies the expression of the transcription factors FoxO1 and FoxO3A
The RNA-seq analysis indicated that Nova1 KD modifies the expression of members of the FoxO family of transcription factors, whose activity is regulated by the insulin receptor signaling pathway (54,55). The RNA-seq data showed an up-regulation of the expression of FoxO1 after Nova1 KD. This result was confirmed by qRT-PCR in INS-1E cells (Supplementary Figure S5A). Of interest, there was also an increase in the expression of FoxO3A after Nova1 KD. FoxO3A is a transcription factor directly involved in Bim transcription (60) and we confirmed by western blot the up-regulation of total-FoxO3A (Figure 7D and Supplementary Figure S5B), paralleled by a decrease in expression of the phosphorylated form after Nova1 KD (Figure 7D and Supplementary Figure S5C). FoxO family of transcription factors are downstream targets of the serine/threonine protein kinase B (PKB)/Akt (61). We observed a decrease in the expression of Akt after Nova1 KD which may affect FoxO3A phosphorylation (Figure 7E and Supplementary Figure S5D). Double KD of FoxO3A and Nova1 resulted in a decrease in Bim protein expression (Figure 7F) and cell death (Figure 7G), suggesting that Nova1 regulates Bim expression and cell death at least in part via modulation of FoxO3A.
DISCUSSION
We have presently coupled KD of the splicing factor Nova1 with deep sequencing of the rat transcriptome to determine the nature of the transcripts modulated by Nova1 in FACS-purified pancreatic beta cells. Nova1 was previously described as a ‘neuron-specific’ splicing factor (12,14,19), but we presently show that it has also a major role in pancreatic beta cell AS, function and viability.
Nova1 is expressed in human islets at levels comparable to brain; this expression is >10-fold higher than in other tissues (8). The present transcriptome data suggest that Nova1 is indeed a master regulator of splicing in pancreatic beta cells, modifying the splicing of nearly 5000 transcripts. Of interest, 80% of the genes previously identified as Nova1-regulated in mouse brain (20) and expressed in pancreatic beta cells are also modulated by this splicing factor in rat beta cells. Nova1 binds to the YCAY motif in brain. This motif appears in clusters in the vicinity of intron-exon junctions (20,42) and we have observed more significant YCAY clusters in the downstream regions of down-regulated exons compared to randomly selected exons.
We have confirmed in independent experiments that Nova1 regulates AS of Gabrg2 and Snap25 in pancreatic beta cells. AS of these two mRNAs is regulated by Nova1 in the brain (20). These findings are in agreement with previous observations indicating that beta cells share expression of a large number of genes and proteins with the central nervous system (45,62,63).
Pathway analysis revealed that Nova1 target genes are implicated in crucial beta cell functions such as exocytosis, transcription, insulin receptor signaling, splicing and apoptosis and we confirmed in independent experiments the changes in splicing of 10 genes involved in these functions following Nova1 KD. The fact that splicing is one of the key pathways identified as Nova1-regulated is in line with the above-described impact of Nova1 in AS and serves as an internal validation of the present approach.
We initially confirmed that the observed modulation of exocytosis by Nova1 KD is accompanied by a decrease in insulin secretion and the voltage-dependent Ca2+ current, while there is no change in glucose metabolism. Two genes potentially involved in the regulation of insulin secretion, namely PLCβ1 (50) and Snap25 (48,51,64) were identified by the RNA-seq analysis and in independent confirmation experiments using RT-PCR, as target genes of Nova1 in pancreatic beta cells (present data). In order to demonstrate a direct contribution of Nova1-regulated splicing events in a key pancreatic beta cell function, we performed KD of the Snap25 splice variant b, the variant decreased after Nova1 KD (Figure 3E) and the most effective one in mediating Ca2+-triggered secretion (52). This decreased glucose-induced insulin release is similar to the decreased release observed after Nova1 KD. The level of decrease observed after Snap25 splice variant b KD, however, it is not as marked as when Nova1 is KD probably due to the fact that Snap25 is not the only exocytosis-related gene modified following Nova1 KD.
Progressive pancreatic beta cell apoptosis induced by pro-inflammatory cytokines and invading immune cells is a central phenomenon in the development of type 1 diabetes (57). Interestingly, the cytokines IL-1β + IFN-γ inhibited Nova1 expression in rat beta cells, and Nova1 silencing by specific siRNAs, alone or in combination with cytokines, resulted in apoptosis in INS-1E cells, primary rat beta cells and dispersed human islets, indicating an important role for Nova1 in the maintenance of beta cell viability. In line with these observations, Nova1 null mice die postnatally from a motor deficit associated with apoptotic death of spinal and brainstem neurons (23). Apoptosis secondary to Nova1 KD in beta cells is mediated by the intrinsic (mitochondrial) pathway of apoptosis via up-regulation of the BH3-only protein Bim (present data). Bim has been previously shown to play a central role in cytokine (58)-, virus (65)- and high glucose (66,67)-induced beta cell death. Bim transcription is regulated by the transcription factor FoxO3A in breast cancer cell lines (60), and FoxO3A phosphorylation inhibits its transcriptional activity (61). We presently observed that KD of Nova1 up-regulates the expression of FoxO3A and decreases its phosphorylation, potentially leading to an accrued activation of this transcription factor. FoxO family of transcription factors are downstream targets of the serine/threonine protein kinase B (PKB)/Akt (61). We observed a decrease in the expression of Akt after Nova1 KD which may mediate the impact of Nova1 on the observed FoxO3A phosphorylation. The parallel KD of Nova1 and FoxO3A prevents both up-regulation of Bim and beta cell apoptosis, indicating that FoxO3A is a key downstream target of Nova1.
An intriguing finding of the present study is that Nova1 regulates the splicing of the insulin receptor, favoring the expression of the INSR-A isoform following Nova1 silencing. We have identified Nova1 potential binding sites in the exon 11 and the intron 11 of INSR. It has been described that the splicing factor Mbnl1 promotes insulin receptor exon 11 inclusion (68) and that potential binding sites for Nova1 are present in the intron 11 (68). Inclusion of INSR exon 11 is both developmentally and hormonally regulated and it is altered in type 2 diabetes, myotonic dystrophy, aging and cancer (69–72). Neonatal hepatocytes expressing only INSR-B have increased cell death via the extrinsic pathway of apoptosis, as suggested by caspases-8 and -3 activation, while the mitochondrial or intrinsic branch of apoptosis is activated in neonatal hepatocytes expressing INSR-A (73). These observations suggest that dysregulation of INSR AS secondary to Nova1 KD may be one of the factors contributing to beta cell apoptosis.
The fact that Nova1 regulates the splicing and expression of several transcription factors may explain why the KD of Nova1 modifies such a large number of transcripts in pancreatic beta cells. These transcript changes may thus be at least in part a secondary effect of Nova1 KD, independent of the presence of the Nova1 binding motif YCAY in the modified genes. There are increasing studies supporting functional links between transcription and pre-mRNA splicing (74). Splicing factors can promote transcriptional elongation directly, as demonstrated for the splicing factor SC35 (75), while the presence of an intron or a splice site immediately downstream of a promoter enhances transcription (76), suggesting that factors controlling intron removal are important for physiological transcription. Moreover, U1 snRNA (a member of the spliceosome) associates with the general transcription factor TFIIH, thus regulating transcription by pol II besides its role in splicing (77).
The present data indicate that Nova1 has a major role in beta cell function, controlling the splicing and expression of key genes involved in transcription, insulin release and apoptosis. These findings identify a novel layer of regulation of beta cell function, namely AS controlled by key splicing regulators such as Nova1. Modifications in AS can directly cause disease, modify its severity and/or confer susceptibility to pathogenic stimuli (6,72,78–80). Furthermore, inflammation-modified AS may increase antigenicity by favoring expression of novel antigenic epitopes, modulating surface location or altering post-translational modifications, as shown in other autoimmune diseases (4,5). The regulation and role of AS in pancreatic beta cells is ‘terra incognita’. The present data provides the first chart of this new territory.
SUPPLEMENTARY DATA
Supplementary Data are available at NAR Online.
Acknowledgments
We are grateful to the personnel from the Laboratory of Experimental Medicine and the ULB-Center for Diabetes Research, I. Millard, A. Musuaya, M. Pangerl, S. Mertens and C. Dubois and to Anna-Maria Veljanovska-Ramsay from Lund University for excellent technical support.
Authors Contributions: D.L.E., O.V., L.E., M.S. and P.M. contributed to the study concept and design; O.V., J.V.T., L.G.M., F.A.G., T.C.N., D.A.C., T.R.N., V.A.S., L.M. and J.L.S.E. acquired the data; D.L.E. supervised the study; O.V. and D.L.E. drafted the manuscript; all authors revised the article and approved the final version to be published
FUNDING
Juvenile Diabetes Research Foundation (JDRF); European Union (projects NAIMIT and BetaBat, in the Framework Program 7 of the European Community); Fonds National de la Recherche Scientifique (FNRS); Belgium, Actions de Recherche Concertée de la Communauté Française (ARC); Belgium (to D.L.E.); Swedish research council (to L.E.); Swedish Diabetes Association (to L.E.). L.E. is a senior researcher at the Swedish Research Council. Funding for open access charge: NAIMIT.
Conflict of interest statement. None declared.
REFERENCES
- 1.Pan Q., Shai O., Lee L.J., Frey B.J., Blencowe B.J. Deep surveying of alternative splicing complexity in the human transcriptome by high-throughput sequencing. Nat. Genet. 2008;40:1413–1415. doi: 10.1038/ng.259. [DOI] [PubMed] [Google Scholar]
- 2.Modrek B., Lee C. A genomic view of alternative splicing. Nat. Genet. 2002;30:13–19. doi: 10.1038/ng0102-13. [DOI] [PubMed] [Google Scholar]
- 3.Diez J., Park Y., Zeller M., Brown D., Garza D., Ricordi C., Hutton J., Eisenbarth G.S., Pugliese A. Differential splicing of the IA-2 mRNA in pancreas and lymphoid organs as a permissive genetic mechanism for autoimmunity against the IA-2 type 1 diabetes autoantigen. Diabetes. 2001;50:895–900. doi: 10.2337/diabetes.50.4.895. [DOI] [PubMed] [Google Scholar]
- 4.Ng B., Yang F., Huston D.P., Yan Y., Yang Y., Xiong Z., Peterson L.E., Wang H., Yang X.F. Increased noncanonical splicing of autoantigen transcripts provides the structural basis for expression of untolerized epitopes. J. Allergy Clin. Immunol. 2004;114:1463–1470. doi: 10.1016/j.jaci.2004.09.006. [DOI] [PMC free article] [PubMed] [Google Scholar]
- 5.Yang F., Chen I.H., Xiong Z., Yan Y., Wang H., Yang X.F. Model of stimulation-responsive splicing and strategies in identification of immunogenic isoforms of tumor antigens and autoantigens. Clin. Immunol. 2006;121:121–133. doi: 10.1016/j.clim.2006.06.007. [DOI] [PubMed] [Google Scholar]
- 6.Evsyukova I., Somarelli J.A., Gregory S.G., Garcia-Blanco M.A. Alternative splicing in multiple sclerosis and other autoimmune diseases. RNA Biol. 2010;7:462–473. doi: 10.4161/rna.7.4.12301. [DOI] [PMC free article] [PubMed] [Google Scholar]
- 7.Tian Y., Apperson M.L., Ander B.P., Liu D., Stomova B.S., Jickling G.C., Enriquez R., Agius M.A., Sharp F.R. Differences in exon expression and alternatively spliced genes in blood of multiple sclerosis compared to healthy control subjects. J. Neuroimmunol. 2011;230:124–129. doi: 10.1016/j.jneuroim.2010.09.001. [DOI] [PubMed] [Google Scholar]
- 8.Eizirik D.L., Sammeth M., Bouckenooghe T., Bottu G., Sisino G., Igoillo-Esteve M., Ortis F., Santin I., Colli M.L., Barthson J., et al. The human pancreatic islet transcriptome: expression of candidate genes for type 1 diabetes and the impact of pro-inflammatory cytokines. PLoS Genet. 2012;8:e1002552. doi: 10.1371/journal.pgen.1002552. [DOI] [PMC free article] [PubMed] [Google Scholar]
- 9.Nogueira T.C., Paula F.M., Villate O., Colli M.L., Moura R.F., Cunha D.A., Marselli L., Marchetti P., Cnop M., Julier C., et al. GLIS3, a susceptibility gene for type 1 and type 2 diabetes, modulates pancreatic beta cell apoptosis via regulation of a splice variant of the BH3-only protein Bim. PLoS Genet. 2013;9:e1003532. doi: 10.1371/journal.pgen.1003532. [DOI] [PMC free article] [PubMed] [Google Scholar]
- 10.Hanamura A., Caceres J.F., Mayeda A., Franza B.R., Jr, Krainer A.R. Regulated tissue-specific expression of antagonistic pre-mRNA splicing factors. RNA. 1998;4:430–444. [PMC free article] [PubMed] [Google Scholar]
- 11.Buckanovich R.J., Posner J.B., Darnell R.B. Nova, the paraneoplastic Ri antigen, is homologous to an RNA-binding protein and is specifically expressed in the developing motor system. Neuron. 1993;11:657–672. doi: 10.1016/0896-6273(93)90077-5. [DOI] [PubMed] [Google Scholar]
- 12.Teplova M., Malinina L., Darnell J.C., Song J., Lu M., Abagyan R., Musunuru K., Teplov A., Burley S.K., Darnell R.B., et al. Protein-RNA and protein-protein recognition by dual KH1/2 domains of the neuronal splicing factor Nova-1. Structure. 2011;19:930–944. doi: 10.1016/j.str.2011.05.002. [DOI] [PMC free article] [PubMed] [Google Scholar]
- 13.Ule J., Jensen K.B., Ruggiu M., Mele A., Ule A., Darnell R.B. CLIP identifies Nova-regulated RNA networks in the brain. Science. 2003;302:1212–1215. doi: 10.1126/science.1090095. [DOI] [PubMed] [Google Scholar]
- 14.Buckanovich R.J., Darnell R.B. The neuronal RNA binding protein Nova-1 recognizes specific RNA targets in vitro and in vivo. Mol. Cell Biol. 1997;17:3194–3201. doi: 10.1128/mcb.17.6.3194. [DOI] [PMC free article] [PubMed] [Google Scholar]
- 15.Jensen K.B., Musunuru K., Lewis H.A., Burley S.K., Darnell R.B. The tetranucleotide UCAY directs the specific recognition of RNA by the Nova K-homology 3 domain. Proc. Natl. Acad. Sci. U.S.A. 2000;97:5740–5745. doi: 10.1073/pnas.090553997. [DOI] [PMC free article] [PubMed] [Google Scholar]
- 16.Lewis H.A., Musunuru K., Jensen K.B., Edo C., Chen H., Darnell R.B., Burley S.K. Sequence-specific RNA binding by a Nova KH domain: implications for paraneoplastic disease and the fragile X syndrome. Cell. 2000;100:323–332. doi: 10.1016/s0092-8674(00)80668-6. [DOI] [PubMed] [Google Scholar]
- 17.Ule J., Darnell R.B. RNA binding proteins and the regulation of neuronal synaptic plasticity. Curr. Opin. Neurobiol. 2006;16:102–110. doi: 10.1016/j.conb.2006.01.003. [DOI] [PubMed] [Google Scholar]
- 18.Licatalosi D.D., Mele A., Fak J.J., Ule J., Kayikci M., Chi S.W., Clark T.A., Schweitzer A.C., Blume J.E., Wang X., et al. HITS-CLIP yields genome-wide insights into brain alternative RNA processing. Nature. 2008;456:464–469. doi: 10.1038/nature07488. [DOI] [PMC free article] [PubMed] [Google Scholar]
- 19.Ule J., Ule A., Spencer J., Williams A., Hu J.S., Cline M., Wang H., Clark T., Fraser C., Ruggiu M., et al. Nova regulates brain-specific splicing to shape the synapse. Nat. Genet. 2005;37:844–852. doi: 10.1038/ng1610. [DOI] [PubMed] [Google Scholar]
- 20.Zhang C., Frias M.A., Mele A., Ruggiu M., Eom T., Marney C.B., Wang H., Licatalosi D.D., Fak J.J., Darnell R.B. Integrative modeling defines the Nova splicing-regulatory network and its combinatorial controls. Science. 2010;329:439–443. doi: 10.1126/science.1191150. [DOI] [PMC free article] [PubMed] [Google Scholar]
- 21.Dredge B.K., Darnell R.B. Nova regulates GABA(A) receptor γ2 alternative splicing via a distal downstream UCAU-rich intronic splicing enhancer. Mol. Cell Biol. 2003;23:4687–4700. doi: 10.1128/MCB.23.13.4687-4700.2003. [DOI] [PMC free article] [PubMed] [Google Scholar]
- 22.Dredge B.K., Stefani G., Engelhard C.C., Darnell R.B. Nova autoregulation reveals dual functions in neuronal splicing. EMBO J. 2005;24:1608–1620. doi: 10.1038/sj.emboj.7600630. [DOI] [PMC free article] [PubMed] [Google Scholar]
- 23.Jensen K.B., Dredge B.K., Stefani G., Zhong R., Buckanovich R.J., Okano H.J., Yang Y.Y., Darnell R.B. Nova-1 regulates neuron-specific alternative splicing and is essential for neuronal viability. Neuron. 2000;25:359–371. doi: 10.1016/s0896-6273(00)80900-9. [DOI] [PubMed] [Google Scholar]
- 24.Polydorides A.D., Okano H.J., Yang Y.Y., Stefani G., Darnell R.B. A brain-enriched polypyrimidine tract-binding protein antagonizes the ability of Nova to regulate neuron-specific alternative splicing. Proc. Natl. Acad. Sci. U.S.A. 2000;97:6350–6355. doi: 10.1073/pnas.110128397. [DOI] [PMC free article] [PubMed] [Google Scholar]
- 25.Trapnell C., Williams B.A., Pertea G., Mortazavi A., Kwan G., van Baren M.J., Salzberg S.L., Wold B.J., Pachter L. Transcript assembly and quantification by RNA-Seq reveals unannotated transcripts and isoform switching during cell differentiation. Nat. Biotechnol. 2010;28:511–515. doi: 10.1038/nbt.1621. [DOI] [PMC free article] [PubMed] [Google Scholar]
- 26.Zhou X., Wu W., Li H., Cheng Y., Wei N., Zong J., Feng X., Xie Z., Chen D., Manley J.L. Transcriptome analysis of alternative splicing events regulated by SRSF10 reveals position-dependent splicing modulation. Nucleic Acids Res. 2014;42:4019–4030. doi: 10.1093/nar/gkt1387. [DOI] [PMC free article] [PubMed] [Google Scholar]
- 27.Asfari M., Janjic D., Meda P., Li G., Halban P.A., Wollheim C.B. Establishment of 2-mercaptoethanol-dependent differentiated insulin-secreting cell lines. Endocrinology. 1992;130:167–178. doi: 10.1210/endo.130.1.1370150. [DOI] [PubMed] [Google Scholar]
- 28.Cardozo A.K., Ortis F., Storling J., Feng Y.M., Rasschaert J., Tonnesen M., Van E.F., Mandrup-Poulsen T., Herchuelz A., Eizirik D.L. Cytokines downregulate the sarcoendoplasmic reticulum pump Ca2+ ATPase 2b and deplete endoplasmic reticulum Ca2+, leading to induction of endoplasmic reticulum stress in pancreatic beta cells. Diabetes. 2005;54:452–461. doi: 10.2337/diabetes.54.2.452. [DOI] [PubMed] [Google Scholar]
- 29.Cunha D.A., Hekerman P., Ladriere L., Bazarra-Castro A., Ortis F., Wakeham M.C., Moore F., Rasschaert J., Cardozo A.K., Bellomo E., et al. Initiation and execution of lipotoxic ER stress in pancreatic beta cells. J. Cell Sci. 2008;121:2308–2318. doi: 10.1242/jcs.026062. [DOI] [PMC free article] [PubMed] [Google Scholar]
- 30.Marchetti P., Bugliani M., Lupi R., Marselli L., Masini M., Boggi U., Filipponi F., Weir G.C., Eizirik D.L., Cnop M. The endoplasmic reticulum in pancreatic beta cells of type 2 diabetes patients. Diabetologia. 2007;50:2486–2494. doi: 10.1007/s00125-007-0816-8. [DOI] [PubMed] [Google Scholar]
- 31.Moore F., Colli M.L., Cnop M., Esteve M.I., Cardozo A.K., Cunha D.A., Bugliani M., Marchetti P., Eizirik D.L. PTPN2, a candidate gene for type 1 diabetes, modulates interferon-γ-induced pancreatic beta cell apoptosis. Diabetes. 2009;58:1283–1291. doi: 10.2337/db08-1510. [DOI] [PMC free article] [PubMed] [Google Scholar]
- 32.Eizirik D.L., Mandrup-Poulsen T. A choice of death–the signal-transduction of immune-mediated beta cell apoptosis. Diabetologia. 2001;44:2115–2133. doi: 10.1007/s001250100021. [DOI] [PubMed] [Google Scholar]
- 33.Kutlu B., Darville M.I., Cardozo A.K., Eizirik D.L. Molecular regulation of monocyte chemoattractant protein-1 expression in pancreatic beta cells. Diabetes. 2003;52:348–355. doi: 10.2337/diabetes.52.2.348. [DOI] [PubMed] [Google Scholar]
- 34.Ortis F., Cardozo A.K., Crispim D., Storling J., Mandrup-Poulsen T., Eizirik D.L. Cytokine-induced proapoptotic gene expression in insulin-producing cells is related to rapid, sustained, and nonoscillatory nuclear factor-κB activation. Mol. Endocrinol. 2006;20:1867–1879. doi: 10.1210/me.2005-0268. [DOI] [PubMed] [Google Scholar]
- 35.Moore F., Cunha D.A., Mulder H., Eizirik D.L. Use of RNA interference to investigate cytokine signal transduction in pancreatic beta cells. Methods Mol. Biol. 2012;820:179–194. doi: 10.1007/978-1-61779-439-1_11. [DOI] [PubMed] [Google Scholar]
- 36.Moore F., Santin I., Nogueira T.C., Gurzov E.N., Marselli L., Marchetti P., Eizirik D.L. The transcription factor C/EBP δ has anti-apoptotic and anti-inflammatory roles in pancreatic beta cells. PLoS One. 2012;7:e31062. doi: 10.1371/journal.pone.0031062. [DOI] [PMC free article] [PubMed] [Google Scholar]
- 37.Gurzov E.N., Eizirik D.L. Bcl-2 proteins in diabetes: mitochondrial pathways of beta cell death and dysfunction. Trends Cell Biol. 2011;21:424–431. doi: 10.1016/j.tcb.2011.03.001. [DOI] [PubMed] [Google Scholar]
- 38.Flicek P., Amode M.R., Barrell D., Beal K., Billis K., Brent S., Carvalho-Silva D., Clapham P., Coates G., Fitzgerald S., et al. Ensembl 2014. Nucleic Acids Res. 2014;42:D749–D755. doi: 10.1093/nar/gkt1196. [DOI] [PMC free article] [PubMed] [Google Scholar]
- 39.Montgomery S.B., Sammeth M., Gutierrez-Arcelus M., Lach R.P., Ingle C., Nisbett J., Guigo R., Dermitzakis E.T. Transcriptome genetics using second generation sequencing in a Caucasian population. Nature. 2010;464:773–777. doi: 10.1038/nature08903. [DOI] [PMC free article] [PubMed] [Google Scholar]
- 40.Mortazavi A., Williams B.A., McCue K., Schaeffer L., Wold B. Mapping and quantifying mammalian transcriptomes by RNA-Seq. Nat. Methods. 2008;5:621–628. doi: 10.1038/nmeth.1226. [DOI] [PubMed] [Google Scholar]
- 41.Dennis G., Jr, Sherman B.T., Hosack D.A., Yang J., Gao W., Lane H.C., Lempicki R.A. DAVID: database for annotation, visualization, and integrated discovery. Genome Biol. 2003;4:3. [PubMed] [Google Scholar]
- 42.Ule J., Stefani G., Mele A., Ruggiu M., Wang X., Taneri B., Gaasterland T., Blencowe B.J., Darnell R.B. An RNA map predicting Nova-dependent splicing regulation. Nature. 2006;444:580–586. doi: 10.1038/nature05304. [DOI] [PubMed] [Google Scholar]
- 43.Thomas-Chollier M., Sand O., Turatsinze J.V., Janky R., Defrance M., Vervisch E., Brohee S., van H.J. RSAT: regulatory sequence analysis tools. Nucleic Acids Res. 2008;36:W119–W127. doi: 10.1093/nar/gkn304. [DOI] [PMC free article] [PubMed] [Google Scholar]
- 44.Turatsinze J.V., Thomas-Chollier M., Defrance M., van H.J. Using RSAT to scan genome sequences for transcription factor binding sites and cis-regulatory modules. Nat. Protoc. 2008;3:1578–1588. doi: 10.1038/nprot.2008.97. [DOI] [PubMed] [Google Scholar]
- 45.Cardozo A.K., Berthou L., Kruhoffer M., Orntoft T., Nicolls M.R., Eizirik D.L. Gene microarray study corroborates proteomic findings in rodent islet cells. J. Proteome Res. 2003;2:553–555. doi: 10.1021/pr034029o. [DOI] [PubMed] [Google Scholar]
- 46.Kharroubi I., Rasschaert J., Eizirik D.L., Cnop M. Expression of adiponectin receptors in pancreatic beta cells. Biochem. Biophys. Res. Commun. 2003;312:1118–1122. doi: 10.1016/j.bbrc.2003.11.042. [DOI] [PubMed] [Google Scholar]
- 47.Eizirik D.L., Sandler S., Sener A., Malaisse W.J. Defective catabolism of D-glucose and L-glutamine in mouse pancreatic islets maintained in culture after streptozotocin exposure. Endocrinology. 1988;123:1001–1007. doi: 10.1210/endo-123-2-1001. [DOI] [PubMed] [Google Scholar]
- 48.Vikman J., Ma X., Hockerman G.H., Rorsman P., Eliasson L. Antibody inhibition of synaptosomal protein of 25 kDa (SNAP-25) and syntaxin 1 reduces rapid exocytosis in insulin-secreting cells. J. Mol. Endocrinol. 2006;36:503–515. doi: 10.1677/jme.1.01978. [DOI] [PubMed] [Google Scholar]
- 49.Ammala C., Eliasson L., Bokvist K., Larsson O., Ashcroft F.M., Rorsman P. Exocytosis elicited by action potentials and voltage-clamp calcium currents in individual mouse pancreatic B-cells. J. Physiol. 1993;472:665–688. doi: 10.1113/jphysiol.1993.sp019966. [DOI] [PMC free article] [PubMed] [Google Scholar]
- 50.Fiume R., Ramazzotti G., Faenza I., Piazzi M., Bavelloni A., Billi A.M., Cocco L. Nuclear PLCs affect insulin secretion by targeting PPARγ in pancreatic beta cells. FASEB J. 2012;26:203–210. doi: 10.1096/fj.11-186510. [DOI] [PubMed] [Google Scholar]
- 51.Sadoul K., Lang J., Montecucco C., Weller U., Regazzi R., Catsicas S., Wollheim C.B., Halban P.A. SNAP-25 is expressed in islets of Langerhans and is involved in insulin release. J. Cell Biol. 1995;128:1019–1028. doi: 10.1083/jcb.128.6.1019. [DOI] [PMC free article] [PubMed] [Google Scholar]
- 52.Sorensen J.B., Nagy G., Varoqueaux F., Nehring R.B., Brose N., Wilson M.C., Neher E. Differential control of the releasable vesicle pools by SNAP-25 splice variants and SNAP-23. Cell. 2003;114:75–86. doi: 10.1016/s0092-8674(03)00477-x. [DOI] [PubMed] [Google Scholar]
- 53.Bark C., Bellinger F.P., Kaushal A., Mathews J.R., Partridge L.D., Wilson M.C. Developmentally regulated switch in alternatively spliced SNAP-25 isoforms alters facilitation of synaptic transmission. J. Neurosci. 2004;24:8796–8805. doi: 10.1523/JNEUROSCI.1940-04.2004. [DOI] [PMC free article] [PubMed] [Google Scholar]
- 54.Belfiore A., Frasca F., Pandini G., Sciacca L., Vigneri R. Insulin receptor isoforms and insulin receptor/insulin-like growth factor receptor hybrids in physiology and disease. Endocr. Rev. 2009;30:586–623. doi: 10.1210/er.2008-0047. [DOI] [PubMed] [Google Scholar]
- 55.Martinez S.C., Cras-Meneur C., Bernal-Mizrachi E., Permutt M.A. Glucose regulates Foxo1 through insulin receptor signaling in the pancreatic islet beta cell. Diabetes. 2006;55:1581–1591. doi: 10.2337/db05-0678. [DOI] [PubMed] [Google Scholar]
- 56.Kosaki A., Pillay T.S., Xu L., Webster N.J. The B isoform of the insulin receptor signals more efficiently than the A isoform in HepG2 cells. J. Biol. Chem. 1995;270:20816–20823. doi: 10.1074/jbc.270.35.20816. [DOI] [PubMed] [Google Scholar]
- 57.Eizirik D.L., Colli M.L., Ortis F. The role of inflammation in insulitis and beta cell loss in type 1 diabetes. Nat. Rev. Endocrinol. 2009;5:219–226. doi: 10.1038/nrendo.2009.21. [DOI] [PubMed] [Google Scholar]
- 58.Barthson J., Germano C.M., Moore F., Maida A., Drucker D.J., Marchetti P., Gysemans C., Mathieu C., Nunez G., Jurisicova A., et al. Cytokines tumor necrosis factor-α and interferon-γ induce pancreatic beta cell apoptosis through STAT1-mediated Bim protein activation. J. Biol. Chem. 2011;286:39632–39643. doi: 10.1074/jbc.M111.253591. [DOI] [PMC free article] [PubMed] [Google Scholar]
- 59.O'Connor L., Strasser A., O'Reilly L.A., Hausmann G., Adams J.M., Cory S., Huang D.C. Bim: a novel member of the Bcl-2 family that promotes apoptosis. EMBO J. 1998;17:384–395. doi: 10.1093/emboj/17.2.384. [DOI] [PMC free article] [PubMed] [Google Scholar]
- 60.Sunters A., Fernandez de M.S., Stahl M., Brosens J.J., Zoumpoulidou G., Saunders C.A., Coffer P.J., Medema R.H., Coombes R.C., Lam E.W. FoxO3a transcriptional regulation of Bim controls apoptosis in paclitaxel-treated breast cancer cell lines. J. Biol. Chem. 2003;278:49795–49805. doi: 10.1074/jbc.M309523200. [DOI] [PubMed] [Google Scholar]
- 61.Zhang X., Tang N., Hadden T.J., Rishi A.K. Akt, FoxO and regulation of apoptosis. Biochim. Biophys. Acta. 2011;1813:1978–1986. doi: 10.1016/j.bbamcr.2011.03.010. [DOI] [PubMed] [Google Scholar]
- 62.Atouf F., Czernichow P., Scharfmann R. Expression of neuronal traits in pancreatic beta cells. Implication of neuron-restrictive silencing factor/repressor element silencing transcription factor, a neuron-restrictive silencer. J. Biol. Chem. 1997;272:1929–1934. doi: 10.1074/jbc.272.3.1929. [DOI] [PubMed] [Google Scholar]
- 63.Suckow A.T., Comoletti D., Waldrop M.A., Mosedale M., Egodage S., Taylor P., Chessler S.D. Expression of neurexin, neuroligin, and their cytoplasmic binding partners in the pancreatic beta cells and the involvement of neuroligin in insulin secretion. Endocrinology. 2008;149:6006–6017. doi: 10.1210/en.2008-0274. [DOI] [PMC free article] [PubMed] [Google Scholar]
- 64.Vikman J., Svensson H., Huang Y.C., Kang Y., Andersson S.A., Gaisano H.Y., Eliasson L. Truncation of SNAP-25 reduces the stimulatory action of cAMP on rapid exocytosis in insulin-secreting cells. Am. J. Physiol Endocrinol. Metab. 2009;297:E452–E461. doi: 10.1152/ajpendo.90585.2008. [DOI] [PubMed] [Google Scholar]
- 65.Colli M.L., Nogueira T.C., Allagnat F., Cunha D.A., Gurzov E.N., Cardozo A.K., Roivainen M., Op de B.A., Eizirik D.L. Exposure to the viral by-product dsRNA or Coxsackievirus B5 triggers pancreatic beta cell apoptosis via a Bim/Mcl-1 imbalance. PLoS Pathog. 2011;7:e1002267. doi: 10.1371/journal.ppat.1002267. [DOI] [PMC free article] [PubMed] [Google Scholar]
- 66.McKenzie M.D., Jamieson E., Jansen E.S., Scott C.L., Huang D.C., Bouillet P., Allison J., Kay T.W., Strasser A., Thomas H.E. Glucose induces pancreatic islet cell apoptosis that requires the BH3-only proteins Bim and Puma and multi-BH domain protein Bax. Diabetes. 2010;59:644–652. doi: 10.2337/db09-1151. [DOI] [PMC free article] [PubMed] [Google Scholar]
- 67.Wali J.A., Rondas D., McKenzie M.D., Zhao Y., Elkerbout L., Fynch S., Gurzov E.N., Akira S., Mathieu C., Kay T.W. The proapoptotic BH3-only proteins Bim and Puma are downstream of endoplasmic reticulum and mitochondrial oxidative stress in pancreatic islets in response to glucotoxicity. Cell Death. Dis. 2014;5:e1124. doi: 10.1038/cddis.2014.88. [DOI] [PMC free article] [PubMed] [Google Scholar]
- 68.Sen S., Talukdar I., Liu Y., Tam J., Reddy S., Webster N.J. Muscleblind-like 1 (Mbnl1) promotes insulin receptor exon 11 inclusion via binding to a downstream evolutionarily conserved intronic enhancer. J. Biol. Chem. 2010;285:25426–25437. doi: 10.1074/jbc.M109.095224. [DOI] [PMC free article] [PubMed] [Google Scholar]
- 69.Kellerer M., Sesti G., Seffer E., Obermaier-Kusser B., Pongratz D.E., Mosthaf L., Haring H.U. Altered pattern of insulin receptor isotypes in skeletal muscle membranes of type 2 (non-insulin-dependent) diabetic subjects. Diabetologia. 1993;36:628–632. doi: 10.1007/BF00404072. [DOI] [PubMed] [Google Scholar]
- 70.Kosaki A., Webster N.J. Effect of dexamethasone on the alternative splicing of the insulin receptor mRNA and insulin action in HepG2 hepatoma cells. J. Biol. Chem. 1993;268:21990–21996. [PubMed] [Google Scholar]
- 71.Norgren S., Li L.S., Luthman H. Regulation of human insulin receptor RNA splicing in HepG2 cells: effects of glucocorticoid and low glucose concentration. Biochem. Biophys. Res. Commun. 1994;199:277–284. doi: 10.1006/bbrc.1994.1225. [DOI] [PubMed] [Google Scholar]
- 72.Savkur R.S., Philips A.V., Cooper T.A. Aberrant regulation of insulin receptor alternative splicing is associated with insulin resistance in myotonic dystrophy. Nat. Genet. 2001;29:40–47. doi: 10.1038/ng704. [DOI] [PubMed] [Google Scholar]
- 73.Nevado C., Benito M., Valverde A.M. Role of insulin receptor and balance in insulin receptor isoforms A and B in regulation of apoptosis in simian virus 40-immortalized neonatal hepatocytes. Mol. Biol. Cell. 2008;19:1185–1198. doi: 10.1091/mbc.E07-05-0473. [DOI] [PMC free article] [PubMed] [Google Scholar]
- 74.Kornblihtt A.R., de la Mata M., Fededa J.P., Munoz M.J., Nogues G. Multiple links between transcription and splicing. RNA. 2004;10:1489–1498. doi: 10.1261/rna.7100104. [DOI] [PMC free article] [PubMed] [Google Scholar]
- 75.Lin S., Coutinho-Mansfield G., Wang D., Pandit S., Fu X.D. The splicing factor SC35 has an active role in transcriptional elongation. Nat. Struct. Mol. Biol. 2008;15:819–826. doi: 10.1038/nsmb.1461. [DOI] [PMC free article] [PubMed] [Google Scholar]
- 76.Furger A., O'Sullivan J.M., Binnie A., Lee B.A., Proudfoot N.J. Promoter proximal splice sites enhance transcription. Genes Dev. 2002;16:2792–2799. doi: 10.1101/gad.983602. [DOI] [PMC free article] [PubMed] [Google Scholar]
- 77.Kwek K.Y., Murphy S., Furger A., Thomas B., O'Gorman W., Kimura H., Proudfoot N.J., Akoulitchev A. U1 snRNA associates with TFIIH and regulates transcriptional initiation. Nat. Struct. Biol. 2002;9:800–805. doi: 10.1038/nsb862. [DOI] [PubMed] [Google Scholar]
- 78.Chen M., Manley J.L. Mechanisms of alternative splicing regulation: insights from molecular and genomics approaches. Nat. Rev. Mol. Cell Biol. 2009;10:741–754. doi: 10.1038/nrm2777. [DOI] [PMC free article] [PubMed] [Google Scholar]
- 79.David C.J., Manley J.L. Alternative pre-mRNA splicing regulation in cancer: pathways and programs unhinged. Genes Dev. 2010;24:2343–2364. doi: 10.1101/gad.1973010. [DOI] [PMC free article] [PubMed] [Google Scholar]
- 80.Germann S., Gratadou L., Dutertre M., Auboeuf D. Splicing programs and cancer. J. Nucleic Acids. 2012;2012:1–9. doi: 10.1155/2012/269570. [DOI] [PMC free article] [PubMed] [Google Scholar]
Associated Data
This section collects any data citations, data availability statements, or supplementary materials included in this article.