

Abstract
Epigenetic enzymes are now targeted to treat the underlying gene expression dysregulation that contribute to disease pathogenesis. Histone deacetylases (HDACs) have shown broad potential in treatments against cancer and emerging data supports their targeting in the context of cardiovascular disease and central nervous system dysfunction. Development of a molecular agent for non-invasive imaging to elucidate the distribution and functional roles of HDACs in humans will accelerate medical research and drug discovery in this domain. Herein, we describe the synthesis and validation of an HDAC imaging agent, [11C]6. Our imaging results demonstrate that this probe has high specificity, good selectivity, and appropriate kinetics and distribution for imaging HDACs in the brain, heart, kidney, pancreas, and spleen. Our findings support the translational potential for [11C]6 for human epigenetic imaging.
Introduction
Eukaryotic cellular identity, growth, and homeostasis, extending to the level of organs, systems, and whole organisms depends in part on refined and adaptive regulatory control of gene expression. Investigation of epigenetic mechanisms—nongenetic determinants of gene expression variability—has highlighted the role of chromatin modifying enzymes in integrating environmental cues into biological effects via changes in transcriptional activity.
To date, much attention in this regard has been paid to the histone deacetylase (HDAC) family of enzymes.1−16 HDAC enzymes are divided into four different classes based on sequence homology, cellular localization, and phylogenic relationships to yeast homologues: class I (HDACs 1, 2, 3, and 8), class IIa (HDACs 4, 5, 7, and 9), class IIb (HDACs 6, 10), class III (Sirtuins 1–7), and class IV (HDAC 11). Abnormal expression levels (both increased and decreased expression) of HDAC 1, 2, 3, and 6 that have been correlated with many diseases, including several forms of cancer, heart failure, inflammatory diseases, and cognitive and psychiatric disorders (Table 1). However, our knowledge of normal HDAC density and alterations in HDACs with human disease remains extremely limited and invasive methodologies used so far to investigate HDAC distribution17,18 are not compatible with translational medicine. Therefore, our goal was to develop a positron emission tomography (PET) imaging probe, which can quantify the density of HDAC 1, 2, 3, and 6 in vivo. Evaluating the expression and distribution of epigenetic machinery in vivo will improve our understanding of their relationship with disease and would provide an opportunity to intervene with treatment.
Table 1. Selected Evidence of HDAC 1, 2, 3, and 6 Involvement in Diseases.
| disease/process | selected evidence of HDAC 1, 2, 3, and 6 involvement | refs |
|---|---|---|
| neurodegenerative disorders | HDAC 1 and 3 protein complex integrity links deficient DNA repair with neurotoxicity | (1), (2) |
| HDAC 1 expression is elevated in vulnerable brain regions of mouse disease models | (3) | |
| HDAC 2 is elevated in Alzheimer’s patient brain and negatively impacts memory in animal models | (4) | |
| HDAC 6 overexpression in patients with AD | (5) | |
| learning and memory | HDAC 1 overexpression in the prefrontal cortex disrupts working memory | (6) |
| HDAC 2 loss improves working memory and accelerates extinction learning | (7) | |
| heart failure | HDAC 1 and 2 are critical mediators of autophagy and cardiac plasticity | (8) |
| Class I HDAC enzymes alter cardiomyocyte hypertrophy via ERK kinase activity | (9) | |
| asthma | HDAC 2 deficiency in cells blunts transcriptional response to steroids and anti-inflammatory drugs. | (10) |
| cancer (general) | HDAC acetylation of p53 mediates tumor cell survival | (11) |
| breast cancer | HDAC 6 mRNA expression may have potential both as a marker of endocrine responsiveness and as a prognostic indicator in breast cancer | (12) |
| colon cancer | HDAC 3 turnover is induced in cells by isothiocyanate therapeutics | (13) |
| HDAC 1 and NuRD complex contributes to epigenetic silencing of colorectal tumor suppressor genes | (14) | |
| ovarian cancer | HDACs 1–3 overexpression confer cisplatin resistance in ovarian cancer cell lines | (15) |
| HDAC 1 and 3 overexpression mediate proliferation and migration of ovarian cancer cells | (16) |
The challenge for HDAC research is developing a technique for quantifying the HDAC density that can be used in living subjects. The non-invasive imaging technique, PET, is an excellent tool to visualize chromatin-modifying enzymes in animals and human. PET can provide molecular level insight into protein density and interaction with drugs by quantifying the distribution of a radiotracer with extraordinarily high sensitivity. To date there are no validated tools for assessing the densities of HDAC enzymes in human despite the importance of these enzymes and their remarkably high expression. Efforts by others have resolved non-invasive probes for imaging HDAC enzyme density in vivo,19−23 however these tools have rapid binding kinetics and poor brain penetrating ability or bind to a different subset of HDACs than the isoforms that have been extensively implicated in diseases via study of patients and preclinical animal models.
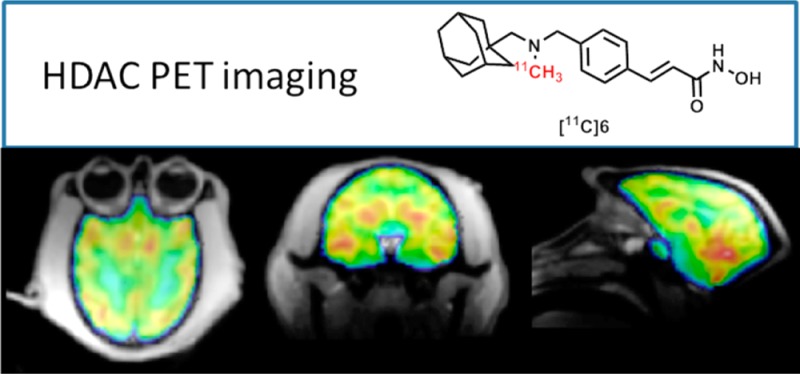
Herein, we report the development of [11C](E)-3-(4-((((3r,5r,7r)-Adamantan-1-ylmethyl)(methyl)amino)methyl)phenyl)-N-hydroxyacrylamide ([11C]Martinostat, [11C]6) (Figure 1) as a molecule ready for translation to human PET imaging (HDAC 1, 2, 3, and 6). Compound 6 is an adamantane-based hydroxamic acid with selective binding to HDAC 1, 2, 3, and 6 with subnanomolar potency and fast binding kinetics. Using rodent and nonhuman primate PET imaging, we demonstrate robust uptake and high specific binding in brain, heart, spleen, kidney, and pancreas. Using this tool, measurement of HDAC density of target isoforms 1, 2, 3, and 6 is possible in peripheral organs and brain for the first time. Measuring HDAC target density/occupancy with the aformentioned non-invasive tool promises a major advance to understand epigenetic mechanism in normal body tissues and diseases. Self-blocking experiments have demonstrated the sensitivity of [11C]6 to resolve differences in HDAC expression in peripheral organs and brain. Further, blocking experiments with the clinical approved HDAC inhibitor, SAHA, underscore the utility of this tool to evaluate HDAC density and target engagement with different therapeutics. Taken together, our findings highlight the immediate utility of [11C]6 as a preclinical PET tool to investigate HDAC expression in animal models. Furthermore, we outline and discuss the optimal properties of [11C]6 as an HDAC radiotracer that strongly support its development as a clinical research tool.
Figure 1.
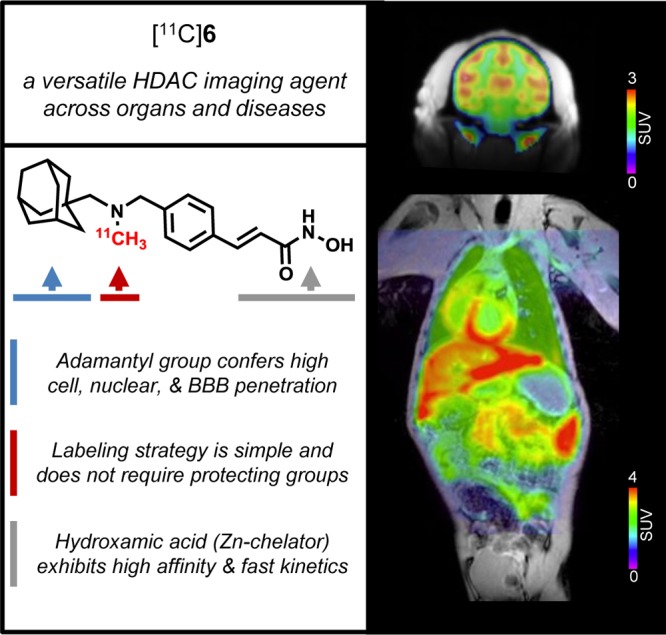
[11C]6: a translational PET imaging probe. We have developed a potent HDAC imaging agent, termed [11C]6, incorporating three key structural features to create a versatile and translational probe for visualizing HDAC expression in vivo. Intravenous injection of trace amounts of [11C]6 (nanogram scale) in baboon and imaging by PET-MR demonstrates quantifiable uptake in the brain and in diverse peripheral organs. This illustrates the potential for [11C]6 as a broadly applicable tool in evaluating HDAC density in humans.
Results
Design and Synthesis of PET Imaging Agents with Brain Permeability
HDAC inhibitors comprise diverse structural classes including hydroxamic acids, natural cyclic peptides, and short-chain fatty acids as well as aminoanilines and ketones. Most classes of HDAC inhibitors contain three main structural elements to their pharmacophore: (i) a capping group, (ii) a linker domain, and (iii) a zinc-binding group, critical for enzyme action. Modification of these structural elements has so far revealed that the brain uptake of most HDAC inhibitors is limited.19,24 To develop an HDAC PET probe with broad disease applicability, we wanted to integrate a chemical structure that would exhibit robust exposure to both peripheral organs and the brain. In medicinal chemistry efforts by others, the adamantyl group has been identified as a structural subunit that confers CNS distribution in several drugs classes including antiviral drugs,25 cannabinoid receptor modulators.26 Further, adamantane-based hydroxamic acids were recently reported and showed strong evidence of HDAC inhibition.27 Using these previous studies to guide our synthesis efforts, we designed compound 6, a cinnamic acid-based HDAC inhibitor containing an adamantyl group as a ‘blood brain barrier (BBB) carrier’ (Figure 1). Compound 6 was synthesized through reductive amination, followed by conversion into a hydroxamic acid in the presence of hydroxylamine and sodium hydroxide. The radiosynthesis of [11C]6 was accomplished using its desmethyl precursor in DMSO with [11C]methyl iodide ([11C]CH3I) as outlined in Scheme 1.
Scheme 1. Synthesis of 6, Its Radiolabeling Precursor (4) and [11C]6.
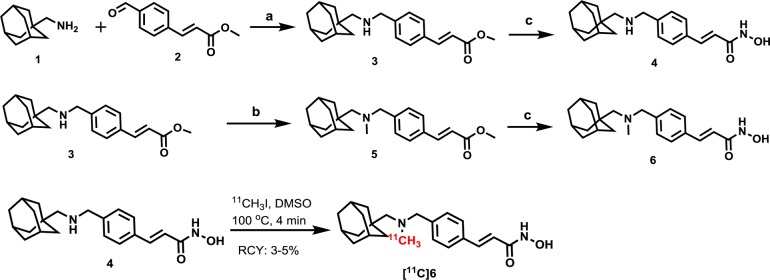
Reagents and conditions: (a) NaBH4, MeOH, overnight, rt, 75%; (b) formaldehyde, AcOH, NaBH4, MeOH, rt, overnight, 55%. (c) NH2OH (aq), 1M NaOH, MeOH/THF, 0 °C to rt, 4 h, 42% for 6, 40% for 5; RCY of [11C]6, 3–5% (non-decay corrected to trapped [11C]CH3I).
Physicochemical Properties of 6 and ex Vivo Binding
The in vitro inhibitory activities of 6 were measured for each HDAC isoform HDAC1 through HDAC9 (Table 2) using recombinant human enzymes, with IC50 values for the FDA approved HDAC inhibitor drug, suberoylanilide hydroxamic acid, vorinostat (SAHA), measured in parallel as a reference (to assess the variability among different assays). Compound 6 showed nanomolar IC50 values for class-I HDAC isoforms (HDAC 1–3, 0.3, 2.0, and 0.6 nM, respectively), and the class-IIb HDAC 6 (4.1 nM), with >100-fold selectivity over each of the other HDAC isoforms assayed. Using [11C]6 in vitro, we measured the partition coefficient (log D) at 2.03 and calculated tPSA of 52.5, which are in the preferred range for brain penetration, and further detected plasma protein binding (PPB), as measured in blood from baboon (1.4% unbound) and human (5.5% unbound), at levels consistent with those for the clinical dopamine D2 receptor radiotracer, [11C]raclopride28 (Figure S1).
Table 2. HDAC Selectivity, Potency, and Efficacy of 6 Compared To SAHAa.
| assay | 6 | SAHA |
|---|---|---|
| IC50 (nM) | ||
| HDAC 1 | 0.3 | 4.0 |
| HDAC 2 | 2.0 | 11 |
| HDAC 3 | 0.6 | 3.0 |
| HDAC 4 | 1970 | >30000 |
| HDAC 5 | 352 | 8750 |
| HDAC 6 | 4.1 | 2.0 |
| HDAC 7 | >20000 | >30000 |
| HDAC 8 | >15000 | 1020 |
| HDAC 9 | >15000 | >30000 |
| EC50 (nM) | ||
| H3K9ac | 100 | 3400 |
| H4K12ac | 100 | 1900 |
In vitro IC50 (nM) values using recombinant human enzymes for HDAC subtypes 1–9 and specific substrates demonstrate that 6 is a selective inhibitor of HDAC 1–3 (0.3–2.0 nM) with decreased potency to inhibit HDAC 6 (4.1 nM) or other subtypes (>352 nM). Comparatively, the hydroxamate HDAC inhibitor SAHA exhibited lower affinity for HDAC targets 1–3 (3.0–11 nM). Dose–response plots in cultured primary mouse neuronal cells measuring relative H3K9ac and H4K12ac levels revealed potent induction of histone acetylation (EC50) by 6 (100 nM) compared to SAHA (1900–3400 nM).
To test the selective binding of 6 over other potential protein targets, we screened the percentage inhibition of 6 (50 nM) using radioligand displacement assay against 4 zinc-dependent enzymes including matrix metalloproteinases and 80 additional non-HDAC or Zn-dependent central nervous system (CNS) targets. We determined minimal if any off-target binding, indicating high selectivity of 6 to the HDAC family (Table S1). The only potential off-target binding was the dopamine transporter (DAT) as implicated by the in vitro test. 6 (50 nM) resulted in a 24% inhibition of DAT (where 50% inhibition is the minimum threshold to identify a potential binding event). Therefore, to exclude a putative binding interaction of 6 to DAT (given that it is a relatively high dentistry brain protein), we used the established radiotracer [11C]β-CFT to evaluate DAT density/occupancy in rats and observed no impact of 6 treatment (1 mg/kg, ip, 90 min prior) (Figure S2).
To further establish that [11C]6 binding was specific for HDAC targets, we conducted blocking studies via autoradiography on rat brain sections ex vivo. We observed that specific binding of [11C]6 was reduced by preincubation of sagittal rat brain sections with either of the unlabeled HDAC inhibitors: SAHA, a hydroxamic acid-based HDAC inhibitor (selective for class I and IIb HDAC isoforms), or CI-994, a benzamide-based HDAC inhibitor (selective for HDAC 1, 2, and 3 isoforms) (Figure S1C,D).
In Vivo PET-CT Imaging with [11C]6 in Rodents
High Brain Uptake and Reversible Binding
To first test [11C]6 as a radiotracer in vivo, we conducted PET imaging focused on rat brain. Using PET-CT, we determined that [11C]6 exhibited high BBB penetration and sustained binding over the scanning time (60 min) when administered by intravenous bolus injection (0.9–1.1 mCi per animal), as shown in Figure S3A. To confirm that [11C]6 was not effluxed from the brain by the xenobiotic pump, P-glycoprotein (P-gp), we measured radioligand uptake in brain after treatment with the P-gp inhibitor, cyclosporin A (CsA), and found no difference compared to control treatment (Figure S4A). Additionally, [11C]6 binding in the rat brain was disrupted by an iv challenge with unlabeled 6 20 min after tracer administration as evidenced by a rapid decrease in the time–activity curve slope. This rapid loss of radioactivity from brain regions provided confirmation of the reversibility of [11C]6 binding to CNS targets (Figure S4B).
To determine the stability of [11C]6 in brain, we measured the presence of radiolabeled parent compound and polar metabolites in homogenized rat brain tissue 30 min post-in vivo injection of [11C]6. By eluting extracted and homogenized rat brain with solvents containing fractional increases of acetonitrile in water, we resolved a pattern of radioactivity indicating intact parent compound in the brain with limited degradation over the duration of a typical 30–90 min PET scan (Figure S5A). A similar pattern indicating unmetabolized [11C]6 was observed in baboon plasma, 5 min post-injection of the tracer (Figure S5B).
Dose-Dependent Blockade
To investigate the specificity of [11C]6, we performed PET imaging studies in rats with a 5 min pretreatment of unlabeled 6 at different doses (0.001, 0.1, 0.5, and 2.0 mg/kg). We found that [11C]6 binding in brain was blocked in a dose-dependent manner with a stepwise reduction in the percent tracer uptake after administration of unlabeled 6 (Figure S3B). To test the sensitivity of [11C]6 against other HDAC inhibitors, we pretreated a rat with CN54, a highly brain penetrant hydroxamic acid HDAC inhibitor as determined by LC-MS-MS (brain/plasma = 4.5 after 20 min administration of CN54 at 10 μg/kg via iv), and SAHA, a hydroxamic acid HDAC inhibitor with limited brain penetrating ability.24 As expected, there was robust in vivo blockade of radioactivity in brain with the treatment of CN54, but not SAHA (Figure S3C).
In Vivo PET-MR Imaging with [11C]6 in Baboon
High Uptake in the Brain and Dose-Dependent Blockade
Next, we chose to utilize nonhuman primates to evaluate the distribution and specificity of [11C]6. In baboons, we found that high brain uptake (50–60 in VT, total volume of distribution) of [11C]6 based on PET-MR focused on the head. Similar to the blocking results we obtained in rats, injection of unlabeled 6 (0.5 and 1.0 mg/kg, iv) dose-dependently reduced the radioactivity uptake (measured as VT) in specific brain regions including cerebellum, cortex, putamen, and caudate (Figure 2). The averaged Bmax of whole brain, 19.6 ± 2.9 μM of protein, was calculated from the PET image on the basis of the established relationship between total binding and dissociation rate29 and was consistent with ex vivo protein quantification in rodents by two methods.30 Physiological effects (i.e., respiration rate, blood pressure, heart rate, and end-tidal CO2) were unchanged at any administered dose of 6 or [11C]6. The baboons used in these imaging studies were not sacrificed.
Figure 2.
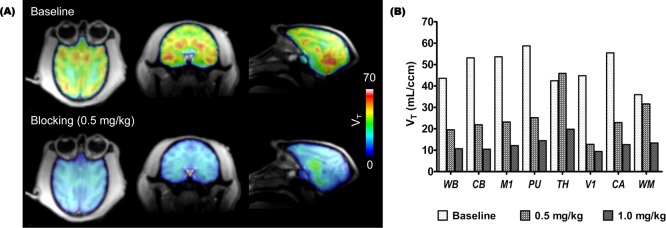
Kinetic modeling results with [11C]6 in baboon brain. (A) The total volume of distribution (VT) images from one representative animal show robust differences in radiotracer uptake at baseline and after blocking (0.5 mg/kg iv, 10 min pretreatment); (B) Two independent baseline-blocking studies were used to resolve quantitative VT data which show that pretreatment with unlabeled 6 (0.5 or 1.0 mg/kg) dose-dependently blocks tracer uptake in different baboon brain regions. WB: whole brain; CB: cerebellum; M1: primary motor cortex ; PU: putamen; TH: thalamus; V1: primary visual cortex ; CA: caudate; WM: white matter.
Arterial Plasma Analysis
After [11C]6 intravenous bolus injection, radioactivity in arterial plasma clears rapidly as expected and as depicted in Figure S5C. Polar metabolites were observed in the plasma (50% of the plasma radioactivity after 10 min); however, radioactivity in brain tissue of rodents at late time points (30 min post administration) was associated almost exclusively with the parent molecule. These data support that the PET images for the brain tissue largely represent [11C]6 and not radiolabeled metabolites. For quantitative analysis of the NHP PET imaging data, a metabolite-corrected arterial input function was used.
Kinetic Modeling Shows High Specific Binding
Two-tissue compartmental modeling was applied to analyze dynamic [11C]6 PET data, corrected for arterial input function and parent compound metabolism to interpret results from intact and perfused radiotracer. Based on the modeling results (Figure 2), blocking with 0.5 and 1.0 mg/kg, VT decreased in all brain regions. Based on our rodent experiments and dose-equilibration for body mass, we assumed that a 1.0 mg/kg dose would provide full saturation of HDAC binding. Therefore, 50–80% of the signal represented specific binding in the selected brain regions suggesting that [11C]6 has sufficient sensitivity to assess a wide range of CNS diseases in which HDAC may be altered, such as Alzheimer’s disease and in mood disorders,4,31,32 and for evaluation of drug-HDAC engagement.
High uptake and blockade in peripheral organs
We further evaluated the tracer uptake and blockade in peripheral organs in baboons. [11C]6 showed high uptake in major organs including heart, kidney, pancreas, and spleen (Figure 3). The uptake in these organs was markedly decreased by pretreatment with unlabeled 6, indicating that the [11C]6 signal also represents HDAC expression in peripheral organs. To further confirm the sensitivity of [11C]6 to detect changes in HDAC occupancy, we measured radiotracer uptake in the baboon both before and after 75 min infusion of SAHA (5 mg/kg, iv). We found that radiotracer uptake in peripheral tissue was robustly blocked by SAHA infusion, consistent with efficient distribution of this HDAC inhibitor blocking agent in nonbrain organs24 (Figure S6).
Figure 3.

[11C]6 PET-MR imaging. Axial views of summed PET images (40–80 min) superimposed with MR images from the same baboon following injection of radiotracer (4 mCi/baboon). Images illustrate tracer uptake in organs of interest at baseline and after pretreatment with unlabeled 6 (0.5 mg/kg). Robust blocking was observed in organs of interest including: A, heart; B, spleen; C, kidneys; and D, pancreas. Time–activity curves (baseline, blue; blocking, red) demonstrate a high specific binding of [11C]6 in these peripheral organs as the percent injected tracer dose per cm3 tissue is markedly reduced by blocking.
Discussion
Epigenetic therapies that target regulatory mechanisms of the human genome represent an emerging class of novel therapeutic agents. The importance of understanding aberrant enzyme expression of chromatin modifying enzymes including HDACs is highlighted by the discovery that protein coding mutations may play a role in human disease pathologies linked to cancer in major organs, cardiac dysfunction, and CNS disorders. The impact of these enzyme density changes is further implicated in disease as recent large-scale genome-wide association studies (GWAS) have shown that gene regulatory regions key in many common human diseases harbor an enrichment of single nucleotide polymorphisms (SNPs).33−38 This evidence of deregulated gene expression mechanism points to a more general need to target epigenetic machinery that may be causally involved in disease pathogenesis. Therefore, developing therapeutics for many human diseases can be best accomplished by first understanding the density and distribution of epigenetic machinery including HDAC enzymes in vivo.
Development of specific PET radiotracers to measure HDAC density or any other epigenetic component, with high uptake and major organs, is challenging.39 There are a number of major factors (summarized here A through D) that determine the success of a radiotracer candidate. Some factors can be predicted from in vitro assays (e.g., binding affinity and selectivity), and those which are more empirically determined (e.g., specific to nonspecific binding ratio). (A) The binding affinity and selectivity of a radiotracer for its target must be high enough to produce sufficient signal to background for detection and selective for the target so that images represent the biological target. (B) Additionally, radiotracers must exhibit specific binding, which is challenging to predict but can be easily measured by presaturating the target with an unlabeled (nonradioactive) form of the radiotracer thus resulting in decreased binding of radiotracer to its target. Unlabeled compound binding is also expected to alter the distribution and pharmacokinetics of the radioligand. (C) For CNS imaging, small molecules must cross the BBB. In general, small molecular weight (<400 Da) molecules with relatively high lipophilicity are required for a tracer to sufficiently penetrate the BBB. Predictive models based on PET imaging data are emerging for HDAC inhibitors that suggest the total polar surface area (tPSA) needs to be <65.22 (D) With all of the above properties satisfied, a tracer candidate can still be rendered unusable in vivo if it is metabolized rapidly and those metabolites pervade the tissue regions of interest. Each of the primary factors for a successful radiotracer is met by [11C]6 and supported by our biochemical and preclinical imaging data. Of the more than 100 compounds we assessed through our tracer identification work, [11C]6 was unique. While we have observed some trends in molecular properties, structure, and in vivo behavior, fully understanding the molecular basis for [11C]6 success will require additional structure–activity relationship determination and computational modeling.
Our data support [11C]6 as a new tool to visualize HDAC density in the body and brain. The robust and blockable brain uptake with [11C]6 as a PET probe can be used to quantify HDAC density in brain disorders, such as neurodegenerative diseases and mood disorders, and for demonstrating target engagement of putative HDAC inhibitor therapeutics early in compound development pipeline. We found stable probe uptake in diverse peripheral organs in nonhuman primates, each with a distinct profile of HDAC target density and affinity as evidenced by time–activity curve (TAC) shape (Figure S6). In each case, we further demonstrated that [11C]6 binding could be prevented using a known, clinically applied HDAC inhibitor drug (Figure S6) illustrating the direct utility of this probe for understanding systemic impact of a cancer therapeutic. A recent report demonstrates that class I HDAC inhibition by a prototypical HDACi therapeutic, MS-275, stimulates renal dysfunction.40 Dose-limiting toxicity may not be surprising given the widespread expression and central role of HDACs in normal biological function. However, this underscores a mechanism-based liability for HDAC inhibitor leads proposed to date as CNS disease therapeutics where large mass dosing strategies are used to reach effective concentrations of HDACi in brain.24,41,42 Importantly, the ability to simultaneously measure HDAC target engagement in peripheral organs and brain is a major development in not only understanding CNS disease mechanisms but also in prioritizing novel HDAC inhibitors with minimal systemic burden.
In summary, [11C]6 binds to HDAC subtypes (HDAC 1, 2, 3, and 6) with high selectivity and specificity and provides a tool for quantitative imaging of HDAC density in the brain and in peripheral organs in vivo. [11C]6 can be used as a PET radioligand for studying HDACs in disorders where altered regulation of HDACs is found. The approach is also valuable for evaluation of potential drugs in vivo, therapy response can be compared in the same animal before drug treatment. Safety and toxicology studies have been completed, and we are progressing [11C]6 forward for evaluation as the first HDAC PET radiotracer and a novel class of epigenetic imaging probes in humans.
Experimental Section
General Methods and Materials
All reagents and solvents were of ACS-grade purity or higher and used without further purification. NMR data were recorded on a Varian 500 MHz magnet and were reported in ppm units downfield from trimethylsilane. Analytical separation was conducted on an Agilent 1100 series HPLC fitted with a diode-array detector, quaternary pump, vacuum degasser, and autosampler. Mass spectrometry data were recorded on an Agilent 6310 ion trap mass spectrometer (ESI source) connected to an Agilent 1200 series HPLC with quaternary pump, vacuum degasser, diode-array detector, and autosampler. The precursor and compound 6 were synthesized (from Sai Life Sciences Ltd.) with >98% purity, as determined by a high-pressure liquid chromatography (HPLC) system (YMC TRIART C-18 (150 mm × 4.6 mm × 3 u) mobile phase: A: 0.05% TFA in water/B: 0.05% TFA in acetonitrile. Flow rate: 1.0 mL/min. Gradient: 15% B to 95% B in 8.0 min, hold until 9.5 min, 15% B in 13.0 min hold until 15.0 min. The quantitative NMR test were conducted by Sai Life Sciences Ltd., and 1,4-dimethoxybenzene was used as the reference. [11C]CO2 (1.2 Ci) was obtained via the 14N (p, α)11C reaction on nitrogen with 2.5% oxygen, with 11 MeV protons (Siemens Eclipse cyclotron), and trapped on molecular sieves in a TRACERlab FX-MeI synthesizer (General Electric). [11C]CH4 was obtained by the reduction of [11C]CO2 in the presence of Ni/hydrogen at 350 °C and recirculated through an oven containing I2 to produce 11CH3I via a radical reaction.
All animal studies were carried out at Massachusetts General Hospital (PHS Assurance of Compliance no. A3596-01). The Subcommittee on Research Animal Care (SRAC) serves as the Institutional Animal Care and Use Committee (IACUC) for the Massachusetts General Hospital (MGH). SRAC reviewed and approved all procedures detailed in this paper.
PET-MR imaging was performed in anesthetized (ketamine, isoflurane) baboon (Papio anubis) to minimize discomfort. Highly trained animal technicians monitored animal safety throughout all procedures, and veterinary staff were responsible for daily care. All animals were socially housed in cages appropriate for the physical and behavioral health of the individual animal. Animals were fed thrice per diem, with additional nutritional supplements provided as prescribed by the attending veterinarian. Audio, video, and tactile enrichment was provided on a daily basis to promote psychological well-being. No nonhuman primates were euthanized to accomplish the research presented.
PET-CT imaging was performed in anesthetized (isoflurane) rats (Sprague–Dawley) to minimize discomfort. Highly trained animal technicians monitored animal safety throughout all procedures, and veterinary staff were responsible for daily care. All animals were socially housed in cages appropriate for the physical and behavioral health of the individual animal. Animals were given unlimited access to food and water, with additional nutritional supplements provided as prescribed by the attending veterinary staff. Animals were euthanized at the end of the study using sodium pentobarbital (200 mg/kg, ip).
Chemical Synthesis
(E)-Methyl 3-(4-((((3r,5r,7r)-adamantan-1-ylmethyl)amino)methyl)phenyl)acrylate (3)
Adamantan-1-ylmethanamine (1) (1g, 6.0 mmol) and (E)-methyl 3-(4-formylphenyl)acrylate (2) (1 g, 5.3 mmol) was dissolved in MeOH (30 mL), and the mixture was stirred at room temperature for 2 h. Sodium borohydride (0.61g, 16 mmol) was then added, and the suspension was stirred overnight at room temperature. The white precipitate was filtered and dried to obtain the product 3 (1.35 g, yield: 75%).1H NMR (500 MHz, CDCl3): δ 7.69 (d, J = 16 Hz, 1H), 7.48 (d, J = 7 Hz, 2H), 7.35 (d, J = 7 Hz, 2H), 6.43 (d, J = 16 Hz, 1H), 3.81 (s, 2H), 3.80 (s, 3H), 2.23 (s, 3H), 1.96 (s, 3H), 1.63–1.73 (m, 6H), 1.53 (s, 6H); 13C NMR (125 MHz, CDCl3): 167.55, 144.78, 143.81, 132.87, 128.35 (2C), 128.08 (2C), 117.10, 62.15, 54.28, 51.65, 40.85 (3C), 37.24 (3C), 33.49, 28.48 (3C). LC-MS calculated for C22H29NO2 expected [M]: 339.2; Found [M + H]+: 340.3.
(E)-3-(4-((((3r,5r,7r)-Adamantan-1-ylmethyl)amino)methyl)phenyl)-N-hydroxyacrylamide (4)
To a solution of 3 (0.5 g, 1.5 mmol) in MeOH/THF (5 mL/5 mL) at 0 °C was added NH2OH (50% aq solution, 3 mL) followed by 1 M NaOH (2 mL). The mixture was stirred at 0 °C for 2 h, warmed to room temperature, and stirred for 2 h. Acidification with 1 M HCl to pH 7–8 (pH paper) resulted in product precipitation. The precipitate was filtered and dried to obtain 4 (0.2 g, 40%) as white solid. 1H NMR (500 MHz, CDCl3): δ 7.69 (d, J = 16 Hz, 1H), 7.47 (d, J = 7.5 Hz, 2H), 7.39 (d, J = 7.5 Hz, 2H), 6.42 (d, J = 16 Hz, 1H), 3.80 (s, 3H), 3.54 (s, 2H), 2.19 (s, 3H), 2.10 (s, 2H), 1.95 (s, 3H), 1.62–1.723 (m, 6H), 1.53 (s, 6H); 13C NMR (125 MHz, CDCl3): 164.92, 141.31, 139.69, 133.75, 128.61 (2C), 127.42 (2C), 116.88, 71.09, 61.08, 53.31, 40.41 (3C), 36.77 (3C), 32.84, 28.48 (3C). LC-MS calculated for C21H28N2O2 expected [M]: 340.5; Found [M + H]+: 341.3. HPLC purity: 98.09%. Quantitative NMR purity: 95.10%.
(E)-Methyl 3-(4-((((3r,5r,7r)-adamantan-1-ylmethyl) (methyl) amino) methyl) phenyl) acrylate (5)
To a solution of 3 (0.5 g, 1.5 mmol) in MeOH (30 mL) was added formaldehyde (33% aq solution, 2 mL) followed by acetic acid (0.1 mL). The mixture was stirred at room temperature for 2 h. Sodium borohydride (0.61g, 16 mmol) was then added, and the suspension was stirred overnight at room temperature. The white precipitate was filtered and purified by flash chromatography in hexanes:ethyl acetate (4:1) to obtain the product 3 (0.29 g, yield: 55%) as white solid. 1H NMR (500 MHz, MeOH-d4): δ 7.55 (d, J = 16 Hz, 1H), 7.52 (d, J = 7.5 Hz, 2H), 7.37 (d, J = 7.5 Hz, 2H), 6.47 (d, J = 16 Hz, 1H), 3.77 (s, 2H), 2.21 (s, 2H), 1.94 (s, 3H), 1.66–1.76 (m, 6H), 1.54–1.55 (m, 6H); 13C NMR (125 MHz, MeOH-d4): 164.93, 141.32, 139.71, 133.76, 128.62 (2C), 127.43 (2C), 116.8901, 61.08, 53.32, 40.42 (3C), 36.78 (3C), 32.84, 28.48 (3C). LC-MS calculated for C21H28N2O2 expected [M]: 353.2; Found [M + H]+: 354.1.
(E)-3-(4-((((3r,5r,7r)-Adamantan-1-ylmethyl)(methyl)amino)methyl)phenyl)-N-hydroxyacrylamide (6)
To a solution of 5 (0.5 g, 1.4 mmol) in MeOH/THF (3 mL/3 mL) at 0 °C was added NH2OH (50% aq solution, 3 mL) followed by 1 M NaOH (2 mL). The mixture was stirred at 0 °C for 2 h, warmed to room temperature, and stirred for 2 h. Acidification with 1 M HCl to pH 7–8 (pH paper) resulted in product precipitation. The precipitate was filtered and dried to obtain 6 (0.21 g, 42%) as white solid. 1H NMR (500 MHz, DMSO-d6): δ 7.49 (d, J = 7.5 Hz, 2H), 7.42 (d, J = 16 Hz, 1H), 7.33 (d, J = 7.5 Hz, 2H), 6.45 (d, J = 16 Hz, 1H), 3.48 (s, 2H), 2.11 (s, 3H), 2.06 (s, 2H), 1.89 (s, 3H), 1.55–1.65 (m, 6H), 1.46 (s, 6H); δ 13C NMR (125 MHz, DMSO-d6): 163.15, 142.00, 138.43, 139.91, 129.36 (2C), 127.77 (2C), 119.06, 70.12, 64.57, 45.71, 41.01 (3C), 37.21 (3C), 35.27, 28.33 (3C). LC-MS calculated for C22H30N2O2 expected [M]: 354.2; Found [M + H]+: 355.3. HPLC purity: 99.64%. Quantitative NMR purity: 97.05%.
HDAC Inhibition Assay
All recombinant human HDACs were purchased from BPS Bioscience. The substrates, Broad Substrates A and B, were synthesized in house. All other reagents were purchased from Sigma-Aldrich. Caliper EZ reader II system was used to collect all data. HDAC inhibition assays: Compounds were tested in a 12-point dose curve with 3-fold serial dilution starting from 33.33 μM. Purified HDACs were incubated with 2 μM (the concentration is kept the same for all the HDACs, below Km of substrate) carboxyfluorescein (FAM)-labeled acetylated or trifluoroacetylated peptide substrate (Broad Substrates A and B, respectively) and test compound for 60 min at room temperature, in HDAC assay buffer that contained 50 mM HEPES (pH 7.4), 100 mM KCl, 0.01% BSA, and 0.001% Tween-20. Reactions were terminated by the addition of the known pan HDAC inhibitor LBH -589 (panobinostat) with a final concentration of 1.5 μM. Substrate and product were separated electrophoretically, and fluorescence intensity in the substrate and product peaks were determined and analyzed by Labchip EZ Reader. The reactions were performed in duplicate for each sample. IC50 values were automatically calculated by Origin8 using 4 Parameter Logistic Model. The percent inhibition was plotted against the compound concentration, and the IC50 value was determined from the logistic dose–response curve fitting by Origin 8.0 software.
Mouse Primary Neuronal Histone Acetylation Assays
Mouse primary neuronal cultures were generated in factory precoated poly-d-lysine 96-well plates (BD Biosciences no. BD356692) treated overnight with 75 μL/well of laminin [0.05 mg/mL] (Sigma no. L2020) in PBS buffer. E15 embryonic mouse forebrain was dissociated into a single cell suspension by gentle trituration following trypsin/DNase digestion (trypsin: Cellgro no. 25-052-Cl; DNase: Sigma no. D4527). 12,500 cells per well were plated in 100 μL neurobasal medium (Gibco no. 21103-049) containing 2% B27 (Gibco no. 17504-044) and 1% penicillin/streptomycin/glutamine (Cellgro no. 30-009-CI) and cultured at 37 °C with 5% CO2. After 13 days, cultures were treated with HDAC inhibitors by pin transfer of compound (185 nL per well) using a CyBi-Well vario pinning robot (CyBio Corp., Germany) and subsequently incubated for 24 h at 37 °C with 5% CO2 and then fixed in 4% formaldehyde for 10 min. Following two washes with phosphate-buffered saline, cells were permeabilized and blocked with 0.1% Triton X-100 and 2% BSA in PBS. Cells were stained with an anti-Ac-H4K12 antibody (Millipore, catalog no. 04–119) and Alexa488-conjugated secondary antibody (Molecular Probes). Cell nuclei were identified by staining with Hoechst 33342 (Invitrogen, H3570). Cell nuclei and histone acetylation signal intensity were detected and measured using a laser-scanning microcytometer (Acumen eX3, TTP Laptech). Acumen Explorer software was used to identify a threshold of histone acetylation signal intensity such that, without HDAC inhibitor, >99.5% of cells had intensity levels below the threshold. In the presence of HDAC inhibitors, cells signal intensities above the threshold were scored as “bright green cells” and expressed as a percentage normalized to DMSO controls. EC50 values were determined from curve fitting using GraphPad Prism v5 software (GraphPad Software, Inc. La Jolla, CA, USA).
CNS Target Binding Assay
6 was submitted to a panel of 80 binding assays for common transmembrane and soluble receptors, ion channels, and monoamine transporters in the CNS (High-Throughput Profile P-3, Cerep, France). 6 was assayed in duplicate at 50 nM. This concentration was >10× the IC50 values determined for HDAC targets (0.3–4.1 nM, see Table 2, main text) and in vast excess of the amount of 6 administered in PET imaging experiments. For example, injected dose = 1 mCi/rat; specific activity (see Figure S2) = 1 mCi/1 nmole; therefore, calculated dose = 1 nmole 6/ rat. Inhibition of control binding did not exceed 45% for any target assayed, supporting that 6 predominantly binds HDAC targets.
Radiosynthesis of [11C]6
[11C]CH3I was trapped in a TRACERlab FX-M synthesizer reactor (General Electric) preloaded with a solution of precursor (4) (1.0 mg) in dry DMSO (300 μL). The solution was stirred at 100 °C for 4 min, and water (1.2 mL) was added. The reaction mixture was purified by reverse phase semipreparative HPLC (Phenomenex Luna 5u C8(2), 250 × 10 mm, 5 μm, 5.0 mL/min, 40% H2O + ammonium acetate (0.1 M)/ 60% CH3CN), and the desired fraction was collected. The final product was reformulated by loading onto a solid-phase exchange (SPE) C-18 cartridge, rinsing with 1 M NaOH aq (5 mL), eluting with EtOH (1 mL), and diluting with 50 μL acetic acid in saline (0.9%, 9 mL). The chemical and radiochemical purity of the final product was tested by analytical HPLC (Agilent Eclipse XDB-C18, 150 × 4.6 mm). The identity of the product was confirmed by analytical HPLC with additional co-injection of reference standard. The average time required for the synthesis from end of cyclotron bombardment to end of synthesis was 35 min. The average radiochemical yield was 3–5% (nondecay corrected to trapped [11C]CH3I). Chemical and radiochemical purities were ≥95% with a specific activity 1.0 ± 0.2 Ci/μmol (EOB).
Specific Activity of [11C]6
Specific radioactivity (SA) of [11C]6 was calculated from an analytical HPLC sample of 100 μL. A calibration curve of known mass quantity versus HPLC peak area (254 nm) was used to calculate the mass concentration of the 100 μL. SA was determined using the mass concentration value determined for the formulated [11C]6 solution, volume, and measured radioactivity. The identity of the mass peak assigned to [11C]6 was supported by a second HPLC injection, where [11C]6 was mixed with nonradioactive compound 6 and yielded a single peak. The calibration curve used appears in Figure S1.
Log D Determination
An aliquot (∼50 μL) of the formulated radiotracer was added to a test tube containing 2.5 mL of octanol and 2.5 mL of phosphate buffer solution (pH 7.4).The test tube was mixed by vortex for 2 min and then centrifuged for 2 min to fully separate the aqueous and organic phase. A sample taken from the octanol layer (0.1 mL) and the aqueous layer (1.0 mL) was saved for radioactivity measurement. An additional aliquot of the octanol layer (2.0 mL) was carefully transferred to a new test tube containing 0.5 mL of octanol and 2.5 mL of phosphate buffer solution (pH 7.4). The previous procedure (vortex mixing, centrifugation, sampling, and transfer to the next test tube) was repeated until six sets of aliquot samples had been prepared. The radioactivity of each sample was measured in a well counter (PerkinElmer, Waltham, MA).The log D of each set of samples was derived by the following equation: log D = log (decay-corrected radioactivity in octanol sample × 10/decay-corrected radioactivity in phosphate buffer sample).
Plasma Protein Binding Assay
An aliquot of radiotracer in saline (10 μL) was added to a sample of baboon or human plasma (0.8 mL). The mixture was gently mixed by repeated inversion and incubated for 10 min at room temperature. Following incubation a small sample (20 μL) was removed to determine the total radioactivity in the plasma sample (AT; AT = Abound + Aunbound). An additional 0.2 mL of the plasma sample was placed in the upper compartment of a Centrifree tube (Amicon, Inc., Beverly, MA) and then centrifuged for 10 min. The upper part of the Centrifree tube was discarded, and an aliquot (20 μL) from the bottom part of the tube was removed to determine the amount of radioactivity that passed through the membrane (Aunbound). Plasma protein binding was derived by the following equation: %unbound = Aunbound × 100/AT.
Ex vivo Autoradiography
Twenty μm thick sagittal rat brain sections were cut using a −20 °C cryostat, thaw-mounted onto gelatin-coated slides, fixed in 4% paraformaldehyde containing 2% ethanol for 60 min at 4 °C, and washed 10 min in ice-cold 10 mM Tris-HCl, pH 7.4. Sections were then incubated at room temperature in a 50 mL bath containing either (i) 5% DMSO as control; (ii) unlabeled 6 (100 μM) or (iii) SAHA (100 μM) for 10 min; or (iv) CI-994 (100 μM) for 2 h to allow for slow HDAC binding kinetics known for benzamide compounds including CI-994. All incubation baths contained 10 mM Tris-HCl + 5% DMSO, pH 7.4. [11C]6 was prepared as described, and 100 μCi was added to each bath. Following 10 min incubation at room temperature, sections were washed 2 × 1 min in 10 mM Tris-HCl (pH 7.4) and carefully wiped dry on absorbent towels. Sections were exposed for 1 h to a multisensitive phosphorscreen and developed using a Cyclone Plus phosphorimager (both from PerkinElmer). Resulting parent image was evaluated using ImageJ software (NIH) with JET color lookup table (LUT) with whole-image intensity adjusted to enrich red color in control sections. Individual images of sections were cropped using ImageJ with no additional adjustment to color levels/thresholds.
Rodent PET-CT Acquisition and Post-Processing
Male Sprague–Dawley rats were utilized in pairs, anesthetized with inhalational isoflurane (Forane) at 3% in a carrier of 1.5–2 L/min medical oxygen, and maintained at 2% isoflurane for the duration of the scan. The rats were arranged head-to-head in a Triumph Trimodality PET/CT/SPECT scanner (Gamma Medica, Northridge, CA). Rats were injected standard references or vehicle via a lateral tail vein catheterization at the start of PET acquisition. Dynamic PET acquisition lasted for 60 min and was followed by computed tomography (CT) for anatomic coregistration. PET data were reconstructed using a 3D-MLEM method resulting in a full width at half-maximum (fwhm) resolution of 1 mm. Reconstructed images were exported from the scanner in DICOM format along with an anatomic CT for rodent studies. These files were imported to PMOD (PMOD Technologies, Ltd.) and manually co-registered using six degrees of freedom.
Rodent PET-CT Image Analysis
Volumes of interest (VOIs) were drawn manually as spheres in brain regions guided by high-resolution CT structural images and summed PET data, with a radius no <1 mm to minimize partial volume effects. TACs were exported in terms of decay corrected activity per unit volume at specified time points with gradually increasing intervals. The TACs were expressed as percent injected dose per unit volume for analysis.
Baboon PET-MR Acquisition
Papio anubis baboons, deprived of food for 12 h prior to the study, were included in the PET-MR scans. Atropine 0.05 mg/kg was used intramuscularly to prevent excessive secretion (15 or 30 min of ketamine and Xylazine). Anesthesia was induced with intramuscular xylazine (0.5–2.0 mg/kg) and ketamine (10 mg/kg). After endotracheal intubation, V- and A-lines were inserted, and anesthesia was maintained using isoflurane (1–1.5%, 100% O2 or 50/50 O2/N2O, l L/min). During anesthesia, heart rate, respiration rate, blood pressure, O2 saturation, and end tidal CO2 were monitored. The baboon was catheterized antecubitally for radiotracer injection, and a radial arterial line was placed for metabolite analysis.
Brain imaging
PET-MR images were acquired in a Biograph mMR scanner (Siemens, Munich, Germany) and PET compatible 8-channel coil arrays for nonhuman primate brain imaging with a PET resolution of 5 mm and field of view of 59.4 and 25.8 cm (transaxial and axial, respectively). Dynamic PET image acquisition was initiated followed by administration of the radiotracer in a homogeneous solution of 10% ethanol and 90% isotonic saline. An MEMPRAGE sequence began after 30 min of the baseline scan for anatomic co-registration. To characterize the specific binding of [11C]6, a second imaging experiment was carried out in which unlabeled 6 was co-administered intravenously at the start of acquisition. Both scans were carried out in the same animal on the same day, separated by 2.5 h. In both scans, 4–5 mCi of [11C]6 was administered to the baboon. Dynamic data from the PET scans were recorded in list mode and corrected for attenuation. Baboon data were reconstructed using a 3D-OSEM method resulting in a fwhm resolution of 4 mm.
Body imaging
Simultaneous PET-MR data were acquired using a Siemens Biograph mMR system (Siemens Medical Solutions U.S.A., Inc., Malvern, PA). MR body imaging was performed with real-time respiratory bellows-gating and using the Body Matrix coil and the built-in spine coil as the receiving coil elements. High-resolution anatomical T1W axial, coronal, and sagittal dual-echo scan with the following parameters: TR 115 ms, TE1 1.23 ms, TE2 2.46 ms, matrix size 256 × 168, FOV 35 cm, phase FOV 65.6%) and 4 mm slice thickness were obtained. Additionally, in particular for the purpose of optimal visualization of the pancreas, high-resolution fat-suppressed axial T2W turbo spin echo (TSE) data were obtained with the following parameters: TR 5264 ms, TE 98 ms, matrix size 488 × 235, FOV 18.0 cm, phase FOV 75%, FA 150°, and 3 mm slice thickness. For the purpose of MR-based attenuation correction (MRAC) of the PET data, default T1-weighted (T1W) 2-point Dixon 3D volumetric interpolated breath-hold examination (VIBE) scans were obtained.
PET data were obtained using a single-bed acquisition with an axial field of view of 25.8 cm, transaxial field of view of 59.4 cm, and axial and transaxial resolution of ≤4.8 and ≤4.7 mm, respectively. PET data were acquired dynamically for 80 min after administration of the radiotracer in a homogeneous solution of 10% ethanol and 90% isotonic saline. To characterize the specific binding of [11C]6, a second imaging experiment was carried out in which unlabeled 6 was co-administered intravenously at the start of acquisition. Both scans were carried out in the same animal on the same day, separated by 2.5 h. In both scans, 4–5 mCi of [11C]6 was administered to the baboon. In order to evaluate the blocking of [11C]6 by SAHA, an separate dual-injection study of [11C]6 was performed. In that experiment continuous SAHA infusion (2 mg/mL at 0.16 mL/min) was started after 45 min of baseline scan with [11C]6, and the infusion was continued during the 80 min PET scan after a second injection of [11C]6. In all cases PET data were recorded in list mode, and reconstruction was performed using a 3D-OSEM method resulting in a fwhm resolution of 4 mm. Attenuation correction was performed using the aforementioned 2-point Dixon 3D VIBE MR-derived attenuation maps. Data of each 80 min scan were reconstructed for TAC analysis using the following framing: 12 × 10, 3 × 20, 4 × 30, and 15 × 300 s. For the dedicated self-blocking and SAHA blocking experiments, additional static PET data were reconstructed using data obtained between 40 and 80 min and 20–45 min, respectively, in order to visually display the effects of blocking in multiple organs.
Baboon PET-MR Image Analysis
PET data were motion-corrected, spatially smoothed with a 2.5 mm fwhm Gaussian filter, and registered to the Black baboon brain atlas43 using JIP tools optimized for nonhuman primate data processing (www.nitrc.org/projects/jip). Image registration was carried out on high-resolution MPRAGE MRI image using a 12 degree of freedom linear algorithm and a nonlinear algorithm to the atlas brain. The transformation was then applied to the simultaneously collected dynamic PET data.
Kinetic modeling was carried out in PMOD (PMOD3.3, PMOD Technologies Ltd., Zurich, Switzerland). VOIs were selected according to the Black baboon brain atlas. A common VOI mask was applied to both baboon scans. TACs were exported from the whole brain, cerebellum, primary motor cortex, putamen, thalamus, primary visual cortex, caudate, and white matter VOIs for analysis. A two-tissue compartmental model was used to estimate regional volume of distribution (VT) with a metabolite-corrected plasma TAC. Voxel-wise VT maps were calculated using a Logan plot from the dynamic PET data.44 The time until linearity of the plot was achieved and determined for each scan.
In addition, regional K1/k2 and k3/k4 values were also obtained from the baseline scans using a two-tissue compartmental model. It is known that
with the assumption that Kdapp = 0.4 μM45 (assumed from ex vivo HDAC-complex Kd measure for SAHA, which exhibits a similar IC50 in in vitro activity-based assays we determined). Averaged Bmax from the selected VOIs was estimated to be 19.6 ± 2.9 μM (mean ± SD).
Plasma and Metabolite Analysis
Arterial samples collected during imaging from the baboon were centrifuged to obtain plasma, which was then removed and placed in an automated gamma counter that was calibrated to the PET scanner. Metabolite analysis was conducted on a custom automated robot fitted with Phenomenex SPE Strata-X 500 mg solid phase extraction cartridges that were primed with ethanol (2 mL) and deionized water (20 mL). Protein precipitation was achieved by addition of plasma (300 μL) to acetonitrile (300 μL), which was centrifuged for 1 min to obtain protein-free plasma (PFP). 300 μL of PFP/acetonitrile solution was diluted into deionized water (3 mL), loaded onto the C18 cartridge, and removed of polar metabolites with 100% water. Next, a series of extractions were performed using water and acetonitrile in quantities: 95:5, 90:10, 85:15, 80:20, 70:30, 60:40, 30:70, and 100% acetonitrile at a volume of 4 mL. A control experiment was performed before metabolite analysis to determine the retention of the parent compound by injection of a small amount of [11C]6 onto a test series of extraction cartridges. Each sample was counted in a WIZARD2 Automatic Gamma Counter to determine the presence of radiolabeled metabolites.
Brain Metabolite Analysis
One rat under pentobarbital anesthesia (50 mg/kg, ip) was administered 0.538 mCi of [11C]6 by tail vein injection in 0.7 mL and after 30 min, sacrificed by pentobarbital overdose (additional 150 mg/kg, ip), and followed by rapid decapitation. The brain was removed, sagitally hemisected, and homogenized in 2 mL acetonitrile. The resulting suspension was centrifuged at 1500 rpm for 5 min, and 0.6 mL of clear supernatant was vortexed with 3 mL water and applied to Phenomenex SPE Strata-X 500 mg solid phase extraction cartridges, washed, and fractionally eluted with water containing increasing proportions of acetonitrile (100:0, 95:5, 90:10, 85:15, 80:20, 70:30, 60:40, 30:70, 0:100). Each sample was counted in a WIZARD2 Automatic Gamma Counter to determine the presence of radiolabeled metabolites.
Acknowledgments
C.W. and H.Y.W. are supported by the Harvard/MGH Nuclear Medicine Training Program from the Department of Energy (DE-SC0008430). Research was supported by the National Institute of Drug Abuse (NIDA) of the National Institutes of Health under grant numbers R01DA030321 (J.M.H.; S.J.H) with additional support under grant R01DA028301 (S.J.H.). This research was carried out at the Athinoula A. Martinos Center for Biomedical Imaging at the Massachusetts General Hospital, using resources provided by the Center for Functional Neuroimaging Technologies, P41EB015896, a P41 Regional Resource supported by the National Institute of Biomedical Imaging and Bioengineering (NIBIB), National Institutes of Health. This work also involved the use of instrumentation supported by the NIH Shared Instrumentation Grant Program and/or High-End Instrumentation Grant Program; specifically, grant nos: S10RR017208, S10RR026666, S10RR022976, S10RR019933, and S10RR029495. The authors are grateful to Joe Mandeville and Helen Deng as well as the Martinos Center radiopharmacy and imaging staff (Grae Arabasz, Shirley Hsu, Stephen Carlin, Chris Moseley, Nathan Schauer, Ehimen Aisaborhale, Judit Sore) for help with nonhuman primate experiments. HDAC activity screening was enabled by a Caliper assay developed by Jennifer Gale and Yan-Ling Zhang at the Broad Institute.
Glossary
Abbreviations Used
- HDACs
histone deacetylases
- CNS
Center for Nanoscale Systems
- PET
positron emission tomography
- PPB
plasma protein binding
- DAT
dopamine transporter
- P-gp
P-glycoprotein
- NHP
nonhuman primate
- GWAS
genome-wide association studies
- SNPs
single nucleotide polymorphisms
- tPSA
total polar surface area
- TAC
time–activity curve
Supporting Information Available
The results of off-target binding, mPET imaging in rodents and SAHA pretreated study in NHP were shown in Table S1, Figure S1–S6. This material is available free of charge via the Internet at http://pubs.acs.org.
The authors declare no competing financial interest.
Funding Statement
National Institutes of Health, United States
Supplementary Material
References
- Wang W. Y.; Pan L.; Su S. C.; Quinn E. J.; Sasaki M.; Jimenez J. C.; Mackenzie I. R.; Huang E. J.; Tsai L. H. Interaction of FUS and HDAC1 regulates DNA damage response and repair in neurons. Nat. Neurosci. 2013, 16, 1383–1391. [DOI] [PMC free article] [PubMed] [Google Scholar]
- Bardai F. H.; Verma P.; Smith C.; Rawat V.; Wang L.; D’Mello S. R. Disassociation of histone deacetylase-3 from normal huntingtin underlies mutant huntingtin neurotoxicity. J. Neurosci. 2013, 33, 11833–11838. [DOI] [PMC free article] [PubMed] [Google Scholar]
- Bardai F. H.; Price V.; Zaayman M.; Wang L.; D’Mello S. R. Histone deacetylase-1 (HDAC1) is a molecular switch between neuronal survival and death. J. Biol. Chem. 2012, 287, 35444–35453. [DOI] [PMC free article] [PubMed] [Google Scholar]
- Graff J.; Rei D.; Guan J. S.; Wang W. Y.; Seo J.; Hennig K. M.; Nieland T. J.; Fass D. M.; Kao P. F.; Kahn M.; Su S. C.; Samiei A.; Joseph N.; Haggarty S. J.; Delalle I.; Tsai L. H. An epigenetic blockade of cognitive functions in the neurodegenerating brain. Nature 2012, 483, 222–226. [DOI] [PMC free article] [PubMed] [Google Scholar]
- Zhang L.; Sheng S.; Qin C. The role of HDAC6 in Alzheimer’s disease. J. Alzheimer’s Dis. 2013, 33, 283–295. [DOI] [PubMed] [Google Scholar]
- Jakovcevski M.; Bharadwaj R.; Straubhaar J.; Gao G.; Gavin D. P.; Jakovcevski I.; Mitchell A. C.; Akbarian S. Prefrontal cortical dysfunction after overexpression of histone deacetylase 1. Biol. Psychiatry 2013, 74, 696–705. [DOI] [PMC free article] [PubMed] [Google Scholar]
- Morris M. J.; Mahgoub M.; Na E. S.; Pranav H.; Monteggia L. M. Loss of histone deacetylase 2 improves working memory and accelerates extinction learning. J. Neurosci. 2013, 33, 6401–6411. [DOI] [PMC free article] [PubMed] [Google Scholar]
- Cao D. J.; Wang Z. V.; Battiprolu P. K.; Jiang N.; Morales C. R.; Kong Y.; Rothermel B. A.; Gillette T. G.; Hill J. A. Histone deacetylase (HDAC) inhibitors attenuate cardiac hypertrophy by suppressing autophagy. Proc. Natl. Acad. Sci. U.S.A. 2011, 108, 4123–4128. [DOI] [PMC free article] [PubMed] [Google Scholar]
- Ferguson B. S.; Harrison B. C.; Jeong M. Y.; Reid B. G.; Wempe M. F.; Wagner F. F.; Holson E. B.; McKinsey T. A. Signal-dependent repression of DUSP5 by class I HDACs controls nuclear ERK activity and cardiomyocyte hypertrophy. Proc. Natl. Acad. Sci. U.S.A. 2013, 110, 9806–9811. [DOI] [PMC free article] [PubMed] [Google Scholar]
- Barnes P. J. Corticosteroid resistance in patients with asthma and chronic obstructive pulmonary disease. J. Allergy. Clin. Immunol. 2013, 131, 636–645. [DOI] [PubMed] [Google Scholar]
- Brochier C.; Dennis G.; Rivieccio M. A.; McLaughlin K.; Coppola G.; Ratan R. R.; Langley B. Specific acetylation of p53 by HDAC inhibition prevents DNA damage-induced apoptosis in neurons. J. Neurosci. 2013, 33, 8621–8632. [DOI] [PMC free article] [PubMed] [Google Scholar]
- Zhang Z.; Yamashita H.; Toyama T.; Sugiura H.; Omoto Y.; Ando Y.; Mita K.; Hamaguchi M.; Hayashi S.; Iwase H. HDAC6 expression is correlated with better survival in breast cancer. Clin. Cancer Res. 2004, 10, 6962–6968. [DOI] [PubMed] [Google Scholar]
- Rajendran P.; Kidane A. I.; Yu T. W.; Dashwood W. M.; Bisson W. H.; Lohr C. V.; Ho E.; Williams D. E.; Dashwood R. H. HDAC turnover, CtIP acetylation and dysregulated DNA damage signaling in colon cancer cells treated with sulforaphane and related dietary isothiocyanates. Epigenetics 2013, 8, 612–623. [DOI] [PMC free article] [PubMed] [Google Scholar]
- Cai Y.; Geutjes E. J.; de Lint K.; Roepman P.; Bruurs L.; Yu L. R.; Wang W.; van Blijswijk J.; Mohammad H.; de Rink I.; Bernards R.; Baylin S. B. The NuRD complex cooperates with DNMTs to maintain silencing of key colorectal tumor suppressor genes. Oncogene 2014, 33, 2157–2168. [DOI] [PMC free article] [PubMed] [Google Scholar]
- Kim M. G.; Pak J. H.; Choi W. H.; Park J. Y.; Nam J. H.; Kim J. H. The relationship between cisplatin resistance and histone deacetylase isoform overexpression in epithelial ovarian cancer cell lines. J. Gynecol. Oncol. 2012, 23, 182–189. [DOI] [PMC free article] [PubMed] [Google Scholar]
- Hayashi A.; Horiuchi A.; Kikuchi N.; Hayashi T.; Fuseya C.; Suzuki A.; Konishi I.; Shiozawa T. Type-specific roles of histone deacetylase (HDAC) overexpression in ovarian carcinoma: HDAC1 enhances cell proliferation and HDAC3 stimulates cell migration with downregulation of E-cadherin. Int. J. Cancer. 2010, 127, 1332–1346. [DOI] [PubMed] [Google Scholar]
- Benes F. M.; Lim B.; Matzilevich D.; Walsh J. P.; Subburaju S.; Minns M. Regulation of the GABA cell phenotype in hippocampus of schizophrenics and bipolars. Proc. Natl. Acad. Sci. U.S.A. 2007, 104, 10164–10169. [DOI] [PMC free article] [PubMed] [Google Scholar]
- Broide R. S.; Redwine J. M.; Aftahi N.; Young W.; Bloom F. E.; Winrow C. J. Distribution of histone deacetylases 1–11 in the rat brain. J. Mol. Neurosci. 2007, 31, 47–58. [DOI] [PubMed] [Google Scholar]
- Hooker J. M.; Kim S. W.; Alexoff D.; Xu Y.; Shea C.; Reid A.; Volkow N.; Fowler J. S. Histone deacetylase inhibitor, MS-275, exhibits poor brain penetration: PK studies of [11C]MS-275 using Positron Emission Tomography. ACS Chem. Neurosci. 2010, 1, 65–73. [DOI] [PMC free article] [PubMed] [Google Scholar]
- Yeh H. H.; Tian M.; Hinz R.; Young D.; Shavrin A.; Mukhapadhyay U.; Flores L. G.; Balatoni J.; Soghomonyan S.; Jeong H. J.; Pal A.; Uthamanthil R.; Jackson J. N.; Nishi R.; Mizuma H.; Onoe H.; Kagawa S.; Higashi T.; Fukumitsu N.; Alauddin M.; Tong W.; Herholz K.; Gelovani J. G. Imaging epigenetic regulation by histone deacetylases in the brain using PET/MRI with (1)(8)F-FAHA. Neuroimage 2013, 64, 630–639. [DOI] [PMC free article] [PubMed] [Google Scholar]
- Hendricks J. A.; Keliher E. J.; Marinelli B.; Reiner T.; Weissleder R.; Mazitschek R. In vivo PET imaging of histone deacetylases by 18F-suberoylanilide hydroxamic acid (18F-SAHA). J. Med. Chem. 2011, 54, 5576–5582. [DOI] [PMC free article] [PubMed] [Google Scholar]
- Seo Y. J.; Kang Y.; Muench L.; Reid A.; Caesar S.; Jean L.; Fevier-Wagner F.; Holson E. B.; Haggarty S. J.; Weiss P.; King P.; Carter P.; Volkow N. D.; Fowler J. S.; Hooker J. M.; Kim S. W. Image-guided synthesis reveals potent blood-brain barrier permeable histone deacetylase inhibitors. ACS Chem. Neurosci. 2014, 5, 588–596. [DOI] [PMC free article] [PubMed] [Google Scholar]
- Seo Y. J.; Muench L.; Reid A.; Chen J.; Kang Y.; Hooker J. M.; Volkow N. D.; Fowler J. S.; Kim S. W. Radionuclide labeling and evaluation of candidate radioligands for PET imaging of histone deacetylase in the brain. Bioorg. Med. Chem. Lett. 2013, 23, 6700–6705. [DOI] [PMC free article] [PubMed] [Google Scholar]
- Hanson J. E.; La H.; Plise E.; Chen Y. H.; Ding X.; Hanania T.; Sabath E. V.; Alexandrov V.; Brunner D.; Leahy E.; Steiner P.; Liu L.; Scearce-Levie K.; Zhou Q. SAHA enhances synaptic function and plasticity in vitro but has limited brain availability in vivo and does not impact cognition. PLoS One 2013, 8, e69964. [DOI] [PMC free article] [PubMed] [Google Scholar]
- Maugh T. H. 2nd Panel urges wide use of antiviral drug. Science 1979, 206, 1058–1060. [DOI] [PubMed] [Google Scholar]
- Banister S. D.; Wilkinson S. M.; Longworth M.; Stuart J.; Apetz N.; English K.; Brooker L.; Goebel C.; Hibbs D. E.; Glass M.; Connor M.; McGregor I. S.; Kassiou M. The synthesis and pharmacological evaluation of adamantane-derived indoles: cannabimimetic drugs of abuse. ACS Chem. Neurosci. 2013, 4, 1081–1092. [DOI] [PMC free article] [PubMed] [Google Scholar]
- Gopalan B.; Ponpandian T.; Kachhadia V.; Bharathimohan K.; Vignesh R.; Sivasudar V.; Narayanan S.; Mandar B.; Praveen R.; Saranya N.; Rajagopal S. Discovery of adamantane based highly potent HDAC inhibitors. Bioorg. Med. Chem. Lett. 2013, 23, 2532–2537. [DOI] [PubMed] [Google Scholar]
- Farde L.; Eriksson L.; Blomquist G.; Halldin C. Kinetic analysis of central [11C]raclopride binding to D2-dopamine receptors studied by PET--a comparison to the equilibrium analysis. J. Cereb. Blood Flow Metab. 1989, 9, 696–708. [DOI] [PubMed] [Google Scholar]
- Innis R. B.; Cunningham V. J.; Delforge J.; Fujita M.; Gjedde A.; Gunn R. N.; Holden J.; Houle S.; Huang S. C.; Ichise M.; Iida H.; Ito H.; Kimura Y.; Koeppe R. A.; Knudsen G. M.; Knuuti J.; Lammertsma A. A.; Laruelle M.; Logan J.; Maguire R. P.; Mintun M. A.; Morris E. D.; Parsey R.; Price J. C.; Slifstein M.; Sossi V.; Suhara T.; Votaw J. R.; Wong D. F.; Carson R. E. Consensus nomenclature for in vivo imaging of reversibly binding radioligands. J. Cereb. Blood Flow Metab. 2007, 27, 1533–1539. [DOI] [PubMed] [Google Scholar]
- Wang Y.; Zhang Y. L.; Hennig K.; Gale J. P.; Hong Y.; Cha A.; Riley M.; Wagner F.; Haggarty S. J.; Holson E.; Hooker J. Class I HDAC imaging using [ (3)H]CI-994 autoradiography. Epigenetics 2013, 8, 756–764. [DOI] [PMC free article] [PubMed] [Google Scholar]
- Schroeder F. A.; Lewis M. C.; Fass D. M.; Wagner F. F.; Zhang Y. L.; Hennig K. M.; Gale J.; Zhao W. N.; Reis S.; Barker D. D.; Berry-Scott E.; Kim S. W.; Clore E. L.; Hooker J. M.; Holson E. B.; Haggarty S. J.; Petryshen T. L. A selective HDAC 1/2 inhibitor modulates chromatin and gene expression in brain and alters mouse behavior in two mood-related tests. PLoS One 2013, 8, e71323. [DOI] [PMC free article] [PubMed] [Google Scholar]
- Fass D. M.; Schroeder F. A.; Perlis R. H.; Haggarty S. J. Epigenetic mechanisms in mood disorders: Targeting neuroplasticity. Neuroscience 2014, 264, 112–130. [DOI] [PMC free article] [PubMed] [Google Scholar]
- Davies G.; Tenesa A.; Payton A.; Yang J.; Harris S. E.; Liewald D.; Ke X.; Le Hellard S.; Christoforou A.; Luciano M.; McGhee K.; Lopez L.; Gow A. J.; Corley J.; Redmond P.; Fox H. C.; Haggarty P.; Whalley L. J.; McNeill G.; Goddard M. E.; Espeseth T.; Lundervold A. J.; Reinvang I.; Pickles A.; Steen V. M.; Ollier W.; Porteous D. J.; Horan M.; Starr J. M.; Pendleton N.; Visscher P. M.; Deary I. J. Genome-wide association studies establish that human intelligence is highly heritable and polygenic. Mol. Psychiatry 2011, 16, 996–1005. [DOI] [PMC free article] [PubMed] [Google Scholar]
- McPherson R. From genome-wide association studies to functional genomics: new insights into cardiovascular disease. Can. J. Cardiol. 2013, 29, 23–29. [DOI] [PubMed] [Google Scholar]
- Torres J. M.; Cox N. J.; Philipson L. H. Genome wide association studies for diabetes: perspective on results and challenges. Pediatr. Diabetes 2013, 14, 90–96. [DOI] [PubMed] [Google Scholar]
- Mells G. F.; Kaser A.; Karlsen T. H. Novel insights into autoimmune liver diseases provided by genome-wide association studies. J. Autoimmun. 2013, 46, 41–54. [DOI] [PubMed] [Google Scholar]
- Bowcock A. M. Genome-wide association studies and infectious disease. Crit. Rev. Immunol. 2010, 30, 305–309. [DOI] [PubMed] [Google Scholar]
- Xu C.; Aragam N.; Li X.; Villla E. C.; Wang L.; Briones D.; Petty L.; Posada Y.; Arana T. B.; Cruz G.; Mao C.; Camarillo C.; Su B. B.; Escamilla M. A.; BCL9 Wang K. and C9orf5 are associated with negative symptoms in schizophrenia: meta-analysis of two genome-wide association studies. PLoS One 2013, 8, e51674. [DOI] [PMC free article] [PubMed] [Google Scholar]
- Wang C.; Schroeder F. A.; Hooker J. M. Visualizing epigenetics: Current advances and advantages in HDAC PET imaging techniques. Neuroscience 2014, 264, 186–197. [DOI] [PMC free article] [PubMed] [Google Scholar]
- Tang J.; Yan Y.; Zhao T. C.; Gong R.; Bayliss G.; Yan H.; Zhuang S.; Class I. HDAC activity is required for renal protection and regeneration after acute kidney injury. Am. J. Physiol. Renal Physiol. 2014, 307, F303–16. [DOI] [PMC free article] [PubMed] [Google Scholar]
- Schroeder F. A.; Lin C. L.; Crusio W. E.; Akbarian S. Antidepressant-like effects of the histone deacetylase inhibitor, sodium butyrate, in the mouse. Biol. Psychiatry 2007, 62, 55–64. [DOI] [PubMed] [Google Scholar]
- Reid A. E.; Hooker J.; Shumay E.; Logan J.; Shea C.; Kim S. W.; Collins S.; Xu Y.; Volkow N.; Fowler J. S. Evaluation of 6-([(18)F]fluoroacetamido)-1-hexanoicanilide for PET imaging of histone deacetylase in the baboon brain. Nucl. Med. Biol. 2009, 36, 247–258. [DOI] [PMC free article] [PubMed] [Google Scholar]
- Black K. J.; Koller J. M.; Snyder A. Z.; Perlmutter J. S. Atlas template images for nonhuman primate neuroimaging: baboon and macaque. Methods Enzymol. 2004, 385, 91–102. [DOI] [PubMed] [Google Scholar]
- Logan J.; Fowler J. S.; Volkow N. D.; Wang G. J.; Ding Y. S.; Alexoff D. L. Distribution volume ratios without blood sampling from graphical analysis of PET data. J. Cereb. Blood Flow Metab. 1996, 16, 834–840. [DOI] [PubMed] [Google Scholar]
- Bantscheff M.; Hopf C.; Savitski M. M.; Dittmann A.; Grandi P.; Michon A. M.; Schlegl J.; Abraham Y.; Becher I.; Bergamini G.; Boesche M.; Delling M.; Dumpelfeld B.; Eberhard D.; Huthmacher C.; Mathieson T.; Poeckel D.; Reader V.; Strunk K.; Sweetman G.; Kruse U.; Neubauer G.; Ramsden N. G.; Drewes G. Chemoproteomics profiling of HDAC inhibitors reveals selective targeting of HDAC complexes. Nat. Biotechnol. 2011, 29, 255–265. [DOI] [PubMed] [Google Scholar]
Associated Data
This section collects any data citations, data availability statements, or supplementary materials included in this article.