Significance
This work demonstrates a structure–property correlation in metallic glasses for the community of amorphous solids. It associates geometrically unfavored motifs, i.e., those most disordered local polyhedral packing structures in a metallic glass, with the soft spots defined from the vibrational modes and correlates them with shear transformation zones composed of atoms with large nonaffine displacements. The statistical correlation established thus ties together the heterogeneity inherent in the amorphous structure with the spatial heterogeneity in the mechanical (elastic and plastic) properties of a metallic glass.
Keywords: liquid-like regions, heterogeneity, structure–property relationship, uncommon motifs, shear transformation zones
Abstract
In a 3D model mimicking realistic Cu64Zr36 metallic glass, we uncovered a direct link between the quasi-localized low-frequency vibrational modes and the local atomic packing structure. We also demonstrate that quasi-localized soft modes correlate strongly with fertile sites for shear transformations: geometrically unfavored motifs constitute the most flexible local environments that encourage soft modes and high propensity for shear transformations, whereas local configurations preferred in this alloy, i.e., the full icosahedra (around Cu) and Z16 Kasper polyhedra (around Zr), contribute the least.
Metallic glasses (MGs) have an inherently inhomogeneous internal structure, with a wide spectrum of atomic-packing heterogeneities (1–4). As a result, an a priori identification of structural defects that carry atomic rearrangements (strains) under imposed stimuli such as temperature and externally applied stresses has always been a major challenge (3–6). In several quasi-2D or 3D models of amorphous solids (such as jammed packings of soft spheres interacting via repulsive potentials or colloidal particles), low-frequency vibrational normal modes have been characterized, and it has recently been demonstrated that some of these modes are quasi-localized (7–14). A population of “soft spots” has been identified among them in terms of their low-energy barriers for local rearrangements (13, 14), correlating also with properties in supercooled liquids such as dynamic heterogeneity (15–17). However, it is not certain where the soft spots are in realistic MGs (18), in terms of an explicit correlation with local atomic packing and topological arrangements (18–20). In particular, there is a pressing need to determine whether it is possible to identify shear transformation zones, i.e., the local defects that carry inelastic deformation (21, 22). Accomplishing this would permit the characterization of MG microstructure in a way that directly ties atomic configuration with mechanical response beyond the elastic regime. We will show here that there is indeed a correlation between soft modes and atoms that undergo shear transformations, and both have their structural signature in specific atomic packing environments defined in terms of coordination polyhedra (3).
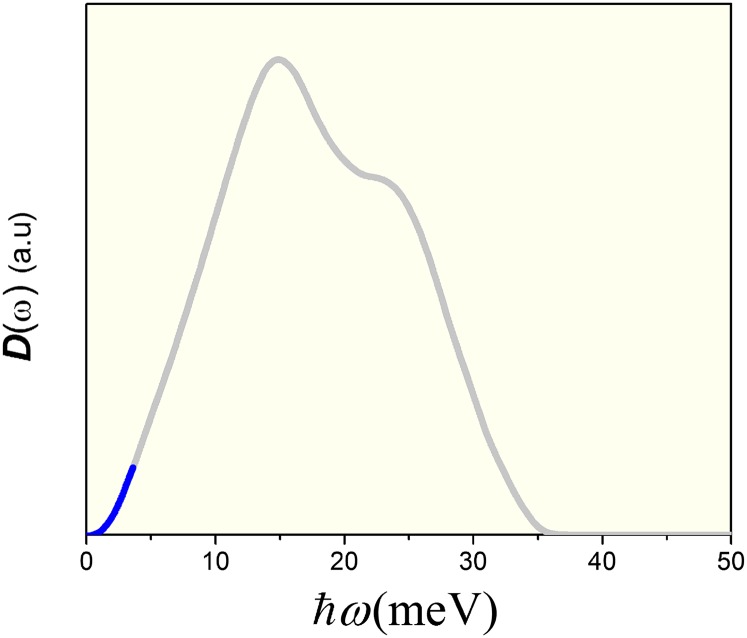
Fig. 1 displays the vibrational density of states (V-DOS), D(ω), calculated from the eigen-frequencies obtained by normal mode analysis of the Cu64Zr36MG prepared with a cooling rate of 109 K/s (Methods). The main peak stays around 14 meV and becomes only slightly narrower (or wider) when the cooling rate used to prepare the MG is slower (or faster), as seen in Fig. S1; the glasses cooled at slower rates exhibit fewer low-frequency (or low-energy) vibrational modes. The blue portion in Fig. 1 indicates the 1% lowest-frequency normal modes, which will be summed over in our calculations of the participation fraction, Pi, in soft modes (Methods). Those low-frequency vibrational modes are confirmed to be quasi-localized, similar to previous work on 2D models (15), as they involve a compact group of atoms on the basis of the amplitude distribution of their corresponding eigenvectors (also see the contour maps in Fig. 4).
Fig. 1.
V-DOS of the inherent structure for Cu64Zr36 MG produced with the cooling rate of 109 K/s. The blue portion indicates the 1% lowest frequency normal modes that were summed over to calculate the participation fraction (in soft modes) of atoms.
Fig. 4.
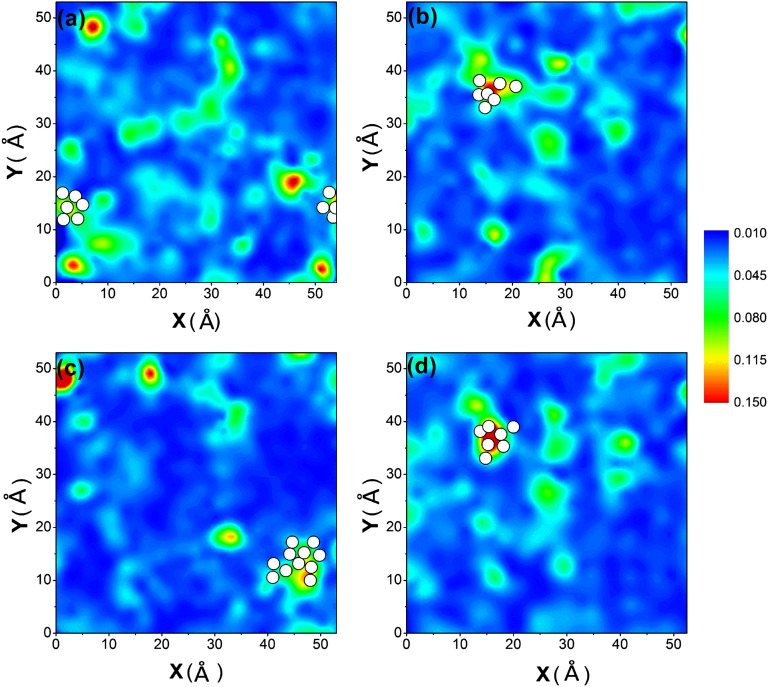
Contoured maps showing the spatial distribution of participation fraction Pi (see sidebar) for Cu and Zr atoms in the Cu64Zr36 metallic glass with the cooling rate of 109 K/s. The four sampled representative thin slabs (A–D) each has a thickness of 2.5 Å. White spots superimposed in the maps mark the locations of atoms that have experienced clear shear transformations (Methods) under AQS to a strain of 5%.
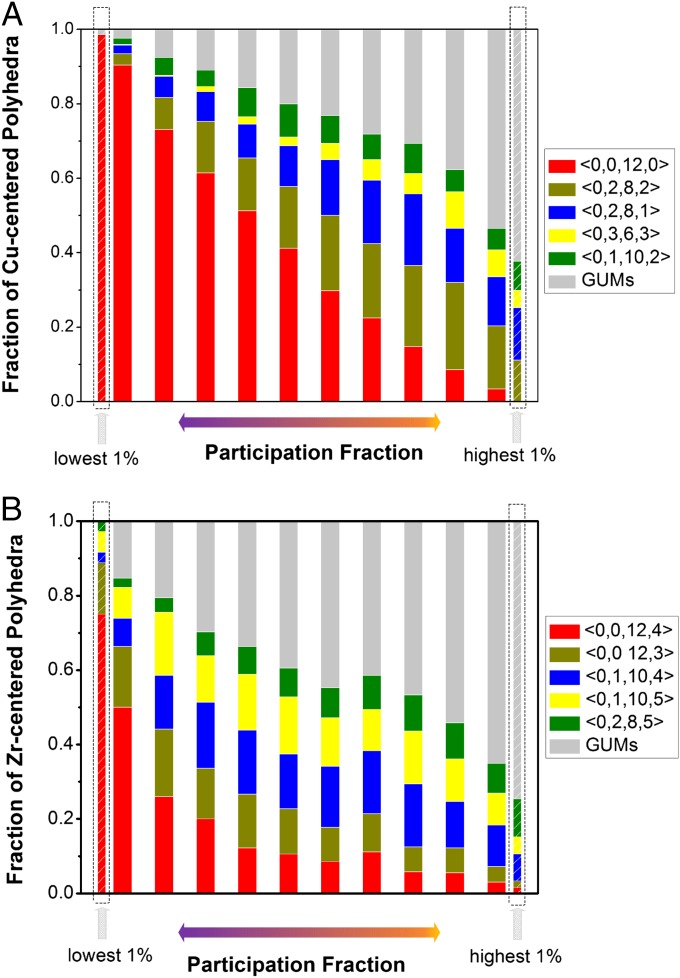
We first demonstrate that certain types of coordination polyhedra, specifically those geometrically unfavored motifs (GUMs), contribute preferentially to the quasi-localized soft modes identified above, whereas the geometrically preferable clusters at this alloy composition represent the short-range order that participate the least. To establish the connection between the low-frequency modes and atomic packing structure, we analyze the latter first from the perspective of Cu-centered coordination polyhedra (23), in terms of the Pi of Cu atoms that are in the center of different types of polyhedra. In Fig. 2A, from left to right, each solid bar represents a bin that contains 10% of all of the Cu atoms, in ascending order from the lowest to the highest Pi. In addition, the 1% Cu atoms with the lowest Pi and the top 1% with the highest Pi are displayed on either end, each with a separate bar. The Cu atoms in full icosahedra (with Voronoi index <0, 0, 12, 0>) dominate the lowest Pi, which is consistent with the notion that full icosahedra are the short-range order most energetically and geometrically comfortable and hence least likely to participate in soft spots at this MG composition (23). Specifically, ∼98% of the Cu atoms with the 1% lowest participation fraction are enclosed in <0, 0, 12, 0>, which is much greater than the average value that ∼40% of Cu atoms center full icosahedra in this MG sample (23). In stark contrast, the local configurations on the other end of the coordination polyhedra spectrum, i.e., the GUMs (see examples below) that deviate considerably from the coordination number (CN) = 12 full icosahedra and their close cousins (Fig. 2), are not found at all among the atoms with the lowest 1% participation fraction. For the 1% of Cu atoms with the highest participation fraction, GUMs account for as high as 63%, whereas the share of full icosahedra is as low as only 1.1%. This observation clearly indicates that atoms involved with soft spots in low-frequency normal modes (i.e., soft modes) are those with the most unfavorable local coordination polyhedra.
Fig. 2.
Atoms at the center of different types of (A) Cu-centered and (B) Zr-centered coordination polyhedra contribute differently to low-frequency normal modes. Each solid bar contains 10% of all of the Cu (or Zr) atoms; from left to right, the bins are ordered from the lowest to the highest participation fraction. Two additional bars describe the makeup of atoms contributing to the lowest 1% participation fraction and the highest 1% participation fraction, respectively. The latter is seen to be dominated by Cu (or Zr) atoms in GUMs.
We also examined the dependence on local environments for Zr atoms. A plot analogous to Fig. 2A, this time for Zr-centered coordination polyhedra, is shown in Fig. 2B. From left to right, each solid bar represents a bin that contains 10% of all of the Zr atoms, in ascending order from the lowest to the highest Pi. In addition, the 1% Zr atoms with the lowest Pi and the top 1% with the highest Pi are displayed on either end, each with a separate bar. The most favorable Zr-centered Kasper polyhedra in this MG are of the Z16 type (<0, 0, 12, 4>) (23). Interestingly, for the Zr atoms with the 1% lowest participation fraction, ∼75% of them are enclosed in <0, 0, 12, 4>, which is much greater than the sample average of ∼17% in this MG (23). In contrast, GUMs that deviate considerably from the CN = 16 Kasper polyhedra and their close cousins (Fig. 2) only constitute ∼5%. Conversely, for the 1% of Zr atoms with the highest participation fraction, GUMs account for as high as 76%, whereas the share of Z16 clusters is as low as 1.6%.
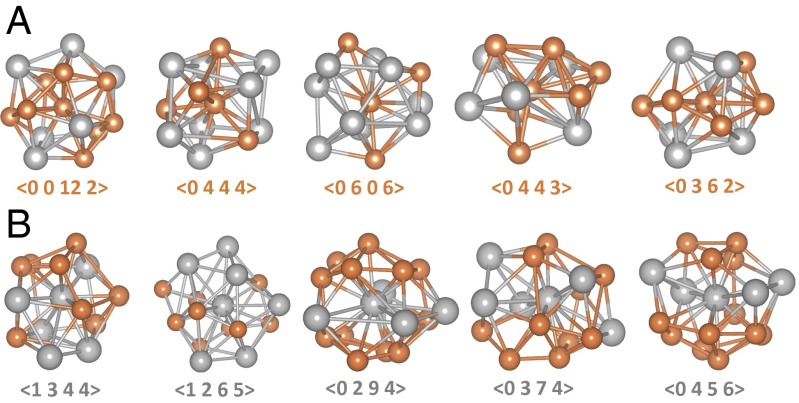
We now illustrate the GUMs, i.e., the typical types of coordination polyhedra that are strongly correlated with the soft modes. Fig. 3 A and B illustrates the local environments of the top five Cu atoms and Zr atoms, respectively, i.e., those with the highest participation fractions. For these five Cu-centered GUMs, the coordination polyhedra have Voronoi indices of <0, 0, 12, 2>, <0, 4, 4, 4>, <0, 6, 0, 6>, <0, 4, 4, 3>, and <0, 3, 6, 2>. For the five Zr GUMs, they are <1, 3, 4, 4>, <1, 2, 6, 5>, <0, 2, 9, 4>, <0, 3, 7, 4>, and <0, 4, 5, 6>. Clearly, they are among the polyhedra that deviate most significantly from the geometrically preferable Frank-Kasper polyhedra <0, 0, 12, 0> (for Cu) and <0, 0, 12, 4> (for Zr). Specifically, they are non-Kasper polyhedra and contain an increased density of extrinsic (e.g., fourfold) disclinations (3) at the favored CN, or clusters (including Kasper polyhedra) with unfavorable (too large or too small) CNs. In fact, those Zr-centered GUMs even contain sevenfold bonds, e.g., <1, 3, 4, 4> is actually <1, 3, 4, 4, 1> (except for these Zr-centered GUMs, the fifth digit is zero in the Voronoi indices for all the other coordination polyhedra in this work). From the perspective of either constituent element, Cu or Zr, these are the most geometrically unfavored clusters at the given alloy composition and atomic size ratio. According to ref. 24, transverse vibrational modes associated with defective (more disordered) soft structures could also be an origin of the boson peak [the excess rise in the D(ω) at low-frequency vibrational modes].
Fig. 3.
Configurations of five different (A) Cu-centered and (B) Zr-centered polyhedra, in which the center atoms are the top five atoms with the highest participation fractions for each constituent species. These are representatives of GUMs in this MG. Orange spheres are for Cu atoms and silver ones for Zr atoms.
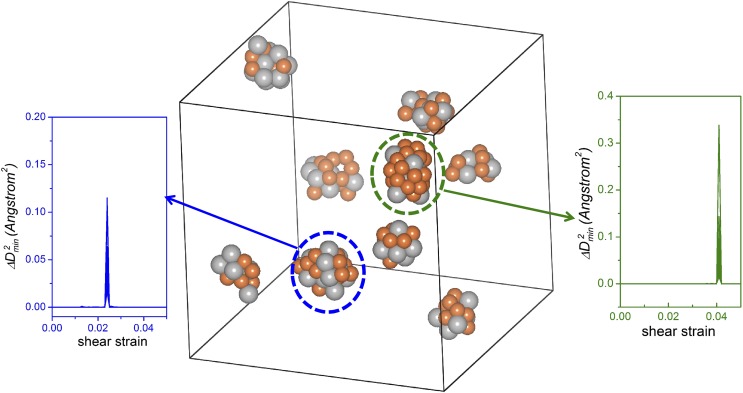
The next task at hand is to correlate the relaxation events with vibrational modes. In a 2D sheared model glass, Manning et al. (14) recently associated low-frequency vibrational modes with soft spots where particle rearrangements are initiated. Here we use a similar analysis on our 3D realistic Cu64Zr36 glass. The contoured maps of participation fraction Pi for all of the (Cu and Zr) atoms inside four representative slabs, each with a thickness of 2.5 Å (roughly the average atomic spacing), are plotted in Fig. 4 A–D. We notice that the Pi distributions are heterogeneous: atoms that participated the most in soft modes tend to aggregate together, with a typical correlation length of ∼1 nm. For a direct comparison, the local atomic rearrangements in sheared Cu64Zr36 MG [under athermal quasi-static shear (AQS) to a global shear strain γ = 5%, well before global yielding/flow of the entire sample at γ ∼ 12%] are superimposed in Fig. 4 A–D, where white spheres represent the (Cu or Zr) atoms that have experienced the most obvious shear transformations (indicated by their large and simultaneous jumps of that are clearly above other atoms; Methods, Fig. S2, and SI Text). The distribution of these atoms is also inhomogeneous and, interestingly, almost always overlaps with the regions with high Pi. This observation is consistent with the correlation between quasi-localized low-frequency modes and low energy barriers (13). Fig. 5 displays the locations of all such Cu and Zr atoms in the simulation model, which are about 2% of the total number of atoms in the box. Two features are highly noteworthy. First, they cluster into patches (only 6 atoms are exceptions, being isolated in a group of <3 atoms), each comprising 10–40 atoms (Cu in orange and Zr in gray color). Second, the atoms in each cluster record a simultaneous jump in . Taken together, the spatial and temporal correlations clearly indicate that these are the clusters of atoms that each has been through a well-defined shear transformation. The several representative cases in Fig. 4 (and Fig. S3) give a visual illustration of the correlation that, under imposed deformation, the most obvious shear transformations have a strong tendency to arise from the collection of atoms involved in soft modes. Each group (cluster) of the activated atoms in Fig. 5 centers a shear transformation zone.
Fig. 5.
Cluster of atoms that have undergone obvious shear transformations (Methods) (24) in Cu64Zr36 MG sheared to γ = 5%. Atoms in each cluster are activated at the same time, as indicated by their simultaneous jump in at the same shear strain γ. Two such shear transformation zones are circled, with the Inset displaying the overlapping jumps of the atoms involved in each cluster.
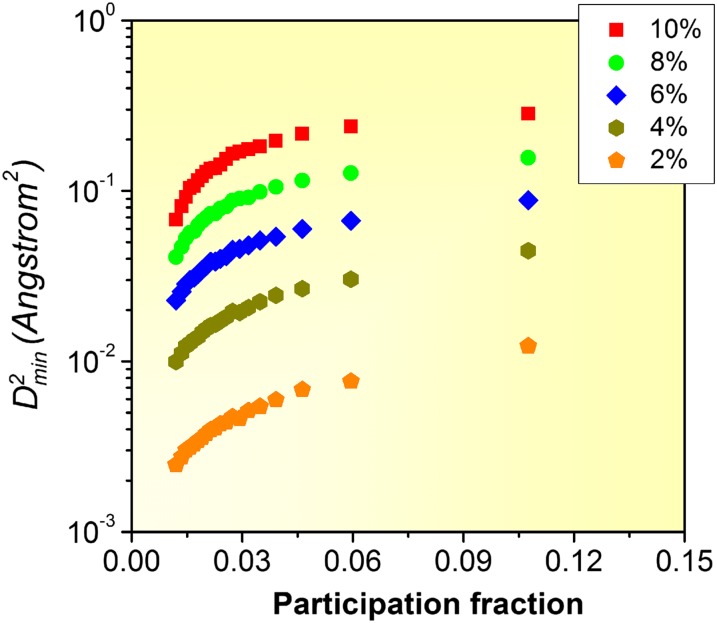
Note here that not all of the regions with the highest participation fraction Pi would undergo shear transformation for a particular loading condition, as seen in Fig. 4 and Fig. S3. One should keep in mind that such a local structure–property correlation in an amorphous system is expected to be statistical (better perceived in Fig. 6), rather than deterministic with a one-to-one correspondence (12, 14). The soft spots are only candidates for potential shear transformation zones. The ones actually activated are not necessarily the softest, and would be determined by the loading direction and local stress field interacting with the anisotropy of the soft spots. The statistical correlation is obvious for the entire range of imposed γ, from 2% to 10%. The contour maps similar to those in Fig. 4 for γ = 10% (before global yielding) are shown in Fig. S3. As another way to see this correlation, we present in Fig. 6 a plot correlating the average participation fraction with (with respect to the undeformed configuration) for γ from 2% to 10%. Each data point is an average for 5% of all of the atoms inside a bin (each bin contains atoms grouped in ascending participation fraction). Obviously, the atoms with higher participation in soft mode contribute more to the nonaffine deformation and therefore shear transformations. This trend persists throughout the entire range of strains we studied and is therefore statistically valid for all the atoms in the metallic glass.
Fig. 6.
Correlation between the average (with reference to undeformed configuration) with participation fraction Pi for all of the (Cu and Zr) atoms in the Cu64Zr36 MG deformed to different γ levels (2–10%). Each data point is the average for 5% of all of the atoms, sorted in the order of increasing Pi.
In conclusion, we identified soft spots in an MG. They are soft in the sense that the atoms (Cu and Zr in our case) in those local environments participate preferentially in soft vibrational modes and at the same time they have the highest propensity to undergo shear transformations. These two aspects are found to be strongly correlated: shear transformations in an MG preferentially occur at localized soft modes. In the language of the potential energy landscape, we established a correlation between the curvature at the bottom of the basin (stiffness) with the barrier for transitions between basins (energy barrier against reconfiguration). Importantly, we showed that both have a common signature in the local atomic packing environments: the GUMs are the local configurations most prone to instability. The GUMs, as the most disordered atomic arrangements, hence tend to constitute or center the “liquid-like regions” often hypothesized in the literature (4, 5, 25). They tend to be soft and fertile for shear transformations. Such a correlation, albeit statistical (not all soft modes or GUMs would be activated to undergo shear transformations for a given stress state/magnitude and loading duration), is very useful and important as a step forward in establishing a concrete structure–property relationship for MGs, i.e., a direct connection between short-range order and vibrational soft modes, as well as stress-induced atomic rearrangements. The spatial distribution of nanometer-scale patches observed in Fig. 4 and Fig. S3 (a 3D view from outside the MD box is in Fig. S4), in terms of property (soft spots) and corresponding structure (GUMs), may also help explain the origin of the heterogeneity in local elastic modulus and local viscoelasticity recently mapped out in experiments (26–28).
Methods
Our molecular dynamics (MD) simulations used the embedded atom method (EAM) potentials optimized for realistic amorphous Cu–Zr structures (29), using 10,000 atoms at the Cu64Zr36 composition. The MG was prepared by quenching the system at cooling rates between 109 and 1013 K/s from a liquid state equilibrated at 2,500 K using a Nose–Hoover thermostat (27). The external pressure was held at zero during the quenching process using a Parinello Rahman barostat (30). Periodic boundary conditions (PBCs) were applied in all three dimensions. Structural analysis was implemented using Voronoi tessellation to characterize the nearest-neighbor CN and short-range order (3). The normal mode analysis of the glass was conducted by diagonalizing the dynamical matrix of the MG inherent structure obtained using the conjugate-gradient (CG) method. The participation fraction of particle i in eigenmode eω is defined by , where is the corresponding polarization vector of particle i (15). Similar to ref. 15, was summed over a small fraction [1%, which is between the previously used cutoffs of 0.6% (14) and 1.5% (15); only slight variation was found when the cutoff criterion was varied over this range] of the lowest-frequency normal modes and denoted as the participation fraction Pi for the ith atom, which measures the involvement in soft modes for that atom. AQS (31) was imposed on the MG to different shear strains (γ) to induce atomic rearrangements during deformation, which were monitored using the local minimum nonaffine displacement () (22, 32) (SI Text). To identify the atoms most likely involved in shear transformation zones, the atomic strain of each atom was tracked during deformation and dissociated into the best affine fit and the nonaffine residue (22). When a shear transformation event sets in, the group of atoms contributing to the shape change cooperatively rearrange relative to one another, such that there will be a jump in to different magnitudes for each of the atoms involved. SI Text and Fig. S2 present the details of our procedure to monitor the jumps. The Cu and Zr atoms that are located next to one another and undergo simultaneous jumps are identified as those that have experienced an obvious shear transformation and contributed the most to inelastic relaxation.
Supplementary Material
Acknowledgments
We thank H. W. Sheng and P. F. Guan for valuable discussions. J.D. and E.M. were supported at Johns Hopkins University by US Department of Energy, Basic Energy Science, Division of Materials Sciences and Engineering Contract DE-FG02-09ER46056. The computer simulations were performed using the National Energy Research Scientific Computing Center (NERSC) supercomputers. Y.C. was supported by the Scientific User Facilities Division, Office of Basic Energy Sciences, US Department of Energy. M.L.F. and S.P. were supported at Johns Hopkins University by US National Science Foundation Grant DMR-1107838.
Footnotes
The authors declare no conflict of interest.
This article is a PNAS Direct Submission.
This article contains supporting information online at www.pnas.org/lookup/suppl/doi:10.1073/pnas.1412095111/-/DCSupplemental.
References
- 1.Sheng HW, Luo WK, Alamgir FM, Bai JM, Ma E. Atomic packing and short-to-medium-range order in metallic glasses. Nature. 2006;439(7075):419–425. doi: 10.1038/nature04421. [DOI] [PubMed] [Google Scholar]
- 2.Miracle DB. A structural model for metallic glasses. Nat Mater. 2004;3(10):697–702. doi: 10.1038/nmat1219. [DOI] [PubMed] [Google Scholar]
- 3.Cheng YQ, Ma E. Atomic-level structure and structure–property relationship in metallic glasses. Prog Mater Sci. 2011;56(4):379–473. [Google Scholar]
- 4.Dmowski W, Iwashita T, Chuang CP, Almer J, Egami T. Elastic heterogeneity in metallic glasses. Phys Rev Lett. 2010;105(20):205502. doi: 10.1103/PhysRevLett.105.205502. [DOI] [PubMed] [Google Scholar]
- 5.Egami T. Atomic level stresses. Prog Mater Sci. 2011;56(6):637–653. [Google Scholar]
- 6.Spaepen F. A microscopic mechanism for steady state inhomogeneous flow in metallic glasses. Acta Metall. 1977;25(4):407–415. [Google Scholar]
- 7.Mazzacurati V, Ruocco G, Sampoli M. Low-frequency atomic motion in a model glass. Europhysics Letters. 1996;34(9):681–686. [Google Scholar]
- 8.Schober HR, Ruocco G. Size effects and quasilocalized vibrations. Philos Mag. 2004;84(13-16):1361–1372. [Google Scholar]
- 9.Schober HR, Laird BB. Localized low-frequency vibrational modes in glasses. Phys Rev B Condens Matter. 1991;44(13):6746–6754. doi: 10.1103/physrevb.44.6746. [DOI] [PubMed] [Google Scholar]
- 10.Kaya D, Green NL, Maloney CE, Islam MF. Normal modes and density of states of disordered colloidal solids. Science. 2010;329(5992):656–658. doi: 10.1126/science.1187988. [DOI] [PubMed] [Google Scholar]
- 11.Tan P, Xu N, Schofield AB, Xu L. Understanding the low-frequency quasilocalized modes in disordered colloidal systems. Phys Rev Lett. 2012;108(9):095501. doi: 10.1103/PhysRevLett.108.095501. [DOI] [PubMed] [Google Scholar]
- 12.Chen K, et al. Measurement of correlations between low-frequency vibrational modes and particle rearrangements in quasi-two-dimensional colloidal glasses. Phys Rev Lett. 2011;107(10):108301. doi: 10.1103/PhysRevLett.107.108301. [DOI] [PubMed] [Google Scholar]
- 13.Xu N, Vitelli V, Liu AJ, Nagel SR. Anharmonic and quasi-localized vibrations in jammed solids—Modes for mechanical failure. Europhysics Letters. 2010;90(5):56001. [Google Scholar]
- 14.Manning ML, Liu AJ. Vibrational modes identify soft spots in a sheared disordered packing. Phys Rev Lett. 2011;107(10):108302. doi: 10.1103/PhysRevLett.107.108302. [DOI] [PubMed] [Google Scholar]
- 15.Widmer-Cooper A, Perry H, Harrowell P, Reichman DR. Irreversible reorganization in a supercooled liquid originates from localized soft modes. Nat Phys. 2008;4(9):711–715. [Google Scholar]
- 16.Widmer-Cooper A, Perry H, Harrowell P, Reichman DR. Localized soft modes and the supercooled liquid’s irreversible passage through its configuration space. J Chem Phys. 2009;131(19):194508. doi: 10.1063/1.3265983. [DOI] [PubMed] [Google Scholar]
- 17.Mosayebi M, Ilg P, Widmer-Cooper A, Del Gado E. Soft modes and nonaffine rearrangements in the inherent structures of supercooled liquids. Phys Rev Lett. 2014;112(10):105503. doi: 10.1103/PhysRevLett.112.105503. [DOI] [PubMed] [Google Scholar]
- 18.Laird BB, Schober HR. Localized low-frequency vibrational modes in a simple model glass. Phys Rev Lett. 1991;66(5):636–639. doi: 10.1103/PhysRevLett.66.636. [DOI] [PubMed] [Google Scholar]
- 19.Sheng HW, Ma E, Kramer MJ. Relating dynamic properties to atomic structure in metallic glasses. The Journal of The Minerals, Metals & Materials Society. 2012;64(7):856–881. [Google Scholar]
- 20.Wyart M, Nagel S, Witten T. Geometric origin of excess low-frequency vibrational modes in weakly connected amorphous solids. Europhysics Letters. 2005;72(3):486–492. [Google Scholar]
- 21.Argon AS. Plastic deformation in metallic glasses. Acta Metall. 1979;27(1):47–58. [Google Scholar]
- 22.Falk ML, Langer JS. Dynamics of viscoplastic deformation in amorphous solids. Phys Rev E Stat Phys Plasmas Fluids Relat Interdiscip Topics. 1998;57(6):7192. [Google Scholar]
- 23.Ding J, Cheng YQ, Ma E. Full icosahedra dominate local order in Cu64Zr34 metallic glass and supercooled liquid. Acta Mater. 2014;69:343–354. [Google Scholar]
- 24.Shintani H, Tanaka H. Universal link between the boson peak and transverse phonons in glass. Nat Mater. 2008;7(11):870–877. doi: 10.1038/nmat2293. [DOI] [PubMed] [Google Scholar]
- 25.Ding J, Cheng YQ, Ma E. Quantitative measure of local solidity/liquidity in metallic glasses. Acta Mater. 2013;61(12):4474–4480. [Google Scholar]
- 26.Liu Y, et al. Characterization of nanoscale mechanical heterogeneity in a metallic glass by dynamic force microscopy. Phys Rev Lett. 2011;106(12):125504. doi: 10.1103/PhysRevLett.106.125504. [DOI] [PubMed] [Google Scholar]
- 27.Wagner H, et al. Local elastic properties of a metallic glass. Nature Materials. 2011;10(6):439–442. doi: 10.1038/nmat3024. [DOI] [PubMed] [Google Scholar]
- 28.Ye JC, Lu J, Liu CT, Wang Q, Yang Y. Atomistic free-volume zones and inelastic deformation of metallic glasses. Nature Materials. 2010;9(8):619–623. doi: 10.1038/nmat2802. [DOI] [PubMed] [Google Scholar]
- 29.Ding J, Cheng YQ, Sheng H, Ma E. Short-range structural signature of excess specific heat and fragility of metallic-glass-forming supercooled liquids. Phys Rev B. 2012;85(6):060201. [Google Scholar]
- 30.Allen MP, Tildesley DJ. Computer Simulation of Liquids. Oxford, UK: Clarendon Press; 1987. [Google Scholar]
- 31.Maloney CE, Lemaître A. Amorphous systems in athermal, quasistatic shear. Phys Rev E Stat Nonlin Soft Matter Phys. 2006;74(1 Pt 2):016118. doi: 10.1103/PhysRevE.74.016118. [DOI] [PubMed] [Google Scholar]
- 32.Ding J, Cheng YQ, Ma E. Correlating local structure with inhomogeneous elastic deformation in a metallic glass. Appl Phys Lett. 2012;101(12):121917. [Google Scholar]
Associated Data
This section collects any data citations, data availability statements, or supplementary materials included in this article.


