Significance
The III-nitride family of materials has already demonstrated tremendous optical efficiency and versatility for devices across a broad range of wavelengths. Quantum dots formed in these materials, with advantages such as improved carrier confinement, should offer even greater device efficiency. They are also important constituents for fundamental studies of light−matter interaction. However, that promise has been far from realized, and this is a complex problem to address. This work, through a comparative study of quantum dot, quantum well, and fragmented quantum well gain media in compact microdisk cavities, allows better understanding of the limitations to lasing for the quantum dot samples. These results allow both improved device efficiency and fundamental insights into quantum dot−cavity interactions in these materials.
Keywords: microdisk lasing, quantum dot lasers, nanophotonic devices, III-nitride lasers
Abstract
Low-threshold lasers realized within compact, high-quality optical cavities enable a variety of nanophotonics applications. Gallium nitride materials containing indium gallium nitride (InGaN) quantum dots and quantum wells offer an outstanding platform to study light−matter interactions and realize practical devices such as efficient light-emitting diodes and nanolasers. Despite progress in the growth and characterization of InGaN quantum dots, their advantages as the gain medium in low-threshold lasers have not been clearly demonstrated. This work seeks to better understand the reasons for these limitations by focusing on the simpler, limited-mode microdisk cavities, and by carrying out comparisons of lasing dynamics in those cavities using varying gain media including InGaN quantum wells, fragmented quantum wells, and a combination of fragmented quantum wells with quantum dots. For each gain medium, we use the distinctive, high-quality (Q∼5,500) modes of the cavities, and the change in the highest-intensity mode as a function of pump power to better understand the dominant radiative processes. The variations of threshold power and lasing wavelength as a function of gain medium help us identify the possible limitations to lower-threshold lasing with quantum dot active medium. In addition, we have identified a distinctive lasing signature for quantum dot materials, which consistently lase at wavelengths shorter than the peak of the room temperature gain emission. These findings not only provide better understanding of lasing in nitride-based quantum dot cavity systems but also shed insight into the more fundamental issues of light−matter coupling in such systems.
The family of III-nitrides materials is promising for the realization of photonic devices including light-emitting diodes and lasers (1–6). These systems have also been explored to engineer quantum emitters based on nitride quantum dots (QDs) that are active at room temperature and are suitable for applications in quantum information science (7). The increased control of the growth of isolated InGaN QDs in a high-quality GaN matrix has also resulted in fabrication of high-quality nitride microcavities including microdisks and photonic crystal cavities with emission at wavelengths in the blue spectral range (320−470 nm) (8, 9). Subsequently, electrically excited emitters and low-threshold lasers based on QDs as the gain medium have been studied (10, 11). However, despite the theoretical advantages of QD lasers, related to the density of electronic states for QDs (12–15), QD microcavity devices still have higher thresholds than quantum well (QW) microcavity devices for the nitride materials (8, 9, 16). Furthermore, InGaN QDs formed through a modified droplet epitaxy (MDE) method are always associated with an accompanying fragmented quantum well (fQW) layer. It is thus important to determine the possible influence of the fQW layer on lasing properties to achieve a better understanding of the unique contribution from the QDs to the lasing mechanism.
This work studies the lasing dynamics and the correlation between lasing threshold and lasing wavelength of microdisk lasers whose active areas comprise either QWs, fQWs, or a combination of QDs with fQWs. Through a detailed comparison of lasing in devices with the same geometries but with different active areas, we find that the distinctive signature of QD-facilitated gain is lasing at shorter wavelengths than the average of the background emission. The short wavelength emission is further confirmed by low-temperature, low-power photoluminescence (PL) measurements.
Results
Device Fabrication.
To investigate the dynamics of InGaN QD microcavity lasers, we simultaneously fabricated numerous 1.2-µm-diameter microdisk cavities from four wafers with an identical cavity design except for the three active layers embedded in c-plane GaN. The active layers were either composed of InxGa1-xN QWs, InxGa1-xN fQWs, or InxGa1-xN QDs + InxGa1-xN fQWs. Furthermore, the two QD+fQW samples (A and B) differed in the average density of QDs, and in the percentage of fQW comprising the active layer. The volume of InGaN QW in each sample was analyzed by an atomic force microscope (AFM), with the percentage of the surface covered by the QW layer as: 100% (QW), 78.3% (fQW), 75.3% (sample A), and 63.9% (Sample B). The QD density is estimated to be 2.8 ± 0.1 1010 cm−2 and 2.5 ± 0.1 109 cm−2 for samples A and B, respectively. To ensure that all samples exhibit similar room temperature PL peak emission wavelengths (450 nm ± 5 nm), the InGaN growth temperature was varied between 707°C and 755 °C to compensate for any loss of indium during annealing steps. Further details related to the material growth and characterization are described in Materials and Methods.
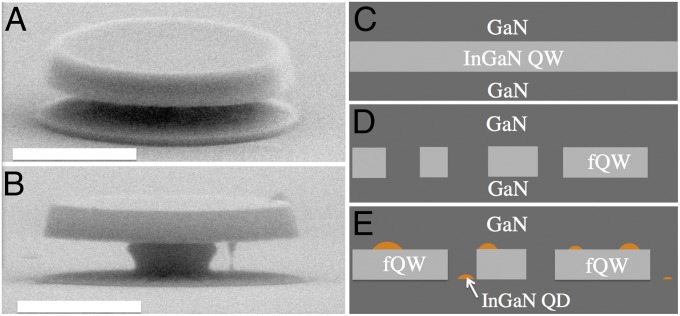
Microdisk cavities with equal diameters were consequently fabricated from these materials using reactive ion etching, and photoelectrochemical etching to achieve the final undercut structure of the microdisk. The fabrication of the microdisk cavities was identical to that described in previous work (2). The microdisks were designed to be 1.2 µm in diameter and 200 nm in thickness to have multiple modes widely spaced over the entire emission spectrum. Fig. 1 A and B shows representative SEM images of the completed microdisk cavities. Fig. 1 C−E gives schematics of the active layers in the QW, fQW, and fQW+QD devices, respectively.
Fig. 1.
Images and schematic of devices examined in this work. SEM image of the top (A) and side (B) view of a completed 1.2-μm GaN microdisk cavity. Scale bar, 500 nm in width. Schematic of one of the three active layers embedded in the QW (C), fQW (D), and fQW+QD (E) samples.
Optical Measurements.
Room temperature PL measurements were carried out to measure the quality factor of the microdisk cavities. Quality factors as high as 5,500 were measured from all samples, which is comparable with the best nitride microdisks currently achievable at these cavity dimensions (17). The devices were measured using a 100× objective in a standard microphotoluminescence setup in which a frequency-doubled pulsed titanium sapphire laser emitting at 380 nm was used to isolate the InGaN layers (bandgap ∼425 nm) from the GaN bulk emission (bandgap 360 nm).
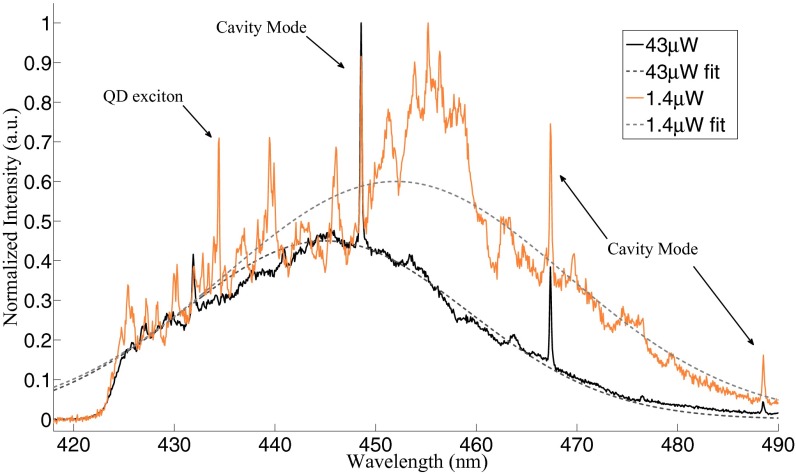
Low-temperature (4 K), low-power (1.4 μW) excitation measurements of fQW+QD microdisks suggest that the QDs predominantly emit light on the short-wavelength side of the gain spectrum. These data are shown in Fig. 2 as well as data taken at a higher pump power (43 μW). Of all of the active layer material considered here, only the fQW+QD A and B samples exhibited sharp peaks, identified as InGaN QD excitons in previous work (18–20), which were consistently located on the short-wavelength side of the emission spectrum and visible up to 40 K. The short-wavelength QD emission is believed to be a consequence of the MDE technique, as has been previously explained (21). The excitons were observable only at the lowest incident pump powers, while the modes were clearly seen at both high and low pump powers. The dominant modes do not appreciably change as the pump power is raised from 1.4 μW to 43 μW power, but the gain spectrum does appear to shift by ∼10 nm to shorter wavelengths, as can be seen in the Gaussian fits to the data.
Fig. 2.
Normalized PL spectra from a fQW+QD (A) microdisk obtained at 4 K. The exciton peaks are only visible at low pump powers (up to ∼10 μW), whereas the cavity modes are visible at all pump powers. Gaussian fits (dashed lines) show that the emission spectrum shifts to shorter wavelengths with increasing pump power.
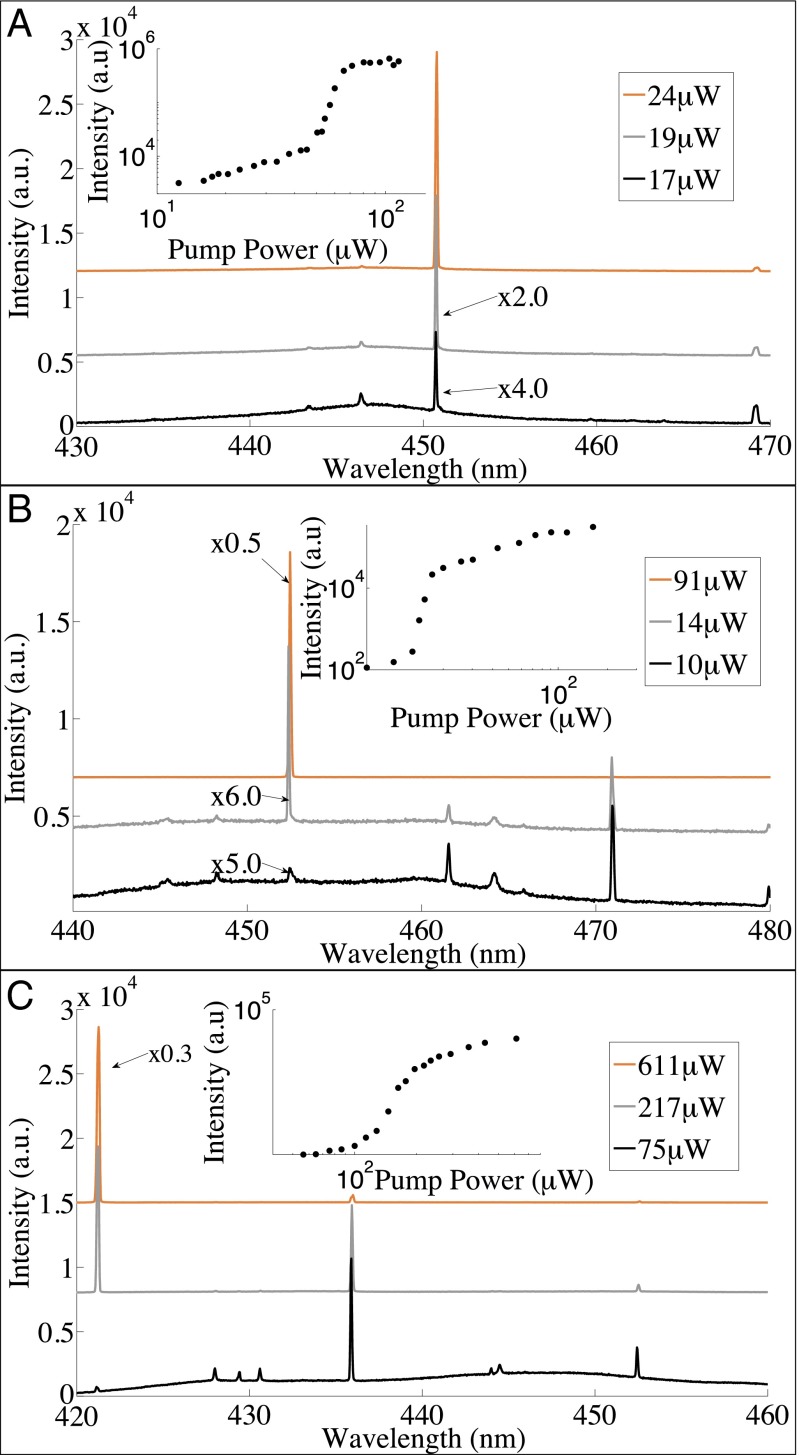
Light-in light-out (L-L) lasing curves were obtained at room temperature from 20 microdisks on each of the four wafers, which allowed for the identification of the laser threshold as well as lasing wavelength. Representative room temperature microdisk lasing spectra are shown in Fig. 3 A−C for QW, fQW, and QD+fQW devices, respectively, with full L-L curves displayed in the insets. The log−log plot clearly indicates the evolution from spontaneous emission to lasing.
Fig. 3.
Lasing spectra from devices with varying gain media. Typical room temperature lasing spectra of QW (A), fQW (B), and QD+fQW (C) sample. (Insets) Full log−log lasing curves showing the three laser regimes of spontaneous emission, amplified spontaneous emission, and lasing.
Particularly notable in the data of Fig. 3 is the transformation of the PL spectra for the three samples under progressively higher pump powers. Although there were across-sample variations in the widths and peak positions of the luminescence, in general at low input powers, all spectra display a broad luminescence peak, characteristic of the inhomogeneous widths of the QW and fQWs. Against these broad backgrounds are the distinctive, narrow peaks that modulate the broad PL spectra. These correspond to the modes of the microdisks, indicative of the coupling of the emitters to the surrounding cavity. The most prominent modes help to spotlight the optical transitions that are best coupled to the cavity at a given incident pump power, whether because of advantages in radiative emission rate, spatial overlap with a mode, or resonance in frequency.
For the QW, the most prominent mode appears near the peak of the PL distribution; this mode continues its prominence under higher pump powers, and ultimately defines the lasing wavelength. For the fQW sample, the dominant modes under low pump power are those at the long-wavelength tail of the distribution (∼471 nm). At a higher pump power, the dominant mode is blue-shifted (∼452 nm), closer to the center of the broad PL peak. Similar to the QW samples, lasing takes place at a wavelength close to the center of the broad gain spectrum. The PL spectra of the QD+fQW samples initially have similarities to the fQW (alone) samples: At the lowest pump power shown (75 μW), the spectrum in Fig. 4C displays a prominent mode at the approximate center of the gain distribution (∼436 nm), with a small red-shifted mode at ∼452 nm. The distinctive change for the QD+fQW samples, at the higher pump powers, is the dramatic dominance of a peak at the very short wavelength limit of the emission spectrum. At 217 μW pump power, the prominent mode has blue-shifted to ∼421 nm, and this microdisk sample ultimately exhibits lasing at that wavelength.
Fig. 4.
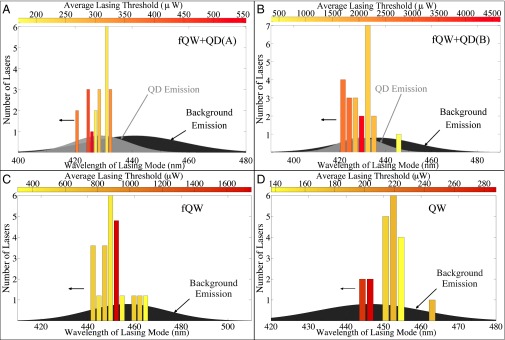
Histogram of the wavelength of lasing mode for each laser measured from each of the four samples: (A) fQW+QD (A), (B) fQW+QD(B), (C) fQW, and (D) QW. The average lasing threshold of the devices in each histogram bar is denoted by the color map, with yellow and red corresponding to low and high thresholds, respectively. The normalized background emission spectrum is denoted in black and the QD emission spectrum is denoted in gray for fQW+QD (A) and fQW+QD (B).
While the very broad gain spectrum reflects the optical emission of the entire range of fQWs and QDs that comprise the active layer, the dominant modes highlight the relative strengths of contribution of fQW and QDs as the incident pump power is changed. For the fQW+QD A and B samples, lasing ultimately occurs at wavelengths characteristic of the QDs, at wavelengths much shorter than the center of the room temperature gain spectrum. This distinctive behavior of these samples is observed over a significant sampling of microdisks, as shown in Fig. 4. A histogram of the wavelength of the lasing mode for each measured device is overlaid with the average background emission of the four samples. For fQW+QD A and B, the distribution of QD emission is also denoted. This distribution was determined by taking the average wavelength and SD of QD exciton peaks, measured at low temperature. Finally, color bars represent the average lasing threshold of the microdisks within one histogram bin. While the lasing wavelengths for the QW and fQW devices are fairly equally distributed about the center-emission wavelengths for these materials, the lasing wavelengths of the fQW+QD materials are substantially blue-shifted (∼13 nm for sample A) from the broadband gain emission and instead are centered on the QD emission spectrum.
For clarity, for each active layer composition, the averaged data for the center of the gain spectrum, the lasing wavelength, and the lasing threshold are also tabulated in Table 1.
Table 1.
Lasing statistics summary
| Sample | Average wavelength of background emission, nm | Average wavelength of lasing mode, nm | Average lasing threshold, μW | Threshold range, μW |
| QW | 446 ± 2.3 | 448 ± 6.7 | 184 | 88–375 |
| fQW | 457 ± 3.5 | 451 ± 6.7 | 753 | 83–3600 |
| fQW+QD A | 441 ± 4.8 | 428 ± 3.8 | 303 | 118–815 |
| fQW+QD B | 437 ± 4.4 | 429 ± 6.3 | 2029 | 350–6175 |
Center of background emission spectrum, average wavelength of lasing mode, and lasing threshold determined by averaging over the 20 microdisk lasers measured for each of the four active layer materials.
Discussion
The information on lasing thresholds and wavelengths for the various active areas, as well as the evolution of the spectra at differing pump powers, provides significant insights into the important constraints on lasing in these microdisk devices. The evolution of the dominant mode from longer to shorter wavelengths as the pump power is increased reflects the interplay between and relative importance of the carrier capture cross-section versus the efficiency and rate of radiative emission of those fQW regions of varying size. The larger-area fQW regions are more effective at carrier capture, with subsequent emission at the longer wavelengths characteristic of their energy levels. Efficient carrier capture may be the dominant advantage at the lowest pump powers. However, because of better spatial localization of the excitons, the radiative efficiency and, ultimately, the radiative rate will be higher for the smaller-area fQWs (22). As the pump power increases, carrier capture may be less influential than the higher radiative efficiency emission rate of the smaller-area fQWs and the emission spectrum shifts to the shorter wavelengths characteristic of the energy levels of those fQW regions. The behavior continues for the fQW+QD sample. At higher pump powers, the QD emission into the mode at ∼421 nm becomes observable, and ultimately lasing at that wavelength is observed. We note the relatively short wavelength exciton emission of the QDs in Fig. 3, as well as the blue shift of the gain spectrum as the pump power changed from 1.4 μW to 43 μW. Thus, QD lasing at 421 nm is consistent with the low-temperature PL spectrum of excitonic transitions from the QDs. In addition, previous work suggests that the threshold carrier density for QDs is lower than that of QWs (23, 24). Thus, at sufficiently high pump powers, the stronger spatial localization and higher radiative emission efficiency mediate the much lower relative carrier capture efficiency, and result in lasing at the short wavelengths characteristic of the QDs. Such a mechanism may also explain why fQW+QD (B) lases closer to the center of the background gain spectrum: Its QD density is ∼10× less than that of fQW+QD (A), and thus certain devices may not have the critical number of QDs to facilitate lasing. In this case, the device behaves similarly to a fQW device.
In conclusion, we have fabricated microdisk cavities containing QW, fQW, and fQW+QD layers as the gain medium. The modal signatures of the respective spectra show interplay between the large carrier capture cross section of larger-area fQWs at the lowest pump powers, yielding precedence to the higher carrier localization of smaller-area fQWs and QDs, at the higher pump powers. In fQW+QD devices, we observe lasing at wavelengths centered on the QD gain spectrum, which is blue-shifted from the peak of the broadband emission. We believe that this distinctive emission wavelength is a signature of QD lasing in these samples. These observations offer a way to distinguish lasing from QDs from that of the MDE-associated fQWs and provide insights into the optimal nitride gain medium to achieve lower laser thresholds and improved device performance.
Materials and Methods
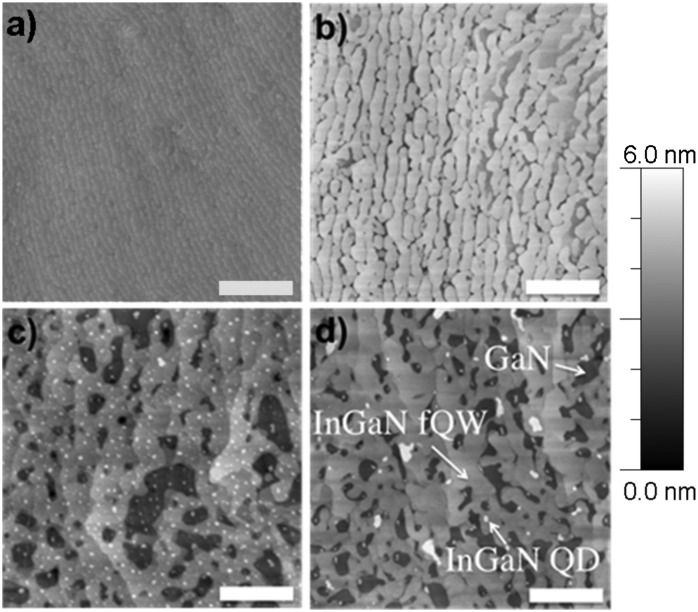
Fig. 5 shows AFM images of one uncapped active layer for each of the four samples. It is apparent that some portions of the QD+fQW samples contain fragmented QW material or QDs alone, while other portions of the material may comprise a QD overlying fQW material. Regions of the InGaN fQW, QD, and bare GaN are denoted in Fig. 5D.
Fig. 5.
AFM images of uncapped active layers: (A) QW sample showing atomic terraces of the top surface of the InGaN QW, (B) fQW, (C) QD+fQW (A) and (D) QD+fQW (B). Scale bar, 500 nm in width, with a vertical scale of 6 nm. The white dots in C and D are indium droplets which form InGaN QDs during growth of the GaN capping layer. The dark patches in B, C, and D are bare GaN.
AFM scans of the InGaN layers were performed on uncapped versions of the samples. The QW sample (Fig. 5A) shows a smooth top surface of the InGaN QW (RMS roughness of 0.16 nm), whereas the other sample scans (Fig. 5 B−D) show areas of both underlying GaN and the fQW surfaces. The depth of the fQW has been measured as 2.5 nm for all fQW samples.
The details of the growth methods for the active regions are as follows.
InGaN QWs.
To minimize the indium loss from the QW during barrier growth, GaN barriers were grown at the same temperature as the InGaN QWs. The nominal thickness for the QWs is 2.5 nm. This method results in continuous QWs with no visible well width fluctuation measured using transmission electron microscopy (25).
InGaN fQWs.
The 2.5-nm-thick InGaN epilayers were grown and annealed at the growth temperature for 240 s in an NH3/N2 atmosphere before the growth of a GaN capping layer. The use of NH3/N2 gas mixture was to ensure that no metallic droplets are formed during the annealing process. The annealed epilayer exhibits a network of interlinking InGaN strips aligned along the [11−20] direction as shown in Fig. 1A (26).
InxGa1-xN QDs + InxGa1-xN fQWs.
MDE was used for the growth of InGaN QDs in our samples. The full MDE technique is discussed elsewhere (27); however, a brief description follows: A postgrowth N2 anneal is performed on a 2.5-nm InGaN QW layer, causing the layer to be broken into regions of “pits” and regions of “fragmented QW,” with metallic indium/gallium droplets being created across both of these regions. During the growth of the GaN capping layer, these droplets rereact with ammonia, forming InGaN QDs.
Acknowledgments
This work was supported in part by the Engineering and Physical Sciences Research Council (Award EP/H047816/1) and by the National Science Foundation (NSF) Materials World Network (Award 1008480). This work was enabled by facilities available at the Center for Nanoscale Systems, a member of the National Nanotechnology Infrastructure Network, which is supported by the NSF under NSF Award ECS-0335765. I.A. is the recipient of an Australian Research Council Discovery Early Career Research Award (Project DE130100592).
Footnotes
The authors declare no conflict of interest.
References
- 1.Zhang M, Banerjee A, Lee CS, Hinckley JM, Bhattacharya P. A InGaN/GaN quantum dot green (λ = 524 nm) laser. Appl Phys Lett. 2011;98(22):221104. [Google Scholar]
- 2.Johnson JC, et al. Single gallium nitride nanowire lasers. Nat Mater. 2002;1(2):106–110. doi: 10.1038/nmat728. [DOI] [PubMed] [Google Scholar]
- 3.Chen CY, et al. Gallium nitride nanowire based nanogenerators and light-emitting diodes. ACS Nano. 2012;6(6):5687–5692. doi: 10.1021/nn301814w. [DOI] [PubMed] [Google Scholar]
- 4.Banerjee A, Frost T, Stark E, Bhattacharya P. Continuous-wave operation and differential gain of InGaN/GaN quantum dot ridge waveguide lasers (λ = 420 nm) on c-plane GaN substrate. Appl Phys Lett. 2012;101(4):041108. [Google Scholar]
- 5.Néel D, et al. Aluminum nitride photonic crystals and microdiscs for ultra-violet nanophotonics. Adv Nat Sci Nanosci Nanotechnol. 2014;5(2):023001. [Google Scholar]
- 6.Someya T, et al. Room temperature lasing at blue wavelengths in gallium nitride microcavities. Science. 1999;285(5435):1905–1906. doi: 10.1126/science.285.5435.1905. [DOI] [PubMed] [Google Scholar]
- 7.Holmes MJ, Choi K, Kako S, Arita M, Arakawa Y. Room-temperature triggered single photon emission from a III-nitride site-controlled nanowire quantum dot. Nano Lett. 2014;14(2):982–986. doi: 10.1021/nl404400d. [DOI] [PubMed] [Google Scholar]
- 8.Aharonovich I, et al. Low threshold, room-temperature microdisk lasers in the blue spectral range. Appl Phys Lett. 2013;103(2):021112. [Google Scholar]
- 9.Bürger M, et al. Lasing properties of non-polar GaN quantum dots in cubic aluminum nitride microdisk cavities. Appl Phys Lett. 2013;103(2):021107. [Google Scholar]
- 10.Michler P, et al. Laser emission from quantum dots in microdisk structures. Appl Phys Lett. 2000;77(2):184–186. [Google Scholar]
- 11.Srinivasan K, Borselli M, Painter O, Stintz A, Krishna S. Cavity Q, mode volume, and lasing threshold in small diameter AlGaAs microdisks with embedded quantum dots. Opt Express. 2006;14(3):1094–1105. doi: 10.1364/oe.14.001094. [DOI] [PubMed] [Google Scholar]
- 12.Nosich AI, Smotrova EI, Boriskina SV, Benson TM, Sewell P. Trends in microdisk laser research and linear optical modelling. Opt Quantum Electron. 2007;39(15):1253–1272. [Google Scholar]
- 13.Asada M, Miyamoto Y, Suematsu Y. Gain and threshold of three-dimensional quantum-box lasers. IEEE J Quantum Electron. 1986;22(9):1915–1921. [Google Scholar]
- 14.Ide T, et al. Room temperature continuous wave lasing in InAs quantum-dot microdisks with air cladding. Opt Express. 2005;13(5):1615–1620. doi: 10.1364/opex.13.001615. [DOI] [PubMed] [Google Scholar]
- 15.Krestnikov IL, et al. Quantum dot origin of luminescence in InGaN-GaN structures. Phys Rev B. 2002;66(15):155310. [Google Scholar]
- 16.Tamboli AC, et al. Room-temperature continuous-wave lasing in GaN/InGaN microdisks. Nat Photonics. 2006;1(1):61–64. [Google Scholar]
- 17.Mexis M, et al. High quality factor nitride-based optical cavities: Microdisks with embedded GaN/Al(Ga)N quantum dots. Opt Lett. 2011;36(12):2203–2205. doi: 10.1364/OL.36.002203. [DOI] [PubMed] [Google Scholar]
- 18.Jarjour AF, et al. Control of the oscillator strength of the exciton in a single InGaN-GaN quantum dot. Phys Rev Lett. 2007;99(19):197403. doi: 10.1103/PhysRevLett.99.197403. [DOI] [PubMed] [Google Scholar]
- 19.Oliver RA, et al. Growth and assessment of InGaN quantum dots in a microcavity: A blue single photon source. Mater Sci Eng B. 2008;147(2):108–113. [Google Scholar]
- 20.Narukawa Y, et al. Role of self-formed InGaN quantum dots for exciton localization in the purple laser diode emitting at 420 nm. Appl Phys Lett. 1997;70(8):981–983. [Google Scholar]
- 21.Jarjour AF, Oliver RA, Taylor RA. Nitride-based quantum dots for single photon source applications. Phys Status Solidi A. 2009;206(11):2510–2523. [Google Scholar]
- 22.Christen J, Bimberg D, Steckenborn A, Weimann G. Localization induced electron-hole transition rate enhancement in GaAs quantum wells. Appl Phys Lett. 1984;44(1):84–86. [Google Scholar]
- 23.Grandjean N, Ilegems M. Visible InGaN/GaN quantum-dot materials and devices. Proc IEEE. 2007;95(9):1853–1865. [Google Scholar]
- 24.Asada M, Miyamoto Y, Suematsu Y. Gain and the threshold of three-dimensional quantum-box lasers. IEEE J Quantum Electron. 1986;22(9):1915–1921. [Google Scholar]
- 25.Oliver RA, et al. The impact of gross well width fluctuations on the efficiency of GaN-based light emitting diodes. Appl Phys Lett. 2013;103(14):141114. [Google Scholar]
- 26.van der Laak NK, Oliver RA, Kappers MJ, Humphreys CJ. Role of gross well-width fluctuations in bright, green-emitting single InGaN/GaN quantum well structures. Appl Phys Lett. 2007;90(12):121911. [Google Scholar]
- 27.Oliver RA, et al. InGaN quantum dots grown by metalorganic vapor phase epitaxy employing a post-growth nitrogen anneal. Appl Phys Lett. 2003;83(4):755–757. [Google Scholar]


