

Significance
This paper reports that the transcription factor forkhead box protein A3 (Foxa3) is directly involved in the development of age-associated obesity and insulin resistance. Mice that lack the Foxa3 gene remodel their fat tissues, store less fat, and burn more energy as they age. These mice also live significantly longer. We show that Foxa3 suppresses a key metabolic cofactor, PGC1α, which is involved in the gene programs that turn on energy expenditure in adipose tissues. Overall, these findings suggest that Foxa3 contributes to the increased adiposity observed during aging, and that it can be a possible target for the treatment of metabolic disorders.
Keywords: obesity, diabetes
Abstract
Aging is associated with increased adiposity and diminished thermogenesis, but the critical transcription factors influencing these metabolic changes late in life are poorly understood. We recently demonstrated that the winged helix factor forkhead box protein A3 (Foxa3) regulates the expansion of visceral adipose tissue in high-fat diet regimens; however, whether Foxa3 also contributes to the increase in adiposity and the decrease in brown fat activity observed during the normal aging process is currently unknown. Here we report that during aging, levels of Foxa3 are significantly and selectively up-regulated in brown and inguinal white fat depots, and that midage Foxa3-null mice have increased white fat browning and thermogenic capacity, decreased adipose tissue expansion, improved insulin sensitivity, and increased longevity. Foxa3 gain-of-function and loss-of-function studies in inguinal adipose depots demonstrated a cell-autonomous function for Foxa3 in white fat tissue browning. Furthermore, our analysis revealed that the mechanisms of Foxa3 modulation of brown fat gene programs involve the suppression of peroxisome proliferator activated receptor γ coactivtor 1 α (PGC1α) levels through interference with cAMP responsive element binding protein 1-mediated transcriptional regulation of the PGC1α promoter. Overall, our data demonstrate a role for Foxa3 in energy expenditure and in age-associated metabolic disorders.
Three types of fat cells—white, brown, and beige—have been described based on their function and location (1–3). WATs across anatomical areas are involved primarily in energy storage through the accumulation of triglycerides. Despite morphological similarities, these white fat depots have unique gene expression signatures and distinct susceptibility to inflammation, and differentially contribute to the development of the metabolic syndrome. Conversely, brown adipose tissue (BAT), present in the interscapular area in rodents, is devoted principally to the conversion of energy to generate heat through uncoupling protein 1 (UCP1), a mitochondrial protein involved in uncoupling oxidative phosphorylation from ATP synthesis. Beige cells, interspersed in white fat tissue, have been shown to express gene programs in common with both white and brown fat and to be highly inducible to activating thermogenic responses (4). Recently, both brown and beige fat cells have been detected in adult humans in supraclavicular areas (4–6) and shown to efficiently contribute to energy expenditure (7, 8).
The expansion and activity of fat depots change throughout adult life. In both rodents and humans, the increase in fat mass leading to obesity observed during aging is inversely correlated with brown fat activity (9) and is accompanied by the loss of beige adipocytes in mice (10). It has been postulated that increasing energy expenditure through the inefficient utilization of lipids via UCP1-mediated uncoupling of oxidative phosphorylation from ATP production may be advantageous in aging and in increasing lifespan (11). Consequently, emphasis has been placed on identifying novel pathways for enhancing UCP1 as a means of preventing or alleviating obesity and related metabolic disorders. The molecular players contributing to the age-associated increase in adipose tissue and diminished thermogenesis remain to be fully elucidated, however.
Peroxisome proliferator-activated receptor γ coactivator α (PGC1α), a master regulator of mitochondrial and peroxisomal biogenesis (12), is a transcriptional coregulator of UCP1 gene expression involved in the control of adaptive thermogenesis (13–15). Activation of PGC1α can have beneficial effects in aging in pathological conditions affecting such tissues as heart, brain, and skeletal muscle (16, 17). Although to date, numerous factors have been reported to positively regulate PGC1α activity at both the expression and posttranslational levels (16), little is known about transcriptional regulators that may exert a negative control on PGC1α mRNAs.
The forkhead box (FOX) proteins are members of a family of transcriptional regulators that bind DNA through a conserved winged-helix binding motif. These proteins have been previously shown to be involved in metabolism and aging, as well as organ development and differentiation (18). Among these FOX factors, the members of the forkhead box protein A (Foxa) subfamily play important roles in early development, organogenesis, and metabolism (19, 20). Whereas Foxa1- and Foxa2-deficient mice manifest either perinatal or embryonic lethality (21, 22), Foxa3-null mice are viable, with no obvious abnormalities (23). We recently demonstrated that Foxa3 is an early regulator of adipocyte differentiation, and that Foxa3-null mice are selectively protected from visceral adipose depot expansion when fed a high-fat diet (HFD) (24). Given the role of Foxa3 in depot-selective regulation of adiposity, we hypothesized that Foxa3 also may influence the development of age-associated metabolic dysfunction. Here we demonstrate that during aging, Foxa3 mRNA levels selectively increase in BAT and inguinal fat tissue and that Foxa3-null mice have decreased adiposity, increased thermogenic capacity and energy expenditure, and improved metabolic profiles. In addition, we show that Foxa3 is sufficient to suppress PGC1α levels through interference with cAMP responsive element binding protein 1 (CREB)-mediated induction of PGC1α. Collectively, our results suggest that Foxa3 may be relevant in diminishing the thermogenic capacity of fat tissues during the aging process.
Results
Ablation of Foxa3 Protects Against the Development of Obesity and Insulin Resistance During Aging and Increases Longevity.
Foxa3-null mice fed a normal chow diet do not have any abnormalities in fat tissues, but when exposed to an HFD, they display a selective decrease in visceral adiposity (24, 25). To assess whether loss of Foxa3 can alter fat depot expansion during the normal process of aging, we monitored chow-fed WT and Foxa3-null mice over the course of 14 mo. Body weights of the WT and Foxa3-null mice were similar up to 5 mo of age but began to diverge beginning at 6 mo. This weight difference was maintained as the mice aged (Fig. 1A). In addition to a 40% decrease in fat mass (Fig. 1B), the 14-mo-old Foxa3-null mice displayed reduced leptin and cholesterol levels; however, no differences in any of these parameters were detected in 2-mo-old Foxa3-null and WT mice (Fig. 1C). The 14-mo-old Foxa3-null mice showed improved insulin sensitivity, whereas no differences in glucose and insulin tolerance were observed between 2-mo-old WT and Foxa3-null mice (Fig. 1D). Hyperinsulinemic-euglycemic clamp studies confirmed improved whole-body and hepatic insulin sensitivity in the 14 mo-old Foxa3-null mice, as demonstrated by an increased glucose infusion rate and decreased endogenous glucose production during the clamps (Table S1).
Fig. 1.

Foxa3-null mice are leaner and have improved insulin sensitivity at 14 mo of age and have increased lifespan compared with WT mice. (A) Body weights of WT and Foxa3-null (Foxa3 KO) mice fed a normal chow diet (n = 12 per group). (B) Body fat and lean mass of WT and Foxa3-null mice analyzed by NMR. (C) Serum profiles of WT and Foxa3-null mice at 14 mo of age. (D) Glucose tolerance and insulin tolerance test results in 2-mo-old (2m) and 14-mo-old (14m) WT and Foxa3-null mice (n = 6 per group). (E) Survival curves of WT and Foxa3-null mice. n = 32 for WT; n = 34 for Foxa3-null mice. Data are presented as mean ± SEM. *P < 0.05, **P < 0.01 compared with controls.
Quantification of tissue-specific glucose transport showed a significant increase in glucose uptake in white adipose tissue (WAT) of Foxa3-null mice compared with WT mice, while no statistically significant differences were observed in brown fat and skeletal muscle (Table S1). In addition, the 14-mo-old Foxa3-null mice exhibited decreased intrahepatic lipid deposition, as shown by histological analysis of liver sections and liver triglyceride measurements (Fig. S1 A–C). Overall, these data suggest that midage mice with genetic ablation of Foxa3 fed a normal chow diet have a better metabolic profile than WT mice.
Given the improved metabolic parameters observed in the 14-mo-old Foxa3-null mice, we next asked whether ablation of Foxa3 could affect lifespan as well. The log-rank test indicated a significant extension of the lifespan of Foxa3-null mice (Fig. 1E), with a 66% reduced risk of death in mice with Foxa3 ablation (hazard ratio, 0.34) when the mice reached 934 d of age.
Improved Brown Fat and Enhanced Browning of White Fat in Foxa3-Null Mice.
To further evaluate the effects of Foxa3 on adiposity during aging, we measured the fat depots in 2- and 14-mo-old WT and Foxa3-null mice. As reported previously (24, 25), we did not detect any differences in the amount of fat between the 2-mo-old WT and Foxa3-null mice (Fig. S2A); conversely, the 14-mo-old Foxa3-null mice showed decreased fat depots compared with WT mice (Fig. 2A). Histological analysis revealed smaller adipocytes in BAT, inguinal WAT (iWAT), and epididymal WAT (eWAT) of Foxa3-null mice (Fig. 2B). Comparison of gene expression profiles in brown fat of 14-mo-old WT and Foxa3-null mice showed increased mRNA levels of PGC1α, UCP1, and mitochondrial genes involved in thermogenic programs (Fig. 2C) in Foxa3-null mice, but no differences between 2-mo-old mice of the two genotypes (Fig. S2B).
Fig. 2.

The 14-mo-old Foxa3-null mice show increased expression of thermogenic and mitochondrial genes in BAT and browning of inguinal fat. (A) Adipose tissue weights of 14-mo-old (14m) WT and Foxa3-null mice. (B) H&E staining of BAT, iWAT, and eWAT of 14-mo-old WT and Foxa3-null mice. (C) Levels of thermogenic and mitochondrial genes in BAT. (D) UCP1 staining in inguinal fat of WT and Foxa3-null mice. (E and F) Levels of thermogenic and mitochondrial genes (E) and of beige fat markers (F) in inguinal fat depots of 14-mo-old (14m) WT and Foxa3-null mice. Data are presented as mean ± SEM. *P < 0.05, **P < 0.01 compared with controls.
It has been shown that in addition to brown fat, brite/beige cells present in iWAT depots also may contribute to thermogenesis (4, 26). Thus, we assessed whether ablation of Foxa3 would affect these cells and alter browning in s.c. fat tissues. Immunohistochemical analysis of inguinal fat from 14-mo-old Foxa3-null mice revealed the presence of areas containing multilocular cells positive for UCP1 staining (Fig. 2D), and molecular analysis showed elevation of brown (Fig. 2E) and beige cell markers (Fig. 2F) in iWAT obtained from Foxa3-null mice. These differences were not detected between 2-mo-old WT and Foxa3-null mice (Fig. S2C). Furthermore, we found increased PGC1α and UCP1 protein levels in BAT and iWAT of the 14-mo-old Foxa3-null mice compared with age-matched WT mice (Fig. S2D). Overall, these data suggest that mitochondrial and thermogenic programs are elevated in BAT and iWAT of 14-mo-old Foxa3-null mice.
Fourteen-Month-Old Foxa3-Null Mice Have Enhanced Energy Expenditure and Increased Thermogenic Function.
We next investigated whether the ablation of Foxa3 would affect energy expenditure. The 14-mo-old Foxa3-null mice showed increased levels of oxygen consumption compared with WT mice (Fig. 3A and Fig. S3A), despite no differences in food intake or locomotor activity (Fig. S3B). These effects appeared to be cell-autonomous, as demonstrated by the increased oxygen consumption in primary BAT and iWAT adipocytes obtained from the 14-mo-old Foxa3-null mice compared with WT mice (Fig. 3B), whereas no differences in oxygen consumption were detected in primary adipocytes of 2-mo-old WT and Foxa3-null mice (Fig. S3C).
Fig. 3.

Enhanced energy expenditure and thermogenic function in aging Foxa3-null mice. (A) Oxygen consumption at room temperature (24 °C) of 14-mo-old (14m) WT and Foxa3-null (Foxa3 KO) mice. (B) Oxygen consumption in differentiated BAT and iWAT SVF cells from 14-mo-old WT and Foxa3-null mice under basal (Basal) or uncoupled conditions, using oligomycin (1 µM) (Uncoupled), or maximal oxidative capacity with FCCP (1 µM) (Max). (C) Body temperatures of 14-mo-old WT and Foxa3-null mice exposed to cold (4 °C) (n = 6). (D) Representative infrared images of 14-mo-old WT and Foxa3-null mice before and after cold exposure. Data are presented as mean ± SEM. *P < 0.05, **P < 0.01 compared with controls.
Given the finding of increased expression of thermogenic genes in BAT and iWAT tissues (Fig. 2 C and E) and isolated primary cells (Fig. S3D) of Foxa3-null mice, we next investigated whether Foxa3-null mice would exhibit resistance to cold exposure. Compared with WT mice, the 14-mo-old Foxa3-null mice already had higher basal body temperatures before the cold challenge and demonstrated enhanced thermogenic capacity after exposure to 4 °C (Fig. 3C). These data were confirmed using infrared imaging, which showed higher body temperature in the interscapular area of Foxa3-null mice both before and after cold exposure (Fig. 3D). These results demonstrate that aging Foxa3-null mice have enhanced energy expenditure and thermogenic activity.
Modulation of Foxa3 Levels in Inguinal Fat Affects Brown and Beige Gene Programs and Regulates Browning.
To establish a direct role for Foxa3 in the observed browning of fat tissue, we used an in vivo gene delivery approach and modulated Foxa3 levels selectively in inguinal fat tissues by adenoviral injections of vectors containing control, Foxa3, or shFoxa3. Analysis of tissues of adenorovirally injected mice showed increased levels of Foxa3 selectively in inguinal fat tissue of the mice injected with Foxa3 adenovirus (Fig. S4 A and B) and revealed larger adipocytes by H&E staining and reduced UCP1 levels by immunohistochemistry (Fig. 4A) compared with tissues injected with control adenovirus. These morphological changes observed in Foxa3 adenovirally injected tissues were associated with reductions in brown and thermogenic gene programs (Fig. 4B) and increased white fat gene markers (Fig. S4C). Conversely, tissues of mice injected with shFoxa3 adenovirus showed selective decreases in Foxa3 levels in the inguinal fat tissue (Fig. S4 D and E), along with smaller adipocytes, increased UCP1 staining (Fig. 4C), increased expression levels of genes involved in thermogenic processes (Fig. 4D), and decreased WAT gene programs (Fig. S4F), compared with control injected inguinal tissues. These data suggest that the browning effects observed in mice with global ablation of Foxa3 can be recapitulated through the selective down-regulation of Foxa3 in inguinal fat tissues, suggesting a cell-autonomous function of Foxa3 in browning.
Fig. 4.

Inguinal depot-selective modulation of Foxa3 levels via adenoviral delivery affects thermogenic gene programs and browning. (A) H&E and UCP1 staining of inguinal fat tissues of 2-mo-old mice injected bilaterally with adenoviruses expressing control (Ad-Ctrl) or Foxa3 (Ad-Foxa3). (B) mRNA levels of thermogenic and brown fat genes in iWAT expressing control (Ad-Ctrl) or Foxa3 adenovirus (Ad-Foxa3). (C) H&E and UCP1 staining of inguinal fat tissues of 8-mo-old mice injected bilaterally with control (Ad-U6) or shFoxa3 (Ad-shFoxa3) adenoviruses. (D) mRNA levels of thermogenic and brown fat genes in iWAT expressing control (Ad-U6) or adenoviral shFoxa3 (Ad-shFoxa3). n = 6 per group. Data are presented as mean ± SEM. *P < 0.05, **P < 0.01 compared with controls.
Foxa3 mRNA Is Up-Regulated in BAT and iWAT During Aging.
During aging, BAT partly assumes the characteristics of white fat, exhibiting increased lipid deposits and reduced thermogenic function (27). Given our results showing that ablation of Foxa3 in aged mice affects inguinal and brown fat tissues, we assessed whether Foxa3 mRNA levels are specifically regulated in these depots during the process of aging. A comparison of Foxa3 mRNA levels in adipose tissues of 2- and 14-mo-old WT mice revealed higher Foxa3 mRNAs in BAT and iWAT of 14-mo-old mice, with only modestly elevated Foxa3 levels in epididymal fat tissues (Fig. 5A). No differences in Foxa3 expression levels were observed in liver or muscle of 2- and 14-mo-old WT and Foxa3-null mice. Conversely, BAT and iWAT of 14-mo-old mice showed decreases in PGC1α and in its downstream target genes (Fig. 5 B and C).
Fig. 5.
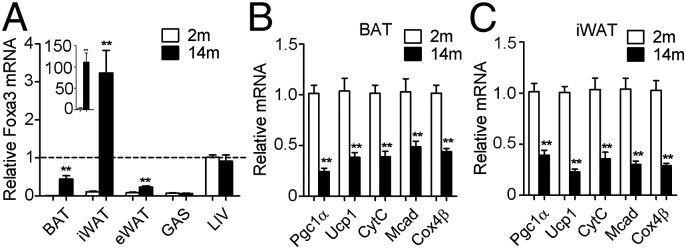
Foxa3 levels are increased in BAT and iWAT of aging mice, and levels of PGC1α and its targets are decreased. (A) Relative Foxa3 expression levels in BAT, iWAT, eWAT, gastrocnemius muscle (GAS), and liver (LIV) in 2-mo-old (2m) and 14-mo-old (14m) mice. The levels of Foxa3 expression in livers of 2-mo-old mice served as a reference. (B and C) mRNA levels of Pgc1α, Ucp1, and mitochondrial genes in BAT (B) and iWAT (C) of 2-mo-old and 14-mo-old mice. n = 6 per group. Data are presented as mean ± SEM. *P < 0.05, **P < 0.01 compared with controls.
Foxa3 Regulates PGC1α Levels Through Interference with CREB Binding at the PGC1α Promoter.
The inverse correlation between Foxa3 and PGC1α levels in BAT and iWAT of the 14-mo-old mice, along with the previously characterized role of Foxa family members as positive and negative regulators of gene expression (28, 29), led us to postulate a potential repressive function of Foxa3 on PGC1α. An in silico screen of Foxa-binding motifs in the upstream regulatory region of the PGC1α gene identified a putative Foxa-responsive element at nucleotides −133 to −128 from the PGC1α start site (Fig. 6A). This site is in close proximity to a well-characterized cAMP response element (CRE), present at nucleotides −144 to −137.
Fig. 6.

Foxa3 interferes with CREB-mediated induction of PGC1α expression. (A) Foxa-responsive element adjacent to a CRE-binding site in the PGC1α promoter. (B) Luciferase activity of a WT-PGC1α promoter reporter (PGC1α luc) or of a mutant-PGC1α reporter (PGC1α-mt luc) containing a deletion in the Foxa3-responsive element in cells transiently expressing either vector (Ctrl) or Foxa3, or with knockdown of Foxa3 (siFoxa3), in the presence of vehicle or cAMP. (C) Analysis of PGC1α mRNA levels in differentiated primary cells obtained from BAT and iWAT of 14-mo-old WT (WT, 14m) and Foxa3-null (KO, 14m) mice treated with vehicle or cAMP. (D) Analysis of Foxa3 and CREB occupancy at the PGC1α promoter in brown fat tissues obtained from 2-mo-old (2m) and 14-mo-old (14m) mice by ChIP assay. (E and F) ChIP analysis of CREB (E) and Foxa3 (F) binding at the PGC1α promoter in the presence or absence of cAMP in 10T1/2 cells ectopically expressing either vector (Ctrl) or Foxa3. Data are presented as mean ± SEM. *P < 0.05, **P < 0.01 compared with controls. ##P < 0.01 compared with WT+cAMP.
Given the established role of CREB in regulating the expression of PGC1α (30, 31), we next assessed whether Foxa3 can decrease PGC1α levels by physically interfering with CREB binding at its responsive element. Analysis of a luciferase reporter driven by the PGC1α promoter in 10T1/2 cells ectopically expressing Foxa3 (Fig. S5A) showed decreased levels of cAMP-mediated induction of luciferase activity, whereas knockdown of Foxa3 (Fig. S5B) enhanced this activity (Fig. 6B). These effects of Foxa3 on luciferase activity were lost when a mutant PGC1α-luciferase reporter containing a deletion of the Foxa3 putative binding site was analyzed in the presence of Foxa3 or when Foxa3 was down-regulated by siRNA (Fig. 6B). These results indicate that binding of Foxa3 to the PGC1α promoter is required for the suppression of PGC1α expression.
Analysis of primary cells obtained from BAT and iWAT of 2- and 14-mo-old WT and Foxa3-null mice confirmed that the absence of Foxa3 is associated with increased mRNA levels of PGC1α in response to cAMP treatment selectively in cells obtained from aged Foxa3-null mice (Fig. 6C and Fig. S5C). Similarly, ectopic expression of Foxa3 in 10T1/2 cells (Fig. S5D) further confirmed that Foxa3 reduces the induction of PGC1α mRNA in response to cAMP treatment (Fig. S5E), and, conversely, that Foxa3 knockdown (Fig. S5F) can increase PGC1α levels (Fig. S5G). Analysis of other well-known CREB-regulated gene programs previously shown to be involved in insulin resistance in white fat tissues of obese mice (32) revealed no changes in the levels of ATF3 and showed increased Glut4 mRNAs in isolated BAT and iWAT cells (Fig. S5H) and in BAT and iWAT tissues obtained from Foxa3-null mice (Fig. S5I).
To assess whether differential binding of Foxa3 and CREB occurred at their responsive elements during aging, we performed chromatin IP (ChIP) assays in BAT obtained from 2- and 14-mo-old mice. Our analysis revealed a significant increase in Foxa3 binding at the PGC1α promoter in BAT of 14-mo-old mice compared with 2-mo-old mice, along with significantly decreased CREB binding (Fig. 6D). The ChIP assays also demonstrated that ectopic Foxa3 expression was accompanied by a reduction in the binding of endogenous CREB to the CRE site (Fig. 6E), whereas no binding was observed on a control site of the PGC1α promoter (Fig. S5J). cAMP treatment disrupted Foxa3-binding selectively to the Foxa-responsive element at the PGC1α promoter (Fig. 6F), but did not affect an unrelated nearby site (Fig. S5K) or the binding to the Foxa-responsive element present at the PPARγ2 promoter (Fig. S5L), indicating reciprocal interference between Foxa3 and CREB. Overall, these results suggest that Foxa3 may exert its effects on browning during aging through selective suppression of PGC1α levels.
Discussion
The discovery that humans have brown and beige fat depots that may contribute to energy expenditure has prompted an effort to study how these tissues evolve during aging and to understand how they can be induced to potentially treat metabolic disorders. In this study, we show that Foxa3 is critical to the age-associated changes in fat depots. As mice age, Foxa3 expression increases in inguinal fat and BAT, and in the absence of Foxa3, middle-aged mice exhibit increased browning of white fat tissues and enhanced thermogenic activity, smaller adipose tissue mass, and increased insulin sensitivity. These metabolic effects appear to be mediated, at least in part, by a cell-autonomous function of Foxa3, given that in vivo modulation of Foxa3 in inguinal tissues regulates brown fat gene programs and tissue browning.
Foxa3 influences these gene expression programs through suppression of PGC1α levels via interference with CREB binding at the PGC1α promoter. It has been shown that constitutive CREB activity in fat tissues of HFD-induced obese mice leads to increased levels of ATF3, the negative regulator of the glucose transporter Glut4, thereby contributing to insulin resistance (32). Our data demonstrating that Foxa3 reduces CREB accessibility to the PGC1α promoter, combined with evidence indicating no increase in levels of the CREB target gene ATF3 in BAT and iWAT of Foxa3-null mice, suggest that Foxa3 interferes with CREB signaling in a promoter-selective manner.
In addition to the physical displacement of CREB at the PGC1α promoter proposed here, Foxa3 may affect PGC1α levels by recruiting corepressor complexes and by inducing repressive epigenetic changes through binding to this responsive element. This possibility is consistent with the pioneering role played by Foxa family members in chromatin remodeling (18–20). Further studies involving genome-wide mapping of Foxa3-binding sites in adipose tissues will determine whether Foxa3 can regulate other metabolically relevant genes involved in brown and beige fat physiology in addition to PGC1α.
In this report, we provide evidence indicating that ablation of Foxa3 is associated with decreased adipose depots in aging mice. Reduced fat mass has been associated with adipose tissue dysfunction early in life in mice with ablation of critical regulators of fat development and maintenance (33), as shown in fat-specific PPARγ conditional KO mice (34). Our data demonstrating that in the absence of Foxa3, aged mice are more metabolically fit and exhibit none of the pathological hallmarks of lipoatrophy, such as increased insulin resistance and liver steatosis present in PPARγ conditional KO mice, support the idea that Foxa3 may be specifically required for the expansion of adipose tissue that occurs during the aging process.
We previously reported that diets with high fat content elevate Foxa3 mRNA levels selectively in the visceral fat depot, and that mice with ablation of Foxa3 are protected from HFD-induced visceral adiposity (24). Here we show that Foxa3 levels selectively increase in BAT and inguinal fat depots during aging, but are only modestly elevated in visceral-epididymal fat. These findings suggest that Foxa3 expression may be regulated by the presence of depot-specific control mechanisms that are dependent on metabolic and nutrient conditions. Further studies will identify the differential modulators of Foxa3 levels in aging and during exposure to HFDs.
Our data suggest a critical role for Foxa3 in the negative regulation of energy expenditure and extension of the lifespan. To date, only a few members of the Forkhead family of transcription factors have been shown to affect brown fat function or longevity (35–37). It was previously shown that Foxc2 positively controls mitochondrial function and increases PGC1α levels (35), and that Foxo1 and Foxo3A affect lifespan in various multicellular organisms (36). Given that Forkhead factors share a highly conserved forkhead box DNA-binding motif but diverge in their remaining domains, it is conceivable that perhaps Foxc2, in addition to controlling mitochondrial gene programs via the transcriptional regulator TFAM as described previously (38), may regulate PGC1α expression directly through binding of the same forkhead-responsive elements identified here, and that PGC1α levels ultimately may depend on the competition for promoter binding between Foxa3 and Foxc2, exerting opposite effects. Functional assays and gene expression studies will reveal whether Foxc2 is differentially expressed during aging, and whether its function intersects on Foxa3’s target promoters.
Foxa3’s negative regulation of PGC1α is particularly interesting. Given that Foxa3 also can positively influence PPARγ gene expression (24), our data suggest a critical role for Foxa3 in the control of energy homeostasis. Foxa3 may act as a dual function regulator by controlling energy balance through the enhancement of gene programs devoted to the increase of lipid storage capacity and the suppression of those involved in energy expenditure, providing a powerful pleiotropic system to be targeted to control age-associated metabolic dysfunction. In conclusion, our study points to a critical role for Foxa3 as a metabolic regulator of energy conservation, revealing an essential molecular mechanism for regulating PGC1α levels to control thermogenesis during the aging process.
Materials and Methods
Plasmids and siRNAs.
The Foxa3-expressing plasmid has been described previously (24). A WT-PGC1α promoter linked to luciferase was obtained from Addgene, and a mutant PGC1α-luciferase reporter at the putative Foxa-binding site was generated using the following primers: forward, GGAGTGACGTCAGGACGACTGGCAGCAAGCTT GCAC; reverse, GTGCAAGCTTGCTGCCAGTCGTCCTGACGTCACTCC. SiRNAs targeting Foxa3 (Smartpool) and siRNA control were purchased from Dharmacon.
Mice.
WT and Foxa3-null mice (25) were maintained in a humidity- and temperature-controlled environment on a 12-h light/dark cycle, with free access to chow diet (NIH-31; Harlan Laboratories) and water. All animal experiments were performed in accordance with the guidelines of the National Institutes of Health and approved by the Institutional Animal Care and Use Committee of the National Institute of Diabetes and Digestive and Kidney Diseases.
Blood Measurements and Liver Trygliceride Determination.
Blood was collected from the retro-orbital venous plexus in the nonfasted state after anesthesia. Serum leptin levels were measured by ELISA (R&D Systems), and serum triglyceride and cholesterol levels were measured using colorimetric assays (Sigma-Aldrich and Thermo Scientific, respectively). Triglyceride levels in liver samples were measured with a Sigma-Aldrich TR0100 triglyceride determination kit and normalized to liver weight, as described previously (39).
Insulin Tolerance and Glucose Tolerance Tests and Hyperinsulinemic-Euglycemic Clamp Studies.
For insulin tolerance tests, mice received an i.p. injection of insulin (1 mU/kg). For glucose tolerance tests, mice were fasted overnight and then injected i.p. with glucose in saline solution (2 g/kg). Plasma glucose levels were measured in tail blood samples obtained before and at 15, 30, 60, 90, and 120 min after insulin or glucose injections, using the AlphaTrak Blood Glucose Monitoring System (Abbott). Hyperinsulinemic-euglycemic clamp studies were performed as described previously (40).
Body Composition, Food Intake, and Energy Expenditure Measurements.
Body composition was assessed by NMR (Echo Medical Systems). Oxygen consumption was measured by indirect calorimetry at 24 °C for 48 h after a 48-h adaptation period, as described previously (24), and normalized to lean mass (41). Food intake and total locomotor activity were measured for 48 h during indirect calorimetry measurements.
Cold Exposure Experiments.
Mice were individually caged and exposed to 4 °C for up to 3 h with free access to water. Core body temperatures were measured using a rectal thermometer (TH5; Braintree Scientific) before and at hourly intervals during cold exposure. Infrared images were obtained before and after 3 h of cold exposure using an infrared camera (FLIR Systems).
Adenoviral Expression Vectors and Infection.
Adenoviruses expressing GFP, mFoxa3-CMV-GFP, U6-shRNA-CMV-GFP, and U6-mFoxa3shRNA-CMV-GFP were constructed, amplified, and purified by Vector Biolabs. The sequence of the shRNA targeting the mouse Foxa3 gene was CCGGCCCTGAGTGAAATCTACCAATCTCGAGATTGGTAGATTTCACTCAGGGTTTTTG. For cells, 10T1/2 cells were incubated with 100 MOI of adenovirus. For in vivo injection, 5 × 10⁹ pfu of each adenovirus diluted in 50 μL of saline solution was injected bilaterally s.c. into the inguinal fat pads of 2-mo-old mice for the analysis of the effects of Foxa3 overexpression, or into the inguinal fat pads of 8-mo-old mice to assess the effects of Foxa3 knockdown. Mice were killed on the fourth day after viral delivery, and inguinal fat pads were dissected for further analysis.
RNA and Protein Analysis.
Total RNA was prepared using TRIzol reagent, with 1 μg of RNA retrotranscribed according to the manufacturer's instructions (Life Technologies). cDNA was analyzed using SYBR Green (Roche) with the primers listed in Table S2 in an ABI 7900 real-time PCR system (Life Technologies). Values were calculated by the ddCt method, with the housekeeping gene 36B4 used for normalization. Protein extracts were obtained from tissues or cells using RIPA buffer supplemented with complete protease inhibitor (Roche).
For Western blot analysis, proteins were separated by 10% Bis-Tris Gel (Life Technologies), transferred onto a PVDF membrane (Pierce), and incubated with the indicated antibodies. Anti-PGC1α and anti-HNF3γ (Foxa3) antibodies were purchased from Santa Cruz Biotechnology (sc-13067 and sc-5361, respectively). Anti-UCP1 antibody was purchased from Abcam (ab-23841), and anti-β-actin was purchased from Sigma-Aldrich (A5316).
Cell Culture.
10T1/2 cells (American Type Culture Collection) were maintained in DMEM supplemented with 10% FBS. 10T1/2 cells were transfected into a 96-well nucleofector (Lonza) according to the manufacturer’s instructions. Luciferase activity was assayed at 24 h after transfection, according to the manufacturer’s protocol (Promega) using a VICTOR3 V multilabel reader (PerkinElmer). For cAMP stimulation, at 20 h after transfection or infection, cells were treated with 0.5 mM dibutyryl cAMP (D0260; Sigma-Aldrich) for 4 h. WT and Foxa3-null stromal-vascular fraction (SVF) cells were obtained from iWAT and BAT tissues of 2- and 14- mo-old mice, and cultured and differentiated as described previously (24).
Cellular Metabolic Rates.
Cellular metabolic rates were measured using a XF24 Analyzer (Seahorse Bioscience). Respiration in differentiated primary BAT and iWAT cells obtained from 2- and 14-mo-old WT and Foxa3-null mice was measured, under basal conditions, in the presence of the mitochondrial inhibitor oligomycin (1 µM) or the mitochondrial uncoupler FCCP (1 µM).
ChIP Assays.
ChIP assays were performed according to the manufacturer’s instructions (Millipore). For tissue ChIP, a tissue disaggregation step was added before processing, according to the following protocol. Brown fat tissues obtained from 2- and 14-mo-old mice fed a normal diet were dissected, minced into small pieces, and cross-linked with 1.5% formaldehyde in PBS, followed by treatment with 0.125 M glycine. Then 100 mg of brown fat tissue was resuspended in PBS and ground with Medimachine System (BD Sciences) for 2 min until unicellular suspension was obtained before immunoprecipitation. For ChIP assays performed to determine the binding of Foxa3 to the PGC1α promoter in 10T1/2 cells, a Foxa3 expression plasmid was transfected into cells using an Amaxa nucleofector, and 48 h later, cells were treated with vehicle or cAMP for 4 h. ChIP assays were performed using IgG (12-370; Millipore), anti-Foxa3 (sc-25357; Santa Cruz Biotechnology), or anti-CREB (sc-58; Santa Cruz Biotechnology) antibodies. The primers used for the ChIP assays are listed in Table S3.
Immunohistochemistry.
Tissue were dissected and fixed in 4% formalin and embedded in paraffin following standard procedures (Histoserv), cut into 5-μm-thick sections, and then stained with H&E (Histoserv) for morphological analysis or with UCP1 (ab-23841; Abcam) for immunohistochemistry, following the manufacturers' instructions [Ready-to-Use Vectastain Universal ABC Kit (Vector Labs)]. Tissue slides were analyzed with an Olympus microscope at a 200× magnification.
Longevity Study.
For the determination of lifespan, male mice of different genotypes were housed together, with a maximum of five mice per cage. Day of death was calculated using either the date when mice were found dead or moribund or in such discomfort that euthanasia was recommended by the animal facility veterinarian. Mice involved in the lifespan analysis did not undergo any other metabolic or physiological analyses. Survival curves were plotted with the Kaplan–Meier method and compared using the log-rank test. Hazard ratio was determined by the Mantel–Haenszel approach and calculated by using GraphPad Prism software.
Statistical Analysis.
All experiments were repeated at least three times. Results are presented as mean ± SEM. Student t tests were performed with GraphPad Prosm software. A P value < 0.05 was considered statistically significant.
Supplementary Material
Acknowledgments
We thank Pasha Sarraf for discussions and comments on the manuscript; Tatyana Chanturiya and Ruifeng Tan for technical assistance; Klaus Kaestner for the gift of the Foxa3-null mice; and Jeffrey Kopp, Hidefumi Wakashin, and Shashi Shivrastav for sharing the Seahorse Instrument. This research was supported by the Intramural Research Program of the National Institute of Diabetes and Digestive and Kidney Diseases, National Institutes of Health.
Footnotes
The authors declare no conflict of interest.
This article is a PNAS Direct Submission. S.R.F. is a Guest Editor invited by the Editorial Board.
This article contains supporting information online at www.pnas.org/lookup/suppl/doi:10.1073/pnas.1407640111/-/DCSupplemental.
References
- 1.Farmer SR. Molecular determinants of brown adipocyte formation and function. Genes Dev. 2008;22(10):1269–1275. doi: 10.1101/gad.1681308. [DOI] [PMC free article] [PubMed] [Google Scholar]
- 2.Mueller E. Understanding the variegation of fat: Novel regulators of adipocyte differentiation and fat tissue biology. Biochim Biophys Acta. 2014;1842(3):352–357. doi: 10.1016/j.bbadis.2013.05.031. [DOI] [PubMed] [Google Scholar]
- 3.Boss O, Farmer SR. Recruitment of brown adipose tissue as a therapy for obesity-associated diseases. Front Endocrinol (Lausanne) 2012;3:14. doi: 10.3389/fendo.2012.00014. [DOI] [PMC free article] [PubMed] [Google Scholar]
- 4.Wu J, et al. Beige adipocytes are a distinct type of thermogenic fat cell in mouse and human. Cell. 2012;150(2):366–376. doi: 10.1016/j.cell.2012.05.016. [DOI] [PMC free article] [PubMed] [Google Scholar]
- 5.Sharp LZ, et al. Human BAT possesses molecular signatures that resemble beige/brite cells. PLoS ONE. 2012;7(11):e49452. doi: 10.1371/journal.pone.0049452. [DOI] [PMC free article] [PubMed] [Google Scholar]
- 6.Jespersen NZ, et al. A classical brown adipose tissue mRNA signature partly overlaps with brite in the supraclavicular region of adult humans. Cell Metab. 2013;17(5):798–805. doi: 10.1016/j.cmet.2013.04.011. [DOI] [PubMed] [Google Scholar]
- 7.Ouellet V, et al. Brown adipose tissue oxidative metabolism contributes to energy expenditure during acute cold exposure in humans. J Clin Invest. 2012;122(2):545–552. doi: 10.1172/JCI60433. [DOI] [PMC free article] [PubMed] [Google Scholar]
- 8.Saito M. Brown adipose tissue as a regulator of energy expenditure and body fat in humans. Diabetes Metab J. 2013;37(1):22–29. doi: 10.4093/dmj.2013.37.1.22. [DOI] [PMC free article] [PubMed] [Google Scholar]
- 9.Nedergaard J, Bengtsson T, Cannon B. Three years with adult human brown adipose tissue. Ann N Y Acad Sci. 2010;1212:E20–E36. doi: 10.1111/j.1749-6632.2010.05905.x. [DOI] [PubMed] [Google Scholar]
- 10.Rogers NH, Landa A, Park S, Smith RG. Aging leads to a programmed loss of brown adipocytes in murine subcutaneous white adipose tissue. Aging Cell. 2012;11(6):1074–1083. doi: 10.1111/acel.12010. [DOI] [PMC free article] [PubMed] [Google Scholar]
- 11.Mookerjee SA, Divakaruni AS, Jastroch M, Brand MD. Mitochondrial uncoupling and lifespan. Mech Ageing Dev. 2010;131(7-8):463–472. doi: 10.1016/j.mad.2010.03.010. [DOI] [PMC free article] [PubMed] [Google Scholar]
- 12.Bagattin A, Hugendubler L, Mueller E. Transcriptional coactivator PGC-1α promotes peroxisomal remodeling and biogenesis. Proc Natl Acad Sci USA. 2010;107(47):20376–20381. doi: 10.1073/pnas.1009176107. [DOI] [PMC free article] [PubMed] [Google Scholar]
- 13.Lin J, et al. Defects in adaptive energy metabolism with CNS-linked hyperactivity in PGC-1α null mice. Cell. 2004;119(1):121–135. doi: 10.1016/j.cell.2004.09.013. [DOI] [PubMed] [Google Scholar]
- 14.Leone TC, et al. PGC-1α deficiency causes multi-system energy metabolic derangements: Muscle dysfunction, abnormal weight control and hepatic steatosis. PLoS Biol. 2005;3(4):e101. doi: 10.1371/journal.pbio.0030101. [DOI] [PMC free article] [PubMed] [Google Scholar]
- 15.Kleiner S, et al. Development of insulin resistance in mice lacking PGC-1α in adipose tissues. Proc Natl Acad Sci USA. 2012;109(24):9635–9640. doi: 10.1073/pnas.1207287109. [DOI] [PMC free article] [PubMed] [Google Scholar]
- 16.Anderson R, Prolla T. PGC-1α in aging and anti-aging interventions. Biochim Biophys Acta. 2009;1790(10):1059–1066. doi: 10.1016/j.bbagen.2009.04.005. [DOI] [PMC free article] [PubMed] [Google Scholar]
- 17.Wenz T. Mitochondria and PGC-1α in aging and age-associated diseases. J Aging Res. 2011;2011:810619. doi: 10.4061/2011/810619. [DOI] [PMC free article] [PubMed] [Google Scholar]
- 18.Hannenhalli S, Kaestner KH. The evolution of Fox genes and their role in development and disease. Nat Rev Genet. 2009;10(4):233–240. doi: 10.1038/nrg2523. [DOI] [PMC free article] [PubMed] [Google Scholar]
- 19.Friedman JR, Kaestner KH. The Foxa family of transcription factors in development and metabolism. Cell Mol Life Sci. 2006;63(19-20):2317–2328. doi: 10.1007/s00018-006-6095-6. [DOI] [PMC free article] [PubMed] [Google Scholar]
- 20.Kaestner KH. The FoxA factors in organogenesis and differentiation. Curr Opin Genet Dev. 2010;20(5):527–532. doi: 10.1016/j.gde.2010.06.005. [DOI] [PMC free article] [PubMed] [Google Scholar]
- 21.Kaestner KH, Katz J, Liu Y, Drucker DJ, Schütz G. Inactivation of the winged helix transcription factor HNF3α affects glucose homeostasis and islet glucagon gene expression in vivo. Genes Dev. 1999;13(4):495–504. doi: 10.1101/gad.13.4.495. [DOI] [PMC free article] [PubMed] [Google Scholar]
- 22.Weinstein DC, et al. The winged-helix transcription factor HNF-3β is required for notochord development in the mouse embryo. Cell. 1994;78(4):575–588. doi: 10.1016/0092-8674(94)90523-1. [DOI] [PubMed] [Google Scholar]
- 23.Shen W, Scearce LM, Brestelli JE, Sund NJ, Kaestner KH. Foxa3 (hepatocyte nuclear factor 3γ) is required for the regulation of hepatic GLUT2 expression and the maintenance of glucose homeostasis during a prolonged fast. J Biol Chem. 2001;276(46):42812–42817. doi: 10.1074/jbc.M106344200. [DOI] [PubMed] [Google Scholar]
- 24.Xu L, et al. The winged helix transcription factor Foxa3 regulates adipocyte differentiation and depot-selective fat tissue expansion. Mol Cell Biol. 2013;33(17):3392–3399. doi: 10.1128/MCB.00244-13. [DOI] [PMC free article] [PubMed] [Google Scholar]
- 25.Kaestner KH, Hiemisch H, Schütz G. Targeted disruption of the gene encoding hepatocyte nuclear factor 3γ results in reduced transcription of hepatocyte-specific genes. Mol Cell Biol. 1998;18(7):4245–4251. doi: 10.1128/mcb.18.7.4245. [DOI] [PMC free article] [PubMed] [Google Scholar]
- 26.Shabalina IG, et al. UCP1 in brite/beige adipose tissue mitochondria is functionally thermogenic. Cell Reports. 2013;5(5):1196–1203. doi: 10.1016/j.celrep.2013.10.044. [DOI] [PubMed] [Google Scholar]
- 27.McDonald RB, Horwitz BA. Brown adipose tissue thermogenesis during aging and senescence. J Bioenerg Biomembr. 1999;31(5):507–516. doi: 10.1023/a:1005404708710. [DOI] [PubMed] [Google Scholar]
- 28.Li Z, et al. Foxa1 and Foxa2 regulate bile duct development in mice. J Clin Invest. 2009;119(6):1537–1545. doi: 10.1172/JCI38201. [DOI] [PMC free article] [PubMed] [Google Scholar]
- 29.Rausa FM, Tan Y, Costa RH. Association between hepatocyte nuclear factor 6 (HNF-6) and FoxA2 DNA binding domains stimulates FoxA2 transcriptional activity but inhibits HNF-6 DNA binding. Mol Cell Biol. 2003;23(2):437–449. doi: 10.1128/MCB.23.2.437-449.2003. [DOI] [PMC free article] [PubMed] [Google Scholar]
- 30.Handschin C, Rhee J, Lin J, Tarr PT, Spiegelman BM. An autoregulatory loop controls peroxisome proliferator-activated receptor γ coactivator 1α expression in muscle. Proc Natl Acad Sci USA. 2003;100(12):7111–7116. doi: 10.1073/pnas.1232352100. [DOI] [PMC free article] [PubMed] [Google Scholar]
- 31.Herzig S, et al. CREB regulates hepatic gluconeogenesis through the coactivator PGC-1. Nature. 2001;413(6852):179–183. doi: 10.1038/35093131. [DOI] [PubMed] [Google Scholar]
- 32.Qi L, et al. Adipocyte CREB promotes insulin resistance in obesity. Cell Metab. 2009;9(3):277–286. doi: 10.1016/j.cmet.2009.01.006. [DOI] [PMC free article] [PubMed] [Google Scholar]
- 33.Asterholm IW, Halberg N, Scherer PE. Mouse models of lipodystrophy key reagents for the understanding of the metabolic syndrome. Drug Discov Today Dis Models. 2007;4(1):17–24. doi: 10.1016/j.ddmod.2007.10.003. [DOI] [PMC free article] [PubMed] [Google Scholar]
- 34.Wang F, Mullican SE, DiSpirito JR, Peed LC, Lazar MA. Lipoatrophy and severe metabolic disturbance in mice with fat-specific deletion of PPARγ. Proc Natl Acad Sci USA. 2013;110(46):18656–18661. doi: 10.1073/pnas.1314863110. [DOI] [PMC free article] [PubMed] [Google Scholar]
- 35.Cederberg A, et al. FOXC2 is a winged helix gene that counteracts obesity, hypertriglyceridemia, and diet-induced insulin resistance. Cell. 2001;106(5):563–573. doi: 10.1016/s0092-8674(01)00474-3. [DOI] [PubMed] [Google Scholar]
- 36.Kenyon CJ. The genetics of ageing. Nature. 2010;464(7288):504–512. doi: 10.1038/nature08980. [DOI] [PubMed] [Google Scholar]
- 37.Bochkis IM, Shin S, Kaestner KH. Bile acid-induced inflammatory signaling in mice lacking Foxa2 in the liver leads to activation of mTOR and age-onset obesity. Mol Metab. 2013;2(4):447–456. doi: 10.1016/j.molmet.2013.08.005. [DOI] [PMC free article] [PubMed] [Google Scholar]
- 38.Lidell ME, et al. The adipocyte-expressed forkhead transcription factor Foxc2 regulates metabolism through altered mitochondrial function. Diabetes. 2011;60(2):427–435. doi: 10.2337/db10-0409. [DOI] [PMC free article] [PubMed] [Google Scholar]
- 39.Ma X, et al. Deletion of steroid receptor coactivator-3 gene ameliorates hepatic steatosis. J Hepatol. 2011;55(2):445–452. doi: 10.1016/j.jhep.2010.11.022. [DOI] [PubMed] [Google Scholar]
- 40.Haluzik M, Gavrilova O, LeRoith D. Peroxisome proliferator-activated receptor-α deficiency does not alter insulin sensitivity in mice maintained on regular or high-fat diet: Hyperinsulinemic-euglycemic clamp studies. Endocrinology. 2004;145(4):1662–1667. doi: 10.1210/en.2003-1015. [DOI] [PubMed] [Google Scholar]
- 41.Butler AA, Kozak LP. A recurring problem with the analysis of energy expenditure in genetic models expressing lean and obese phenotypes. Diabetes. 2010;59(2):323–329. doi: 10.2337/db09-1471. [DOI] [PMC free article] [PubMed] [Google Scholar]
Associated Data
This section collects any data citations, data availability statements, or supplementary materials included in this article.