

Abstract
OBJECTIVE
The factors that underlie pelvic pain are poorly understood. Specifically, the relative influence of dysmenorrhea and psychological factors in the etiology of noncyclic pelvic pain conditions, such as interstitial cystitis and irritable bowel syndrome, is unknown. To further characterize pelvic pain, we compared the frequency of menstrual, somatosensory, and psychological risk factors between women with and without severe noncyclic pelvic pain symptoms.
STUDY DESIGN
A total of 1012 reproductive-aged women completed a 112-item questionnaire with domains including mood, fatigue, physical activity, somatic complaint, and pain. Questionnaire items included existing items for menstrual distress and newly written items derived from qualitative interviews. The relationship of dysmenorrhea and noncyclic pelvic pain complaints (dyspareunia, dyschezia, or dysuria) was modeled using quantile regression.
RESULTS
Among women who menstruate regularly, those with dysmenorrhea had disproportionally more severe noncyclic pelvic pain (54/402, 13%) than women without dysmenorrhea (5/432, 1%; odds ratio, 13; 95% confidence interval, 5–33). In a multivariate-adjusted model, dysmenorrhea (β = .17), activity capability (β = .17), somatic complaint (β = .17), and bodily pain (β = .12) were the primary predictors of noncyclic pelvic pain. Depression (β = .03) and anxiety (β = .01) were not significantly predictive. The presence of dysmenorrhea, somatic complaint, and low activity capability predicted 90% of the cases of women with noncyclic pelvic pain.
CONCLUSION
The association between dysmenorrhea and noncyclic pelvic pain suggests that menstrual pain is an etiological factor in noncyclic pelvic pain, whereas depression and anxiety may be secondary effects. Longitudinal studies are needed to determine whether dysmenorrhea causally influences development of noncyclic pelvic pain or shares common underlying neural mechanisms.
Keywords: dysmenorrhea, interstitial cystitis, irritable bowel syndrome, pelvic pain
Pelvic pain conditions are common and have significant emotional, functional, and financial impact.1 Pelvic pain conditions include dysmenorrhea as well as noncyclic forms of pelvic pain, such as interstitial cystitis, irritable bowel syndrome, and dyspareunia. There is a frequent comorbidity of noncyclic pelvic pain with dysmenorrhea.2–5 Our research group has recently demonstrated moderate to severe dysmenorrhea is associated with increased bladder pain during clinical laboratory testing in otherwise asymptomatic women.6 Thus, the epidemiological and clinical literature supports a hypothesis that repeated uterine inflammation during menses may promote cross-organ pain sensitization, a mechanism by which dysfunction in 1 organ elicits neurogenic inflammation in adjacent organs.7–9
As an alternative, the higher prevalence of depression and anxiety in women with pelvic pain complaints points to alternative mechanisms given a variety of labels–“brain-gut,”10 neuroen-docrine,11 psychosomatic12,13–leading to treatment strategies using psychological management or psychotropic medication. Psychological distress and pain sensitivity are widely considered to be the chief underlying constructs for idiopathic pain disorders.14 Depression, anxiety, and abnormal circulating cortisol levels correlate with pain sensitivity in women with dysmenorrhea.15 A meta-analysis cataloging putative pelvic pain risk factors identified both psychological disorders and somatization (the tendency to report multiple unexplainable physical symptoms) as risk factors for noncyclic pelvic pain.16 In a clinical trial of women diagnosed with pelvic congestion syndrome, simultaneous treatments targeting hormonal and psychological dysfunction provided superior pain relief compared to hormonal therapy alone.17 However, to streamline treatment for noncyclic pelvic pain it is important to establish whether psychological factors (and other potential predictive factors) are interdependent or independent of reported dysmenorrhea and related menstrual symptoms. We conducted secondary analysis of a data-bank of questionnaire responses obtained for a separate pelvic pain survey project to evaluate the potential relationship among menstrual symptoms, psychological factors (depression, anxiety, somatization), physical activity, bodily pain, and noncyclic pelvic pain (a composite of self-reported urogenital pain symptoms).
Materials and Methods
The NorthShore University Health-System Institutional Review Board approved all phases of this study. We obtained a waiver of written informed consent due to the anonymous nature of participation.
Data in this study were originally collected as part of the development of a self-report measure of menstrual distress. We followed the strengthening the reporting of observational studies in epidemiology (STROBE) requirements for cross-sectional studies18 and guidelines for self-report measures.19 In the first stage of questionnaire development, 2 of the authors (F.T., J.W.G.) developed a candidate item bank of self-administered questions after reviewing published scales to assess menstrual distress and its associated features. Individual items included in this study (Appendix) were modified from the Menstrual Distress Questionnaire, Calendar of Premenstrual Experiences Inventory, Daily Record of Severity of Problems, and Premenstrual Assessment Form to use our standardized answer scale described below.20–23 Answers to questions were anchored on 5-point Likert scales (eg, never, rarely, sometimes, often, always) or 0–10 rating scales (0 = no pain to 10 = worst pain imaginable), and fell into the following domains: dysmenorrhea, depression, anxiety, somatic complaints (as a proxy for somatization), physical functioning (both activity capability and ability), and bodily pain. Additional selected items measuring depression, anxiety, physical functioning, and bodily pain that were judged to relate to the construct of menstrual distress were drawn from scales from the Patient Reported Outcomes Measurement Information System (PROMIS; http://nihpromis.org/). An example of a question on depression queried each subject to determine if “I felt worthless” using a 5-point Likert scale.
In the second stage, candidate items were reviewed and modified by 3 gynecologists experienced in the assessment of menstrual distress. In the third stage, women with dysmenorrhea were interviewed on the relevance of the preliminary questionnaire and invited to suggest new questions or modify items where appropriate. The final survey included demographic and menstrual history questions.
We planned to construct a 2-parameter item response theory model to analyze the structure of our item pool. Our prior experience with item response theory24,25 and prior published models26 suggested a large sample size would be required. Moreover, we planned to group participants on the basis of their current menstrual phase. Such an analysis plan also requires a large number of subjects per group, so we aimed to recruit approximately 1000 participants to have sufficient subsamples within groups. For the purposes of secondary analyses, we performed a post hoc, random-model power analysis to determine the smallest regression coefficients that would be detectable when examining as many as 10 different predicators (G-power).27 With 1000 subjects, it is possible to ascertain R2 values >0.02 with 99.9% power (α = 0.05). A patient panel company was contracted to acquire our survey data (Toluna USA, Wilton, CT).
Over an 8-day period, 1012 female subjects met quality controls and served as the primary sample for this study. Respondents did not see items about menstruation and menstrual distress until the end of the questionnaire to ensure that these items did not bias their responses to other items. Eligible participants were nonpregnant women 18–45 years of age, had regular periods (21- to 35-day intervals), and completed the survey in a period not <5 minutes or >24 hours.
We constructed the primary dependent variable, noncyclic pelvic pain, by averaging 4 individual questions regarding bladder pain, bowel pain, pain with sexual intercourse, and pain with urination over the last 7 days (0–10 Likert scale). For women who were not sexually active during the time frame, we used the average of the remaining 3 scores to compute the level of noncyclical pelvic pain. Women with noncyclic pelvic pain who scored 2 SD above the mean score (1.1, SD 1.7) were categorized as having severe noncyclic pelvic pain (>4.5/10 on 0–10 scale, hereafter called noncyclic pelvic pain). This is consistent with cut-offs used in a large epidemiological studies of chronic pain (>5/10 on 0–10 numeric rating scale)28 as well as the published Initiative on Methods, Measurement, and Pain Assessment in Clinical Trials consensus guidelines29 for studies of chronic pain (>4/10 or >5/10 on a 0–10 numeric rating scale).
Dysmenorrhea subtypes were generated based on the response to the question, “On average, how painful are your menstrual periods?” Women who rated their average menstrual pain levels as moderate, severe, or very severe were considered to have dysmenorrhea. This level of severity was chosen based on prior research showing that comparable levels of menstrual pain are sufficient to predict impact on daily activity30 and bladder sensitivity.6 Women with no or mild menstrual pain served as the comparison group. Menstrual phase was calculated based on the reported last menstrual period in regularly cycling women not on hormonal contraception (menstrual phase: days 1–5, follicular phase: days 6–14, luteal phase: days 15–35).
The internal consistency of constructs were assessed with Cronbach α (noncyclic pelvic pain: 0.88, depression: 0.95, anxiety: 0.93, somatic complaint: 0.85, activity capability: 0.95, activity interference: 0.85, bodily pain: 0.81). Whereas questions on activity capability asked whether subjects were capable of certain activities, questions on activity interference focused on whether health issues or pain actually limited activity. The somatic complaint category, which we use as a surrogate for somatization tendency, included questions on general bodily health complaints without reference to pain, unlike the category for bodily pain (Appendix). All variables in the study were transformed to a percentile score to adjust skewed distributions, permit comparisons between parameters, and increase interpretability.31
We compared demographic data (age, ethnicity, education, income) and pelvic pain variables using nonparametric statistics when appropriate. Other variables analyzed included (Appendix) menstrual history (6 items), dysmenorrhea (1–5 Likert scale), anxiety (8 items), depression (9 items), activity capability (10 items), activity interference (6 items), somatic complaint (average of 7 items), bodily pain (5 items), and general health (1–5 Likert scale). We used a type I error rate of α = .05 for all statistical tests.
Spearman correlation tables were generated to evaluate the nonparametric associations among dysmenorrhea, menstrual function, psychological contributing factors, and noncyclic pelvic pain. We performed quantile regression on hypothesized factors on noncyclic pelvic pain because it is less sensitive to distribution assumptions that would not have been met with linear regression.32 Quantile regression allows for the ability to adjust for confounding as well the selection of relevant quantiles to evaluate regression parameters. Quantile regression is similar to ordinary least squares regression, but can evaluate model co-efficients at relevant specific response quantiles rather than just the mean outcome. Model coefficients were calculated at the median quantile as well as the identified cutoff for severe noncyclic pelvic pain, the 93rd percentile (2 SD above the mean). Whereas co-efficients at the median quartile imply factors associated with above average risk, coefficients at the 93rd percentile are more representative of factors responsible for severe pelvic pain. Thus, while both sets of coefficients are reported in tables, the coefficients at the 93rd percentile are most relevant and primarily discussed in the text. The significance of coefficients was determined through bootstrapping using the default settings for the R package quantreg. All analyses were performed with R.33
Results
Seventy-one subjects met the criteria for noncyclic pelvic pain. The remaining 941 participants served as controls for the purposes of our analyses. This community-based sample was diverse with regard to socioeconomic and racial status: 55% of the subjects participating in this survey had below the median household US income ($51,413) and our cohort included 17% racial minorities. There were no significant differences in menstrual phase at the time of participation, income, or education between subjects with and without noncyclic pelvic pain (Table 1). Factors known to be associated with elevated menstrual pain were significantly increased in women with noncyclic pelvic pain, including minority racial status, menstrual flow heaviness, depression, anxiety, somatic complaint, and bodily pain (P < .01). Most notably, those with noncyclic pelvic pain also had significantly worse menstrual pain than control subjects (P < .001). Out of the 59 women with noncyclic pelvic pain who regularly menstruated, 54 had moderate to severe menstrual pain (odds ratio [OR], 13.3; 95% confidence interval, 5.2–33.5).
TABLE 1.
Subject demographics categorized by noncyclic pelvic pain status
| Variable | Severe noncyclic pelvic pain
|
Healthy
|
Significance |
|---|---|---|---|
| n = 71 | n = 941 | ||
| Age, y | 38 (28–44) | 36 (29–42) | P = .63 |
|
| |||
| Average length of menses, d | 5 (4–6) | 5 (4–6) | P = .99 |
|
| |||
| Average menstrual paina | 68 (68–90) | 34 (34–68) | P < .001 |
|
| |||
| Regular menstrual cycles, % | 66.2 | 72.8 | P = .23 |
|
| |||
| General healtha | 38 (9–38) | 38 (38–75) | P = .001 |
|
| |||
| Depressiona | 83 (72–90) | 48 (27–72) | P < .001 |
|
| |||
| Anxietya | 87 (72–93) | 48 (23–72) | P < .001 |
|
| |||
| Somatic complainta | 92 (84–97) | 47 (20–71) | P < .001 |
|
| |||
| Bodily paina | 87 (77–94) | 45 (26–70) | P < .001 |
|
| |||
| Menstrual phase during survey administration, % | P = .67 | ||
|
| |||
| Follicular | 12.7 | 12.5 | |
|
| |||
| Luteal | 18.3 | 22.0 | |
|
| |||
| Menses | 12.7 | 11.4 | |
|
| |||
| Missed period (>35 d) | 11.3 | 9.4 | |
|
| |||
| Hormone-regulated cycles | 11.3 | 17.5 | |
|
| |||
| Irregular, not applicable | 33.8 | 27.2 | |
|
| |||
| Menstrual heaviness, % | P = .01 | ||
|
| |||
| Extremely light | 3.4 | 5.0 | |
|
| |||
| Light | 23.7 | 24.7 | |
|
| |||
| Moderate | 37.3 | 52.8 | |
|
| |||
| Heavy | 28.8 | 13.4 | |
|
| |||
| Very heavy | 6.8 | 4.1 | |
|
| |||
| Race, % | P = .01 | ||
|
| |||
| American Indian | 4.2 | 0.6 | |
|
| |||
| Asian | 9.9 | 5.3 | |
|
| |||
| Black | 11.3 | 7.7 | |
|
| |||
| Native Hawaiian/Pacific Islander | 0.0 | 0.2 | |
|
| |||
| White | 71.8 | 83.7 | |
|
| |||
| Other | 2.8 | 2.4 | |
|
| |||
| Highest education level, % | P = .09 | ||
|
| |||
| <High school | 7.0 | 2.2 | |
|
| |||
| High school (or GED) | 29.6 | 23.9 | |
|
| |||
| Some college | 29.6 | 30.8 | |
|
| |||
| Bachelor or associate degree | 26.8 | 33.9 | |
|
| |||
| Graduate or professional degree | 7.0 | 9.1 | |
|
| |||
| Annual income, % | P = .92 | ||
|
| |||
| <$10,000 | 8.5 | 8.3 | |
|
| |||
| $10,000–29,999 | 26.8 | 23.0 | |
|
| |||
| $30,000–49,999 | 16.9 | 23.7 | |
|
| |||
| $50,000–74,999 | 23.9 | 20.9 | |
|
| |||
| $75,000–99,999 | 9.9 | 9.6 | |
|
| |||
| ≥$100,000 | 9.9 | 10.4 | |
|
| |||
| Do not know | 4.2 | 4.1 | |
Subjects were categorized as having noncyclic pelvic pain or as control. Data are presented as medians (with 25th and 75th percentiles) or distribution percentages. To determine significance, Wilcoxon rank sum tests were performed on scored variables and Pearson χ2 tests were performed on distributions. All subjects were included in this analysis (n = 1012).
GED, General Educational Development.
Converted percentile score (0–100).
To ensure that noncyclic pelvic pain did not merely reflect referred organ pain flaring during coincident menstruation at time of survey, the effect of menstrual phase was also controlled for in additional analysis. There was no statistical difference between noncyclic pelvic pain and pain-free groups in the proportion of regularly menstruating subjects responding during the menstrual phase (P = .9). Similarly, there was no statistically significant difference in noncyclic pelvic pain between subjects categorized with noncyclic pelvic pain during and outside of the menstrual phase (P = .9). The lack of significant relationship between noncyclic pelvic pain and menstrual phase indicates that noncyclic pelvic pain investigated in this study was not contemporaneous with menstrual pain.
The relationship between menstrual health variables (regularity, heaviness, period recency) and noncyclic pelvic pain was evaluated. Spearman correlations (Table 2) and quantile regression (Table 3) supported the hypothesis that dysmenorrhea was a principal factor correlated with noncyclic pelvic pain at the median and at critical thresholds (P < .0001). An overall pattern of increased pain within noncyclic pelvic pain constructs including the 2 general descriptor variables (pelvic pain and abdominal pain) was observed as a function of menstrual pain severity (P < .001) (Figure 1). Thus, dysmenorrhea was a strong indicator of both the likelihood and severity of noncyclic pelvic pain.
TABLE 2.
Correlations of menstrual factors and noncyclic pelvic pain
| Variable | 1 | 2 | 3 | 4 | 5 |
|---|---|---|---|---|---|
| Noncyclic pelvic pain (1) | .0001a | .0011a | .0001a | .57a | |
| Dysmenorrhea (2) | 0.37 | .0001a | .11a | .13a | |
| Period heaviness (3) | 0.11 | 0.35 | .90a | .10a | |
| Period regularity (4) | −0.13 | −0.05 | 0 | .0006a | |
| Recent period (5) | 0.02 | −0.05 | 0.06 | 0.12 |
Spearman correlation table shows correlation coefficients in lower left diagonal.
Upper right diagonal indicates statistical significance.
TABLE 3.
Quantile regression of menstrual factors and noncyclic pelvic pain
| Variable | βmedian | P value | βcrit | P value |
|---|---|---|---|---|
| Dysmenorrhea | 0.65 | .0001 | 0.3 | .0001 |
| Period heaviness | −30.02 | .66 | −0.05 | .04 |
| Period regularity | −0.3 | .0003 | −0.06 | .33 |
| Recent period | 0.1 | .15 | 0.04 | .17 |
Coefficients were determined for median levels of noncyclic pelvic pain (βmedian) and 93rd percentile, cutoff for noncyclic pelvic pain (βcrit). Significance was evaluated with bootstrapping.
FIGURE 1. Relationship of pelvic pain to dysmenorrhea.
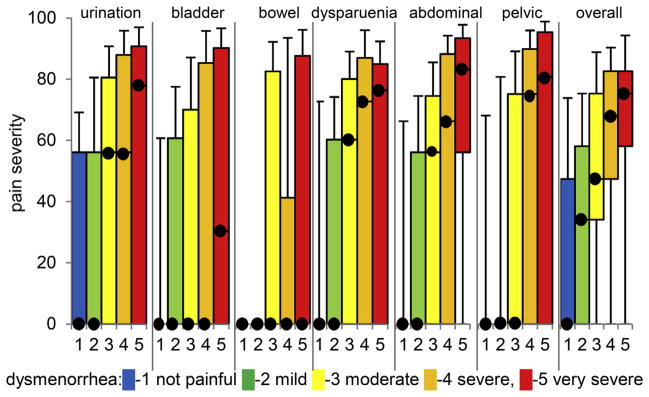
Box and whiskers plots indicate median, upper/lower decile, and upper/lower quartile for noncyclic pelvic pain constructs in subjects categorized with differing levels of menstrual pain (indicated by color and y axis). Related, but less specific constructs (abdominal, pelvic, and overall pain) also were correlated to severity of dysmenorrhea.
To estimate the unique contribution of dysmenorrhea to noncyclic pelvic pain, Spearman correlation (Table 4) and quantile regression (Table 5) were performed on all hypothesized risk factors. In the multivariate model, at the critical threshold for noncyclic pelvic pain the only consistent contributing factors were somatic complaints (β = 0.17), bodily pain (β = 0.12), and dysmenorrhea (β = 0.17). Although psychological factors initially appeared to have stronger correlations to noncyclic pelvic pain than dysmenorrhea (Table 4), neither depression (β = 0.03) nor anxiety (β = 0.01) were significant in the adjusted multivariate model.
TABLE 4.
Correlations of hypothesized risk factors and noncyclic pelvic pain
| Variable | 1 | 2 | 3 | 4 | 5 | 6 | 7 | 8 | 9 | 10 |
|---|---|---|---|---|---|---|---|---|---|---|
| Noncyclic pelvic pain (1) | .0001 | .0001 | .0001 | .0001 | .0001 | .0001 | .0001 | .0001 | .075 | |
| Somatic complaint (2) | 0.58 | .0001 | .0001 | .0001 | .0001 | .0001 | .0001 | .0001 | .39 | |
| Bodily pain (3) | 0.53 | 0.68 | .0001 | .0001 | .0001 | .0001 | .0001 | .0001 | .0001 | |
| Activity capability (4) | −0.5 | −0.52 | −0.61 | .0001 | .0001 | .0001 | .0001 | .0001 | .0001 | |
| Anxiety (5) | 0.46 | 0.72 | 0.59 | −0.47 | .0001 | .0001 | .0001 | .0001 | .66 | |
| Depression (6) | 0.4 | 0.66 | 0.52 | −0.41 | 0.83 | .0001 | .0001 | .0001 | .95 | |
| Dysmenorrhea (7) | 0.37 | 0.33 | 0.37 | −0.28 | 0.28 | 0.26 | .0001 | .0001 | .59 | |
| Activity interference (8) | 0.34 | 0.57 | 0.46 | −0.27 | 0.63 | 0.63 | 0.23 | .0001 | .54 | |
| General health (9) | −0.27 | −0.33 | −0.31 | 0.44 | −0.32 | −0.3 | −0.17 | −0.22 | .0014 | |
| Age (10) | −0.06 | 0.03 | 0.13 | −0.14 | 0.01 | 0 | −0.02 | −0.02 | −0.1 |
Spearman correlation table is shown with correlation coefficients (lower left diagonal) and statistical significance (upper right diagonal).
TABLE 5.
Quantile regression of hypothesized risk factors and noncyclic pelvic pain
| Variable | βmedian | P value | βcrit | P value |
|---|---|---|---|---|
| Somatic complaint | 0.42 | .0001 | 0.17 | .002 |
| Bodily pain | 0.17 | .01 | 0.12 | .03 |
| Activity capability | −0.28 | .9 | −0.17 | .0001 |
| Anxiety | 0.04 | .66 | 0.01 | .9 |
| Depression | −0.07 | .17 | 0.03 | .69 |
| Dysmenorrhea | 0.12 | .002 | 0.17 | .0001 |
| Activity interference | 0.01 | .9 | 0.02 | .71 |
| General health | −0.02 | .57 | 0.03 | .4 |
| Age | −0.11 | .0001 | −0.12 | .0001 |
Shown are model parameters for median levels of noncyclic pelvic pain (βmedian) and cutoff for noncyclic pelvic pain (βcrit).
To evaluate whether somatic complaint and bodily pain responses stemmed from a pathologic process as opposed to being the result of age or physical health-mediated processes, we evaluated age, overall self-reported general health, and physical functioning as confounders. Age and general overall health were inversely associated with noncyclic pelvic pain (Tables 4 and 5). Thus, subjects with noncyclic pelvic pain displayed features typical of idiopathic pain disorders rather than age-related health decline.
Application of model coefficients (Figure 2) demonstrates that levels of menstrual pain, total somatic complaints, and activity capability predict 44% of the variance in magnitude of noncyclic pelvic pain. Within the upper quartile of our model, noncyclic pelvic pain occurred in a predictable cluster. Although bootstrapping statistics confirmed the reliability of the model (Table 5), it could be reduced further: simultaneous menstrual pain, somatic complaint, and activity capability (reverse coded) in the upper quartile correctly predicted 90% of the subjects with noncyclic pelvic pain with a 5% false-positive rate and 4% false-negative rate.
FIGURE 2. Binned scatter plot of combined model of hypothesized factors involved in noncyclic pelvic pain.

Number of subjects with given noncyclic pelvic pain percentile score (x axis) is shown by diameter of each circle. Output of model based on amount of somatic complaint, activity capability, bodily pain, and dysmenorrhea is shown on y axis. Cluster of subjects has no noncyclic pelvic pain (left) and is predicted to have below median noncyclic pelvic pain. Above median levels of noncyclic pelvic pain, linear correlation between actual noncyclic pelvic pain and predicted noncyclic pelvic pain is shown by line generated by locally weighted scatter plot smoothed regression.
Comment
Our findings indicate that menstrual pain, even after controlling for depression and anxiety, is associated with the severity of noncyclic pelvic pain. Additionally, self-reported pain complaints in other systems are associated with the magnitude of noncyclic pelvic pain. Thus, our findings provide strong support for involvement of neurophysiological end-organ dysfunction, such as dysmenorrhea, as opposed to psychological dysfunction, in noncyclical pelvic pain.
Our cross-sectional study is consistent with findings from prior epidemiological studies, but also allows adjustment of confounding variables. The rate of comorbid dysmenorrhea in subjects with severe noncyclic pelvic pain identified in our study, 54 of 59 (91%), is slightly higher than in 2 other epidemiological studies reporting 81%5 and 83%.4 However, these other studies included subjects with milder levels of chronic pelvic pain. Although the role of depression and anxiety were not systematically investigated in prior studies of the role of dysmenorrhea in pelvic pain, subjects’ reported mood dysfunction was comorbid with these conditions.5
Other studies have identified relationships among chronic pelvic pain, depression, anxiety, and somatization, but neglected to examine the role of dysmenorrhea. In a metaanalysis, depression and anxiety were modestly positive risk factors for chronic pelvic pain (OR, 2.3–2.7).16 Psychosomatic symptoms (somatization) was reported to be one of the highest risk factors for chronic pelvic pain (OR, 8.0; 95% confidence interval, 5.2–12.4).16 Our study shows that even after adjusting for depression and anxiety, high levels of psychosomatic complaint are significantly associated with pelvic pain. Somatization has been shown to correlate with depression and anxiety in a prior study.34 In another study, 27% of women with chronic pelvic pain report bothersome medically unexplained symptoms involving different organ systems.35 Notably, psychosomatic disorders like somatization are difficult to reverse, so available treatments focus on enhancing coping rather than actually reducing symptoms.36
In contrast to targeting psychosomatic disorders, studies suggest dysmenorrhea is an exploitable target of treatments to prevent or reverse pelvic pain. As an example, women with dysmenorrhea and irritable bowel syndrome who were given hormonal treatment to improve menstrual distress reported that their bowel symptoms and abdominal pain sensitivity also improved.7 Likewise, oral contraceptive pills have been shown to reduce bladder pain in interstitial cystitis.37 How such treatment could work may be hormonally mediated reduction of elevated levels of pronociceptive mediators (ie, cytokines) within the inflamed uterus and resultant reversal of sensitization of neural pathways that promote the inflammation of the adjacent bladder and/or bowel.38 An attractive hypothesis needing further study is that by blocking or reducing repetitive adverse menstrual periods, cross-organ sensitization could be reduced. Attending to episodic pain conditions such as dysmenorrhea as a prophylactic strategy is supported by work in headache prevention. Acute, repetitive headaches are a modifiable risk factor in the development of chronic migraine headaches.39 Application of nonsteroidal antiinflammatory drugs during episodic migraine can substantially reduce (OR, 0.31) the likelihood of transformation into chronic migraine.40 Although it is possible that the mechanisms underlying chronic pelvic pain exacerbate dysmenorrhea, dysmenorrhea is more genetically stable than chronic pelvic pain41,42 and typically precedes the onset of chronic pelvic pain.43,44
Our findings must be interpreted with several caveats that are inherent to cross-sectional research. A causal link cannot be inferred between somatic sensitivity and future noncyclic pain risk. There was no physician exam of somatic complaints for unrelated disease processes, such as nausea due to gastroesophageal reflux, although surveys are typically used to identify nonspecific functional somatic disorders.35,45 In addition, our subjects were asked about current levels of pain rather than a history of chronic pain. Therefore, the outcome variable was cautiously labeled as noncyclic pelvic pain without explicit reference to chronicity. Noncyclic pelvic pain and chronic pelvic pain share many of the same complaints including pain during bowel movements, pain with urination, pain with sexual intercourse, and pain with a full bladder. However, future clinical studies are needed confirm the pain constructs used here.
Another potential limitation of our study is that it did not involve clinically structured interviews. The questions used in our study were drawn from several National Institutes of Health (NIH) PROMIS item banks that demonstrate strong correlations to legacy scales and can gauge severity across a wide spectrum of symptom severity.46 While we economized by not using the full item bank, the NIH PROMIS short forms for anxiety and depression were included, which have been shown to give scores highly correlated to the full item bank score.46
Strengths of this study include the sample size, the diversity of the sample and the use of patients and physicians to develop the initial item banks for menstrual distress. Specifically, the evaluation of key potential psychological confounders of the relationship between menstrual distress and reported noncyclic pelvic pain provide some insight on interactions unavailable in prior studies.
The findings of this study should heighten awareness of practicing physicians that patients exhibiting high degrees of somatic sensitivity and dysmenorrhea may be at risk of developing symptoms of chronic pelvic pain. Future prospective studies should clinically evaluate the relationship between dysmenorrhea and chronic pelvic pain as a first step before establishing the value of prophylactic strategies (eg, nonsteroidal antiinflammatory drugs and oral contraceptive pills) to reduce risk of developing chronic pelvic pain.
Acknowledgments
Financial support for this work was provided by the NorthShore University HealthSystem Clinical Collaborative Research Program (F.T., J.W.G.), National Institutes of Health grant K23HD054645 (F.T.).
Footnotes
The authors report no conflict of interest.
Presented in poster format at the 59th annual meeting of the Society for Gynecologic Investigation, San Diego, CA, March 21–24, 2012.
Reprints not available from the authors.
References
- 1.Mathias SD, Kuppermann M, Liberman RF, Lipschutz RC, Steege JF. Chronic pelvic pain: prevalence, health-related quality of life, and economic correlates. Obstet Gynecol. 1996;87:321–7. doi: 10.1016/0029-7844(95)00458-0. [DOI] [PubMed] [Google Scholar]
- 2.Mára M, Fucíková Z, Kuzel D, Dohnalová A, Haaková L, Zivný J. Laparoscopy in chronic pelvic pain–a retrospective clinical study [article in Czech] Ceska Gynekol. 2002;67:38–46. [PubMed] [Google Scholar]
- 3.Reiter RC, Gambone JC. Nongynecologic somatic pathology in women with chronic pelvic pain and negative laparoscopy. J Reprod Med. 1991;36:253–9. [PubMed] [Google Scholar]
- 4.Grace VM, Zondervan KT. Chronic pelvic pain in New Zealand: prevalence, pain severity, diagnoses and use of the health services. Aust N Z J Public Health. 2004;28:369–75. doi: 10.1111/j.1467-842x.2004.tb00446.x. [DOI] [PubMed] [Google Scholar]
- 5.Zondervan KT, Yudkin PL, Vessey MP, et al. The community prevalence of chronic pelvic pain in women and associated illness behavior. Br J Gen Pract. 2001;51:541–7. [PMC free article] [PubMed] [Google Scholar]
- 6.Tu FF, Epstein AE, Pozolo KE, Sexton DL, Melnyk AI, Hellman KM. A noninvasive bladder sensory test supports a role for dysmenorrhea increasing bladder noxious mechanosensitivity. Clin J Pain. 2013;29:883–90. doi: 10.1097/AJP.0b013e31827a71a3. [DOI] [PMC free article] [PubMed] [Google Scholar]
- 7.Giamberardino MA, Costantini R, Affaitati G, et al. Viscerovisceral hyperalgesia: characterization in different clinical models. Pain. 2010;151:307–22. doi: 10.1016/j.pain.2010.06.023. [DOI] [PubMed] [Google Scholar]
- 8.Jarrett M, Cain KC, Heitkemper M, Levy RL. Relationship between gastrointestinal and dysmenorrheic symptoms at menses. Res Nurs Health. 1996;19:45–51. doi: 10.1002/(SICI)1098-240X(199602)19:1<45::AID-NUR5>3.0.CO;2-L. [DOI] [PubMed] [Google Scholar]
- 9.Brinkert W, Dimcevski G, Arendt-Nielsen L, Drewes AM, Wilder-Smith OHG. Dysmenorrhea is associated with hypersensitivity in the sigmoid colon and rectum. Pain. 2007;132(Suppl):S46–51. doi: 10.1016/j.pain.2006.12.011. [DOI] [PubMed] [Google Scholar]
- 10.Mayer EA. Clinical practice: irritable bowel syndrome. N Engl J Med. 2008;358:1692–9. doi: 10.1056/NEJMcp0801447. [DOI] [PMC free article] [PubMed] [Google Scholar]
- 11.Buffington CAT. Comorbidity of interstitial cystitis with other unexplained clinical conditions. J Urol. 2004;172:1242–8. doi: 10.1097/01.ju.0000137953.49304.6c. [DOI] [PubMed] [Google Scholar]
- 12.Mykletun A, Jacka F, Williams L, et al. Prevalence of mood and anxiety disorder in self reported irritable bowel syndrome (IBS): an epidemiological population based study of women. BMC Gastroenterol. 2010;10:88. doi: 10.1186/1471-230X-10-88. [DOI] [PMC free article] [PubMed] [Google Scholar]
- 13.Bodden-Heidrich R, Küppers V, Beckmann MW, Ozörnek MH, Rechenberger I, Bender HG. Psychosomatic aspects of vulvodynia: comparison with the chronic pelvic pain syndrome. J Reprod Med. 1999;44:411–6. [PubMed] [Google Scholar]
- 14.Diatchenko L, Anderson AD, Slade GD, et al. Three major haplotypes of the beta2 adrenergic receptor define psychological profile, blood pressure, and the risk for development of a common musculoskeletal pain disorder. Am J Med Genet B Neuropsychiatr Genet. 2006;141B:449–62. doi: 10.1002/ajmg.b.30324. [DOI] [PMC free article] [PubMed] [Google Scholar]
- 15.Vincent K, Warnaby C, Stagg CJ, Moore J, Kennedy S, Tracey I. Dysmenorrhea is associated with central changes in otherwise healthy women. Pain. 2011;152:1966–75. doi: 10.1016/j.pain.2011.03.029. [DOI] [PubMed] [Google Scholar]
- 16.Latthe P, Mignini L, Gray R, Hills R, Khan K. Factors predisposing women to chronic pelvic pain: systematic review. BMJ. 2006;332:749–55. doi: 10.1136/bmj.38748.697465.55. [DOI] [PMC free article] [PubMed] [Google Scholar]
- 17.Farquhar CM, Rogers V, Franks S, Beard RW, Wadsworth J, Pearce S. A randomized controlled trial of medroxyprogesterone acetate and psychotherapy for the treatment of pelvic congestion. BJOG. 1989;96:1153–62. doi: 10.1111/j.1471-0528.1989.tb03190.x. [DOI] [PubMed] [Google Scholar]
- 18.Von Elm E, Altman DG, Egger M, Pocock SJ, Gøtzsche PC, Vandenbroucke JP. The strengthening the reporting of observational studies in epidemiology (STROBE) statement: guidelines for reporting observational studies. J Clin Epidemiol. 2008;61:344–9. doi: 10.1016/j.jclinepi.2007.11.008. [DOI] [PubMed] [Google Scholar]
- 19.Cella D, Yount S, Rothrock N, et al. The patient-reported outcomes measurement information system (PROMIS): progress of an NIH roadmap cooperative group during its first two years. Med Care. 2007;45(Suppl):S3–11. doi: 10.1097/01.mlr.0000258615.42478.55. [DOI] [PMC free article] [PubMed] [Google Scholar]
- 20.Moos RH. The development of a menstrual distress questionnaire. Psychosom Med. 1968;30:853–67. doi: 10.1097/00006842-196811000-00006. [DOI] [PubMed] [Google Scholar]
- 21.Carver CS, Scheier MF, Weintraub JK. Assessing coping strategies: a theoretically based approach. J Pers Soc Psychol. 1989;56:267–83. doi: 10.1037//0022-3514.56.2.267. [DOI] [PubMed] [Google Scholar]
- 22.Endicott J, Nee J, Harrison W. Daily record of severity of problems (DRSP): reliability and validity. Arch Womens Ment Health. 2006;9:41–9. doi: 10.1007/s00737-005-0103-y. [DOI] [PubMed] [Google Scholar]
- 23.Halbreich U, Endicott J, Schacht S. Premenstrual syndromes: a new instrument for their assessment. J Psychiatr Treat Eval. 1982;4:161–4. [Google Scholar]
- 24.Griffith JW, Sumner JA, Debeer E, et al. An item response theory/confirmatory factor analysis of the autobiographical memory test. Memory. 2009;17:609–23. doi: 10.1080/09658210902939348. [DOI] [PMC free article] [PubMed] [Google Scholar]
- 25.Hahn EA, Choi SW, Griffith JW, Yost KJ, Baker DW. Health literacy assessment using talking touchscreen technology (Health LiTT): a new item response theory-based measure of health literacy. J Health Commun. 2011;16(Suppl):150–62. doi: 10.1080/10810730.2011.605434. [DOI] [PMC free article] [PubMed] [Google Scholar]
- 26.Holman R, Glas CAW, De Haan RJ. Power analysis in randomized clinical trials based on item response theory. Control Clin Trials. 2003;24:390–410. doi: 10.1016/s0197-2456(03)00061-8. [DOI] [PubMed] [Google Scholar]
- 27.Faul F, Erdfelder E, Lang A-G, Buchner A. G*Power 3: a flexible statistical power analysis program for the social, behavioral, and biomedical sciences. Behav Res Methods. 2007;39:175–91. doi: 10.3758/bf03193146. [DOI] [PubMed] [Google Scholar]
- 28.Breivik H, Collett B, Ventafridda V, Cohen R, Gallacher D. Survey of chronic pain in Europe: prevalence, impact on daily life, and treatment. Eur J Pain. 2006;10:287–333. doi: 10.1016/j.ejpain.2005.06.009. [DOI] [PubMed] [Google Scholar]
- 29.Dworkin RH, Turk DC, Peirce-Sandner S, et al. Considerations for improving assay sensitivity in chronic pain clinical trials: IMMPACT recommendations. Pain. 2012;153:1148–58. doi: 10.1016/j.pain.2012.03.003. [DOI] [PubMed] [Google Scholar]
- 30.Gruber VA, Wildman BG. The impact of dysmenorrhea on daily activities. Behav Res Ther. 1987;25:123–8. doi: 10.1016/0005-7967(87)90083-0. [DOI] [PubMed] [Google Scholar]
- 31.Zimmerman DW. Can percentiles replace raw scores in the statistical analysis of test data? Educ Psychol Meas. 2005;65:616–38. [Google Scholar]
- 32.Koenker R, Bassett G., Jr Regression quantiles. Econometrica. 1978;46:33–50. [Google Scholar]
- 33.R Development Team. R: A language and environment for statistical computing. Vienna (Austria): 2008. [Google Scholar]
- 34.Löwe B, Spitzer RL, Williams JBW, Mussell M, Schellberg D, Kroenke K. Depression, anxiety and somatization in primary care: syndrome overlap and functional impairment. Gen Hosp Psychiatry. 2008;30:191–9. doi: 10.1016/j.genhosppsych.2008.01.001. [DOI] [PubMed] [Google Scholar]
- 35.Lai HH, North CS, Andriole GL, Sayuk GS, Hong BA. Polysymptomatic, polysyndromic presentation of patients with urological chronic pelvic pain syndrome. J Urol. 2012;187:2106–12. doi: 10.1016/j.juro.2012.01.081. [DOI] [PMC free article] [PubMed] [Google Scholar]
- 36.Barsky AJ, Ahern DK. Cognitive behavior therapy for hypochondriasis: a randomized controlled trial. JAMA. 2004;291:1464–70. doi: 10.1001/jama.291.12.1464. [DOI] [PubMed] [Google Scholar]
- 37.Lentz GM, Bavendam T, Stenchever MA, Miller JL, Smalldridge J. Hormonal manipulation in women with chronic, cyclic irritable bladder symptoms and pelvic pain. Am J Obstet Gynecol. 2002;186:1268–73. doi: 10.1067/mob.2002.123729. [DOI] [PubMed] [Google Scholar]
- 38.Winnard KP, Dmitrieva N, Berkley KJ. Cross-organ interactions between reproductive, gastrointestinal, and urinary tracts: modulation by estrous stage and involvement of the hypogastric nerve. Am J Physiol Regul Integr Comp Physiol. 2006;291:R1592–601. doi: 10.1152/ajpregu.00455.2006. [DOI] [PubMed] [Google Scholar]
- 39.Bigal ME, Lipton RB. Modifiable risk factors for migraine progression (or for chronic daily headaches)–clinical lessons. Headache. 2006;46(Suppl):S144–6. doi: 10.1111/j.1526-4610.2006.00566.x. [DOI] [PubMed] [Google Scholar]
- 40.Bigal ME, Serrano D, Buse D, Scher A, Stewart WF, Lipton RB. Acute migraine medications and evolution from episodic to chronic migraine: a longitudinal population-based study. Headache. 2008;48:1157–68. doi: 10.1111/j.1526-4610.2008.01217.x. [DOI] [PubMed] [Google Scholar]
- 41.Treloar SA, Martin NG, Heath AC. Longitudinal genetic analysis of menstrual flow, pain, and limitation in a sample of Australian twins. Behav Genet. 1998;28:107–16. doi: 10.1023/a:1021419907305. [DOI] [PubMed] [Google Scholar]
- 42.Zondervan KT, Cardon LR, Kennedy SH, Martin NG, Treloar SA. Multivariate genetic analysis of chronic pelvic pain and associated phenotypes. Behav Genet. 2005;35:177–88. doi: 10.1007/s10519-004-1017-6. [DOI] [PubMed] [Google Scholar]
- 43.Treloar SA, Bell TA, Nagle CM, Purdie DM, Green AC. Early menstrual characteristics associated with subsequent diagnosis of endometriosis. Am J Obstet Gynecol. 2010;202:534 e1–6. doi: 10.1016/j.ajog.2009.10.857. [DOI] [PubMed] [Google Scholar]
- 44.Svanberg L, Ulmsten U. The incidence of primary dysmenorrhea in teenagers. Arch Gynecol. 1981;230:173–7. doi: 10.1007/BF02111800. [DOI] [PubMed] [Google Scholar]
- 45.Katz RS, Wolfe F, Michaud K. Fibromyalgia diagnosis: a comparison of clinical, survey, and American College of Rheumatology criteria. Arthritis Rheum. 2006;54:169–76. doi: 10.1002/art.21533. [DOI] [PubMed] [Google Scholar]
- 46.Pilkonis PA, Choi SW, Reise SP, Stover AM, Riley WT, Cella D. Item banks for measuring emotional distress from the patient-reported outcomes measurement information system (PROMIS®): depression, anxiety, and anger. Assessment. 2011;18:263–83. doi: 10.1177/1073191111411667. [DOI] [PMC free article] [PubMed] [Google Scholar]