

Abstract
Transcranial magnetic stimulation (TMS) is a useful tool to induce and measure plasticity in the human brain. However, the cortical effects are generally indirectly evaluated with motor-evoked potentials (MEPs) reflective of modulation of cortico-spinal excitability. In this study, we aim to provide direct measures of cortical plasticity by combining TMS with electroencephalography (EEG).
Continuous theta-burst stimulation (cTBS) was applied over the primary motor cortex (M1) of young healthy adults; and we measured modulation of (i) motor evoked-potentials (MEPs), (ii) TMS-induced EEG evoked potentials (TEPs), (iii) TMS-induced EEG synchronization and (iv) eyes-closed resting EEG.
Our results show the expected cTBS-induced decrease in MEPs size, which we found to be paralleled by a modulation of a combination of TEPs. Furthermore, we found that cTBS increased the power in the theta band of eyes-closed resting EEG, whereas it decreased single-pulse TMS-induced power in the theta and alpha bands. In addition, cTBS decreased the power in the beta band of eyes-closed resting EEG, whereas it increased single-pulse TMS-induced power in the beta band.
We suggest that cTBS acts by modulating the phase alignment between already active oscillators; it synchronizes low frequency (theta and/or alpha) oscillators and desynchronizes high frequency (beta) oscillators. These results provide novel insights into the cortical effects of cTBS and could be useful for exploring cTBS-induced plasticity outside of the motor cortex.
Keywords: Cortico-spinal excitability, cTBS, TMS-evoked potentials, oscillations
Introduction
Transcanial magnetic stimulation (TMS) is a useful tool to measure nervous system plasticity in humans. Theta-burst stimulation (TBS), a repetitive TMS protocol, can induce robust and long-lasting modulation of cortical excitability (Huang et al., 2005). Continuous theta burst stimulation (cTBS) applied over the primary motor cortex (M1) has been shown to decrease the amplitude of motor-evoked potentials (MEPs) induced by single-pulse TMS in contralateral muscles for several minutes, suggesting a long-term depression-like (LTD-like) reduction of cortico-spinal excitability (Huang et al., 2005). Pharmacological and neurophysiologic studies with recording of descending spinal volleys suggest that this cTBS-induced modulation of cortico-spinal excitability is mediated by changes at cortical level that are NMDA-dependent (Di Lazzaro et al., 2005; Huang et al., 2007). In addition, cTBS also modulates intracortical inhibition (Huang et al., 2005; McAllister et al., 2009).
Combination of TMS with electroencephalography (EEG) is a promising methodology to directly characterize brain responses at the cortical level (Miniussi & Thut, 2010) and may thus provide a useful method to further characterize the neurophysiologic substrate of cTBS-induced plasticity and enable assessment of cortical plasticity in regions outside the motor cortex. In the present study, we aimed to assess the relation between MEPs and EEG measures of TBS-induced plasticity, i.e. TMS-evoked potentials, TMS-evoked synchronizations and resting eyes-closed EEG.
Materials and Methods
Participants
Ten young healthy, right-handed adults volunteered to participate in the study (21 ± 2 years old, range 18–24 years old, 4 females). None of them had a history of psychiatric or neurological conditions, and all had normal neurological and medical examinations, and Mini Mental State Examination (MMSE) scores in the normal range (27–30). Participants were not taking any medication known to affect motor cortical excitability at the time of the study and did not have any contraindications to TMS. All tolerated the TMS without any side effect or complication. All gave their written informed consent to the study, which followed international guidelines and recommendations for the safe use of TMS (Rossi et al., 2009), had been approved by the local Institutional Review Board (Beth Israel Deaconess Medical Center, Boston, USA) and was conducted in adherence to the Declaration of Helsinki.
Experimental set-up
We evaluated the effects of cTBS, a repetitive TMS intervention. Before and after cTBS, corticospinal excitability was assessed by recording MEPs in response to single-pulse TMS. EEG was recorded concurrently, and TMS-induced electroencephalographic potentials and spectrum perturbation were evaluated. Finally, resting eyes-closed EEG was also evaluated.
The stimulation setup consisted of a Nexstim stimulator (Nexstim Ltd, Helsinki, Finland) for single-pulse TMS and a MagPro stimulator (MagVenture A/S, Farum, Denmark) for the cTBS intervention. We used figure-of-eight TMS coils delivering biphasic pulses (for Nexstim: mean diameter 50 mm and outer diameter 70 mm, each wing; for MagPro: inner diameter 35 mm and outer diameter 75 mm, each wing). In all instances, the Nexstim neuronavigation system was used, ensuring reproducible and reliable coil placement within experimental session. All participants underwent a brain MRI to rule out structural brain lesions and generate a high-resolution, anatomical brain image to guide the TMS using the Nexstim neuronavigation system. A 3-Tesla scanner (GE) was used for MRI acquisition.
For MEPs’ measurement, surface electromyography (EMG) was recorded using pre-gelled, disposable Ag/AgCl electrodes with the active electrode over the first dorsal interosseus muscle (FDI), the reference electrode over the metacarpophalangeal joint and the ground electrode over the wrist. The EMG signal was acquired at 3kHz, filtered (10–500 Hz), amplified, displayed and stored for off-line analysis.
EEG was recorded with a 60-channel TMS-compatible EEG system (eXimia EEG, Nexstim Ltd, Helsinki, Finland). This system is designed to avoid amplifier saturation after TMS pulses by using a sample-and-hold circuit that keeps the input of the amplifiers constant from 100 μs prestimulus to 2 ms poststimulus (Virtanen et al., 1999). The signals were sampled at 1450 Hz with 16 bit resolution and referenced to an electrode placed on the forehead. Impedance of each electrode was kept below 5 kΩ. Vertical electrooculogram (EOG) was recorded by two extra sensors.
Experimental session
Participants were seated in a comfortable chair, with a headrest, and with their hands resting on their laps. They were monitored for drowsiness and asked to keep their eyes open during TMS. Relaxation of the measured muscle was controlled by continuous visual EMG monitoring. All participants wore earplugs to protect them from possible acoustic trauma (Rossi et al., 2009), and reduce contamination of TMS-evoked potentials by auditory responses to the clicks produced by the discharge of the TMS coil.
The optimal scalp location, over left primary motor cortex (M1), for TMS-induced activation of the right first dorsal interosseus muscle (FDI), was determined as the scalp location from which TMS induced MEPs of maximum peak-to-peak amplitude in the target muscle. Once the optimal spot was identified, the neuronavigation system was used to ensure consistent coil placement and orientation at the optimal spot (Fig. 1A). Resting motor threshold (RMT) was defined as the lowest stimulus intensity of the Nexstim stimulator capable of inducing MEPs of ≥ 50 μV peak-to-peak amplitude in at least 5 out of 10 trials. Active motor threshold (AMT) was defined as the lowest stimulus intensity of the MagPro stimulator capable of inducing visible twitches in the FDI in half of the trials while the participants maintained a contraction of the FDI at approximately 20% of the maximal voluntary contraction (Rossini et al., 1994; Chen et al., 2008).
Figure 1.

Illustration of the experimental procedures. A. Illustration of the left M1 targeted with single-pulse TMS and with the cTBS intervention on an individual MRI. B. Illustration of the cTBS intervention: 200 triplets at 50 Hz, separated by 200 ms (inter-stimulus interval of 240 ms). C. Illustration of TMS-evoked time-domain EEG activity at all electrodes for all trials in one participant.
Continuous TBS was applied with parameters similar to those used by Huang et al. (2005): three pulses at 50 Hz, with an interval of 200 ms between the last pulse of a triplet and the first pulse of a triplet, for a total number of 600 pulses (Fig. 1B). The intensity was fixed at 80% of AMT. Due to limitations in our experimental set-up, the interstimulus interval was 240 ms compared to the interstimulus interval of 200 ms in the original paradigm introduced by Huang et al. (2005). Thus, in our cTBS paradigm, the triplet repetition rate was about 4.17 Hz instead of 5 Hz, both frequencies being included in the theta band.
To establish a pre-cTBS measure, two batches of ten to thirty MEPs were recorded in response to single-pulse of TMS at an intensity of 120% of RMT. The pulses were delivered randomly with interstimulus intervals between 6 and 10 sec. Following cTBS, a single batch of MEPs was measured immediately after (T0) and then at 5, 10, 20, 30, 40, 50 and 60 minutes following cTBS. EEG was recorded simultaneously at all these times.
In a sub-group of 7 subjects, resting eyes-closed EEG was recorded at the beginning of the session and after cTBS. These post-cTBS resting EEG measures were recorded sequentially after the single-pulse TMS batches at T5, T10, T20, T30, and T40. Thus, the TX resting EEG measures (X referring to the time in min) started approximately between X+2 and X+6 min after cTBS and lasted 2 to 4 min.
Data analysis
MEPs’ peak-to-peak amplitude was determined automatically using the Nexstim Neurophysiologic Analysis software, but checked trial-by-trial by visual inspection. For each subject, pre-cTBS MEPs’ amplitude was defined as the averaged peak-to-peak amplitude of the MEPs recorded during the two pre-cTBS batches. MEPs’ amplitude at time T after cTBS was defined as the averaged peak-to-peak amplitude of the MEPs recorded during the corresponding batch; this value was then expressed as the change in MEPs compared to pre-cTBS, i.e. [MEPs(T) – MEPs(pre-cTBS)]/MEPs(pre-cTBS). Thus, negative values reflect suppression after cTBS. Student t-tests were run to determine if MEPs’ amplitude were significantly different from zero after cTBS. Bonferroni was applied to correct for multiple comparisons. To account for the variance of the baseline, Student t-tests were also run on raw, non-normalized, data.
EEG data recorded during batches of single-pulse TMS (Fig. 1C) were processed offline using the EEGlab toolbox (Delorme & Makeig, 2004) running in a MATLAB environment (Mathworks). The EEG signals were analyzed with the common reference, as recorded. They were first high-pass filtered above 1 Hz. Continuous data was epoched from 200 ms before the TMS pulse to 600 ms after. Baseline correction was applied based on a pre-TMS interval of 200 ms. Disconnected channels were removed and recomputed (spherical interpolation) after cleaning (see below). Independent component analysis (ICA) was performed to separate residual electrical from physiological response to TMS pulse. Components related to electrical artifacts were identified by their activity strongly peaking at the vicinity of the stimulation sites during the first tens of milliseconds after a pulse, and by their spectrum covering restricted frequency range with strong harmonics. Components clearly reflecting other artifacts, such as muscle contamination or eye blinks, were also removed. On average, 9.6 ± 4.1 (range 3–17) components were removed, most of the artifacts being identified in the first few components. We cannot exclude that true brain response to TMS was also partly removed with components identified as artifacts. However, as the same components were removed for all conditions within a subject, we expect changes in EEG response to TMS after cTBS to be related to cTBS-induced changes in brain excitability.
Grand-average of TMS-induced EEG responses were then calculated for the group. For pre-cTBS and for each time batch after cTBS, we calculated the grand-average time-domain response at C3 electrode (over M1). For each of the pre-cTBS and post-cTBS conditions, we identified the amplitude of four TMS-evoked potentials (TEPs) that are commonly reported in the literature (Paus et al., 2001; Komssi et al., 2004; Komssi and Kahkonen, 2006; Bonato et al., 2006; Van Der Werf and Paus, 2006; Fitzgerald, 2010), i.e. P30, N45, P55 and N100. Then, changes in amplitude compared to pre-cTBS were calculated for each TEP as [TEP(T) – TEP(pre-cTBS)]/TEP(pre-cTBS). To estimate if modulation of MEPs by cTBS could be related to modulation of one or several TEPs, a multi-regression analysis was run to determine the equation linking the weighted TEPs and the MEPs. As no batch of MEPs was significantly modulated by cTBS after 40 minutes (see results), the multi-regression analysis was limited to the first 40 minutes after cTBS and the percentage of variance explained by the model was calculated.
For the analysis of TMS-induced oscillations, EEG responses from all subjects were pooled together. TMS-related spectrum perturbation (TRSP) at the C3 electrode was calculated between 4 and 40 Hz with fast Fourier transformation (FFT) and Hamming windows at pre-cTBS and at T0, T5, T10, T20, T30 and T40 (newtimef function from EEGlab with a padratio of 4). A permutation test was used to assess statistical significance. In other words, we assessed the effects of single-pulse TMS on oscillations by comparing the measured pre-single-pulse/post-single-pulse difference with 200 calculated pre/post differences obtained by randomly permuting pre and post values. Then, the difference between pre-cTBS and post-cTBS measures was calculated, and a similar permutation test was used to assess statistical significance of the cTBS effects on TMS-induced oscillations.
EEG data recorded during resting conditions was first filtered between 0.1 and 50 Hz (FFT) and then divided into 2 s epochs. Epochs contaminated by blinks or artifacts were removed; on average, 65 ± 22 (range 34–118) epochs remained. A one-way repeated-measures ANOVA ensured that the number of epochs were not statistically different across timing (p > 0.05). The spectrum was calculated with FFT using non-overlapping Hamming windows with a bin width of 0.5 Hz, and then averaged across epochs. Averaged power in theta (4–7.5 Hz), alpha (8–12.5 Hz), low beta (13–19.5 Hz) and high beta (20–39.5 Hz) bands was calculated. Two-way repeated-measures ANOVA was performed to assess the effect of time (pre-cTBS, T5, T10, T20, T30 and T40) and frequency bands (theta, alpha, low beta and high beta), and the interaction of these two factors on the power spectrum. Post-hoc significance was assessed with Bonferroni’s multiple comparison tests.
Statistical tests were performed with MATLAB (EEG data acquired during batches of single-pulse) and with Prism (MEPs and resting EEG). Statistical significance was set to p < 0.05.
Results
All participants completed the TMS sessions without any side effects. The results presented below will describe the (i) cTBS effects on brain excitability measured with MEPs amplitude; (ii) cTBS effects on time-domain content of the EEG signal, i.e. the TMS-evoked potentials (TEPs) and the link between these measures and the MEPs; (iii) cTBS effects on spectral content of the EEG signal, i.e. TMS-related spectrum perturbation (TRSP); and (iv) cTBS effects on resting eyes-closed EEG.
Modulation of MEPs by cTBS
RMT was on average 46 ± 17% of maximum stimulator output, and pre-cTBS average MEP amplitude was 970 ± 630 μV. Fig. 2 shows the changes in MEPs’ amplitude at different time intervals after cTBS compared to pre-cTBS. Participants showed mainly suppression of MEPs following cTBS, which was statistically significant at T0, T5 and T40 (t-test, p < 0.05). Only the suppression at T0 remained significant after correction for multiple comparisons. Student t-test applied on raw data, instead of normalized data, gave similar results, with the modulation being statistically significant at T0 (p < 0.05) and marginally significant at T5, T30 and T40 (p < 0.08). All but one participant showed suppression of MEP amplitude immediately after cTBS, and this one participant started to show MEP suppression 5 minutes after cTBS. Thus, we found the expected pattern of suppression of MEP amplitude (“inhibition”) after cTBS (Huang et al., 2005).
Figure 2.

Changes in MEPs at time T after cTBS evaluated as [MEPs(T)-MEPs(pre-cTBS)] / MEPs(pre-cTBS) were MEPs(T) is the averaged peak-to-peak amplitude of the MEPs recorded in the batch of single-pulse TMS delivered at time 0, 5, 10, 20, 30 and 40 min after cTBS. Vertical bars represent standard error and stars represent statistical significance before (*) and after (**) correction for multiple comparisons.
Multi-regression between TEPs and MEPs
The amplitude of the four peaks of interest (P30, N45, P55 and N100) was extracted from the time-domain response of the EEG activity recorded at the electrode C3 over left M1 (grand-average) before and for different times after cTBS. Fig. 3 shows the changes in these peak amplitudes post-cTBS as compared to pre-cTBS. Because of the low number of trials, these peak amplitudes were only estimated at the group-level. Future studies are needed to assess the reliability of these TEPs modulations. A multi-regression analysis, aiming to estimate change in MEPs from changes in the TEPs was run, and the equation in Fig. 4 was obtained (mean squared error was below 0.005). Fig. 4 also shows the measured changes in MEPs amplitude after cTBS and the estimated changes in MEPs via the regression analysis. The model was reasonably able to approximate the modulation of MEPs after cTBS. The model revealed that the P30 TEPs were closest related to the MEPs, with both the MEPs and the P30s being inhibited after cTBS. However, individual TEPs could only explain up to 24% of the variance. On the other hand, combinations of TEPs were able to explain 77% of variance in the cTBS-induced modulation of MEPs.
Figure 3.

Changes in TEPs (P30, N45, P55 and N100) at time T after cTBS evaluated as [TEP(T)-TEP(pre-cTBS)] / TEP(pre-cTBS).
Figure 4.

Measured and estimated changes in MEPs amplitude after cTBS. The estimated MEPs were calculated from the weighted TEPs as described in the equation on top of the figure.
Oscillation induced by single-pulse TMS before and after cTBS
Fig. 5 shows the pattern of TMS-induced oscillations before and after cTBS (first line), as well as the difference between them (second line). Only statistically significant inductions of oscillations (first line) or statistically significant modulations of TMS-induced oscillations (second line) are plotted in non-green color (permutation test, p < 0.05). The TMS pulse induced oscillations over M1 in the entire frequency range examined in the present study (from 4 to 40 Hz). However, the exact pattern of induced oscillations was significantly modified by cTBS. Theta and alpha oscillations were significantly decreased at all the times measured after cTBS (up to more than 200 ms after the single-pulse, the maximum being around 60 ms), whereas high beta oscillations were significantly increased at T0, T20 and T40 (up to about 70 ms after the single-pulse, the maximum being around 25 ms).
Figure 5.
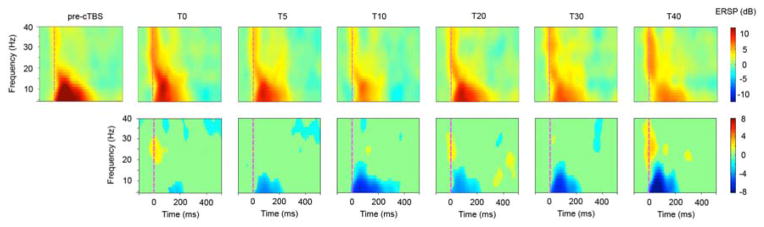
TMS-related spectrum perturbation (TRSP) recorded over the electrode C3, in log dB scale, before and after TMS (first line) and difference between the two times (TX – pre-cTBS, second line). Only significant data (p<0.05, permutation test) are displayed in non-green colors (non-grey color in the print version).
Resting, eyes-closed EEG before and after cTBS
Fig. 6A shows resting, eyes-closed EEG power spectrum pre-cTBS and at T30. Fig. 6B shows the average mean spectrum in each frequency bands, averaged for all subjects, at each time point. The two-way repeated-measures ANOVA showed a significant main effect of time (F(5,120)=2.65; p < 0.05), a significant main effect of frequency bands (F(3,120)=23.48; p < 0.0001), and a significant interaction between the two factors (F(15,120)=1.85; p < 0.05). Significant post-hoc Bonferroni’s tests showed that (i) power in theta and alpha bands were significantly higher that in low beta and high beta bands (p < 0.01) (ii) power in the high beta band at T20 and at T30 was significantly lower than pre-cTBS (p < 0.05). A similar analysis conducted on relative power (e.g. theta power / broad band from theta to high beta) gave similar results, except than in addition, the relative power in theta band at T30 was significantly higher than pre-cTBS (p < 0.001).
Figure 6.

Resting EEG during eyes-closed condition. A. Illustration of the power spectrum before cTBS and at T30. The frequency bands of interest are indicated below each segment. B. Averaged Power in each frequency band before and after cTBS.
Discussion
We found that the cTBS intervention induced the expected suppression of MEPs in our group of young adults. In addition, we found a relation between changes in MEPs and changes in several TEPs, revealing that cTBS-induced plasticity can be measured at the cortical level. Finally, cTBS also modified the spectral content of brain oscillations, as measured by modulations of TMS-induced oscillations and resting, eyes-closed EEG. In the following paragraphs we discuss the implications of these results for cTBS-based measures of plasticity.
cTBS induces the expected inhibition of MEPs
Traditional repetitive stimulation protocols are known to have a large inter-individual variability in the effects produced. This variability depends, among other factors, on the frequency and duration of stimulation (Maeda et al., 2000). Compared to traditional rTMS, the TBS protocols are attractive because short lasting and low intensity stimulation is generally sufficient to induce robust, although reversible, physiological aftereffects (Huang et al., 2005). In this study, we used a slightly modified paradigm of the cTBS protocol originally described by Huang et al. (2005), i.e. 50 Hz triplets repeated with a frequency of about 4.17 Hz instead of 5 Hz. We found qualitatively similar results, namely suppression of MEPs after cTBS to the motor cortex. There is a known variability in the exact duration of cTBS-induced inhibition. For example, Huang et al. (2005; 2007) described an inhibition lasting between 20 min and 1 hour (although the statistical significance was not directly assessed), whereas others reported effects shorter than 10 min (Gentner et al., 2008; Goldsworthy et al., 2012). In addition to intra- and inter-individual variability, it is known that subtle modifications of the cTBS protocol can influence its effect (for a review see Ridding & Ziemann, 2010). In particular, the stimulation frequencies appear to be important. For example, 30 Hz triplets repeated with a frequency of 6 Hz induced greater and longer-lasting effect than the standard 50 Hz triplets repeated with a frequency of 5 Hz (Goldsworthy et al., 2012). In summary, although our cTBS protocol might not have been the optimal, it was able to induce the expected suppression of MEPs (“inhibition”).
Modulations of MEPs modeled by modulation of TEPs
Finding a direct relationship between measures of modulation of cortico-spinal excitability, e.g. changes in MEPs, and measures of modulation of cortical excitability extracted from the EEG is challenging. Paus et al. (2001) found a correlation between the MEPs’ amplitude and the N100, the negative TEP recorded 100 ms after a single-pulse of TMS. However, this correlation was not found in other studies (e.g. Bender et al., 2005). Bonato et al (2006) also failed to find a correlation between MEPs and the N10, N18 or P30. Rather than trying to correlate MEPs with single TEPs, one might be more successful with combination of TEPs (i.e. the sum and subtraction of weighted TEPs’ value). For example, Maki and Ilmoniemi (2010) found a non-linear correlation between peak-to-peak N15-P30 and MEPs at the single trial levels.
The absence of any strong correlation between natural fluctuations of MEPs and TEPs is not surprising. Indeed the variability in MEPs may not only be related to the variability in cortical excitability, but also to the variability in the excitability of the spinal moto-neuron pools recruited by the cortical efferent volley induced by TMS. More successful correlation could thus be expected when comparing EEG and MEPs before and after an induction of plasticity at the cortical level (e.g. with rTMS, including the cTBS protocol presented here, or paired associative stimulation). Low frequency rTMS over M1 has been shown to induce a reduction of the N45 (Van der Werf & Paus, 2006) but no consistent change in MEP could be found. High frequency rTMS over M1 has been shown to increase both MEPs and global field power measures 15–55 ms after single pulse TMS (Esser et al., 2006). Finally, a decrease or increase of MEPs after LTD-like or LTP-like plasticity (paired-associative stimulation) has also been shown to correlate with global induced brain response in different areas (Huber et al., 2008). To our knowledge, the effects of TBS on TMS-evoked components recorded on the EEG have not been previously reported.
This study shows that cTBS-induced modulation of MEPs cannot be explained by the modulation of a single TEP. However, considering a combination of TEPs it is possible to account for a substantial amount of the cTBS-induced modulation of MEPs. The generators of the different TEPs after stimulation of M1 are unclear. Previous studies have shown that the P30 is distributed centrally (Paus et al., 2001) or shows major activation in the contralateral hemisphere, probably reflecting a spreading of brain activity via subcortical pathways (Bonato et al., 2006). The N40 (Bonato et al., 2006) or N45 (Paus et al., 2001; Komssi et al., 2004) forms a dipole centered over the stimulation site and might be caused by a resetting of ongoing rhythmic oscillations (Paus et al., 2001; Van Der Werf and Paus, 2006). The P55 (Komssi et al., 2004) or P60 (Bonato et al., 2006) is generally recorded over the stimulation site. The N100 exhibits a wide distribution with a slight predominance over central regions (Paus et al., 2001).
Our study shows that each component of the TMS-evoked response is differentially modulated by cTBS. The suppression of the MEPs seems to be better reflected by inhibition of the P30, consistent with the non-linear correlation between trial-by-trial peak-to-peak N15-P30 and MEPs described by Maki and Ilmoniemi (2010). Our results are also consistent with the study of Ferreri et al. (2011), where trial-by-trial MEPs show a positive correlation with P30 (although on contralateral electrodes where P30 was mainly recorded) and a negative correlation with N44 (equivalent to our N45). However, the other TEPs seem to also play a role. While there is still no clear understanding of the meaning of individual TEPs, our results demonstrate that a combination of the different TEPs, rather than a just one potential, appears to be important for the prediction of the MEPs amplitude.
In order to export measures of cTBS-induced plasticity outside the motor cortex, one might need to know in advance the coefficients linking the different TEPs with the estimated excitability. Given the small number of trials collected in each condition, the present study only allows group-level analysis (grand-average). Future studies, with a larger number of trials collected around the time points of interest, will be necessary to extend our observations to the individual level. Finally, as cTBS-induced plasticity is known to be altered by age or pathologies (Pascual-Leone et al., 2011), it is reasonable to expect that relationship between TEPs and MEPs will be population-dependent.
It has to be noted that some TEPs might not reflect direct brain response to TMS, but rather indirect potentials, such as auditory potentials evoked by the discharge click (Nikouline et al., 1999), or somatosensory potentials evoked by the contraction of the muscle (MEP). Concerning auditory-evoked potentials, the N100 component has particularly being associated with this physiological artifact. However, this same component is also task-dependent and has been associated with inhibitory processes (Bender et al., 2005; Bonnard et al., 2009; Spieser et al., 2010). Although we cannot rule out that in our study cTBS modulated auditory-evoked potentials, we consider it unlikely. On the contrary, it is possible that modulation of MEP size resulted in modulation of the associated somatosensory-evoked potentials. Future studies with subthreshold stimulation are needed to isolate primary brain response to TMS from afferent feedback from the target muscle.
Modulation of TMS-induced oscillations
We found that TMS over M1 induced oscillations before cTBS in the entire frequency range studied. These TMS-induced oscillations were modulated by cTBS. TMS-induced low frequencies (theta and alpha) decreased after cTBS while TMS-induced higher frequencies (high beta) tended to increase after cTBS. One cannot exclude that the early modulation of oscillations may be related to different efficiency of the artifact removal at different timing, but the later phase (e.g. >30 ms) is most probably related to physiological response.
Oscillations induced by TMS have been reported in previous studies. Paus et al. (2001) observed that single pulses over M1 induced a brief period of synchronized activity in the beta range within the vicinity of the stimulation site. Fuggetta et al. (2005) further observed that oscillations in the alpha and beta ranges were induced, for supra-threshold stimulation of M1, over the motor, premotor, and parietal cortex ipsilateral to the stimulation site. It was suggested that either the pulse activated “idling neurons” that began to oscillate with alpha and/or beta frequencies, or more probably, that the TMS pulse synchronized spontaneous activity of a population of neurons (resetting hypothesis, Paus et al., 2001; Fuggetta et al., 2005; Van der Werf & Paus, 2006), via a local (cortical) pacemaker or a thalamic pacemaker (Fuggetta et al., 2005). In addition, an alteration of inhibitory mechanisms might also play a role (Brignani et al., 2008). The oscillations induced by single-pulse TMS might be of physiological nature and reveal the “natural rhythms” of different regions (Rosanova et al., 2009). Indeed, when stimulated, each region tended to preserve its own natural frequency (alpha over the occipital cortex, beta over the parietal and fast beta /gamma over the frontal).
Based on these previous studies, we suggest that each single-pulse aligns the phase of active, but non-synchronized, oscillators (resetting hypothesis). Within this framework, two mechanisms can explain our results on the effect of cTBS. An increase (respectively a decrease) of TMS-induced oscillations after cTBS could reveal an increase (respectively a decrease) in the number of active oscillators at baseline (i.e. before the single-pulse TMS), while the percentage of synchronization between these oscillators remains unchanged. Alternatively, the same observation can be related to a decrease (respectively increase) of percentage of synchronization at baseline (i.e. before the single-pulse TMS) while the number of active oscillators remains unchanged (see Fig. 7). In other words, cTBS might affect the number of active oscillators without affecting their relative synchronization, or it might alter the relative synchronization of an unchanged number of oscillators. In fact, the hypothetical cTBS effects on the number of active oscillators and on the percentage of synchronization are not mutually exclusive, but as discussed below, the analysis on cTBS modulation of eyes-closed EEG provides evidence in support of the second scenario.
Figure 7.
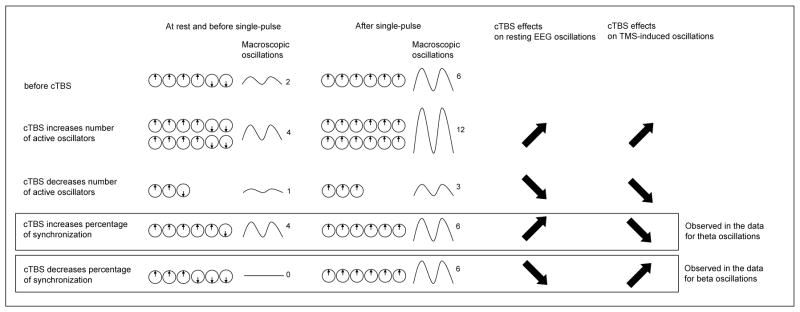
Schematic representation of the hypothetical effects of cTBS on neural oscillators. In this simple representation, oscillators can only be either in a 0° phase or in a 180° phase. In the example described, there are 6 active oscillators before the application of cTBS, 4 with a 0° phase and 2 with a 180° phase, given a macroscopic power of 2 (arbitrary value; line 1, column 1). A single-pulse of TMS is believed to align the phase of these oscillators. In this simple example, we assume that a single-pulse align the phase of all active oscillators, giving a power of 6 (line 1, column 2). Lines 2 to 5 describe the hypothetical cTBS mechanisms. The first hypothetical mechanism is that cTBS modulates the number of active oscillators without modifying the percentage of synchronization between active oscillators (lines 2 & 3). The second hypothetical mechanism is that cTBS modulates the percentage of synchronization between active oscillators without modifying the number of active oscillators (lines 4 & 5). These effects would be directly observed at rest (lines 2–5, column 1) and, by comparison with the pre-cTBS state (line 1, column 1), on the modulation of resting EEG oscillations (lines 2–5, column 3). Then, keeping the assumption that a single-pulse aligns the phase of all active oscillators, we will observe the after single-pulse states described in column 2. The modulation of TMS-induced oscillations (lines 2–5, column 4) can be obtained by comparing the TMS-induced oscillations (lines 2–5, column 2 minus 1) for each hypothesis with pre-cTBS induced oscillations (line 1, column 2 minus 1). The data presented in this study favor the hypothesis that cTBS increases the percentage of synchronization between theta oscillators and decreases the percentage of synchronization between beta oscillators.
Modulation of resting EEG
We found that cTBS tends to decrease power in the high beta band, and relatively increases power in theta band during eyes-closed resting. Although EEG doesn’t allow the precise determination of the localization of rhythmic generators, the cortical origin of beta rhythms is largely admitted and previous studies on animals have suggested that pyramidal neurons in the neocortex are able to sustain alpha/theta rhythmic firing activities (Silva et al., 1991). A recent TMS study in animals shows that intermittent TBS (iTBS) increased the gamma power of the EEG, while cTBS had no significant effect in any of the principal EEG bands (Benali et al., 2011). McAllister et al. (2011) also found an absence of cTBS-modulation of the power spectrum recorded over the stimulated M1 during eyes-opened resting, in humans. However, this study only recorded resting EEG up to 10 min, whereas we found significant modulation of resting EEG after 20 min. On the contrary, Noh et al. (2012) observed that cTBS increased the power in theta and low beta bands over the stimulated M1 during eyes-opened resting, these effects lasting longer than the modulation of MEPs. In addition, they found an increase in high beta band at rest over the frontal electrodes. It has to be noted than in our study, recordings were performed with eyes-closed whereas the studies above were performed with eyes opened. Moreover, Noh et al. (2012) used a shorter version of cTBS (300 pulses) whereas we used 600 pulses as in the original protocol introduced by Huang et al. (2005). The shorter version of cTBS has been shown to induce facilitation of MEPs instead of inhibition (Gentner et al., 2008). However Noh et al. (2012) reported an inhibition of MEPs, probably related to the muscular activation performed during the measurement of AMT (see Gentner et al., 2008). These methodological discrepancies might account for the different results observed across studies.
Once more, two mechanisms could explain our results. An increase (respectively a decrease) in power after cTBS could be related to an increase (respectively a decrease) of the number of active oscillators, while the synchronization between these oscillators remained constant. Alternatively, our findings could be related to an increase (respectively a decrease) in phase alignment between these oscillators, while the number of active oscillators remained constant. Combined with our results on cTBS-induced modulation of TMS-induced oscillations, our results favor the second explanation.
We propose that cTBS acts primarily on already active oscillators, aligning the phase of low frequency oscillators while desynchronizing active high frequency oscillators. This effect results in an increase of resting theta oscillations combined with a decrease in TMS-induced theta oscillations. Similarly it leads to a decrease of resting beta oscillations combined with an increase in TMS-induced beta oscillations (see Fig. 7). Thus, this slowing of frequencies could constitute a marker of cortical inhibition after cTBS.
The effects of cTBS are system-dependent
The plasticity induced by TBS shares properties with LTP and LTD mechanisms of synaptic efficacy (Huang et al., 2005), but the exact mechanisms in humans remain largely unknown. The cortical origin of the cTBS effects on M1 has been shown with the modulation, in patients with implanted electrodes, of indirect I1-waves evoked by single-pulse TMS after cTBS (DiLazzaro et al., 2005). While the direct D-wave recorded in the pyramidal tract is the result of direct activation of corticospinal axons, later I-waves reflect synchronous activity originated from trans-synaptic activation of cortical neurons. However, the fact that I-waves are modified by TBS does not proof that changes in synaptic plasticity are solely involved. Several studies have pointed toward the role of NMDA or GABA modulation; others have suggested a change in the expression of immediate early genes proteins (for a review, see Cardenas-Morales et al., 2010). The hypothetical LTP and LTD effects of TBS are based on studies describing the induction of LTP in the rodent motor cortex or hippocampus; however, direct evidence in humans is still lacking. In this context, the combination of TMS with EEG offers new insights. Our results suggest that the effects of cTBS protocols, i.e. gamma rhythms triplets repeated at a theta rhythm, are not uniform across different population of neurons. Moreover, the timing of response to cTBS might be specific to each system. Similar to Noh et al. (2012), we found that the effects on oscillations can be detected later than the effects on MEPs. Future studies will need to explore why modulation of oscillations are delayed compared to modulation of MEPs. To summarize, systems-level effects involving cortical oscillators need to be considered when evaluating the TBS effects.
Conclusion
Using real-time integration of TMS and EEG, we provide novel insights on the neural substrate of the effects of cTBS. We found that cTBS modulates TEPs, but also resting oscillations and TMS-induced oscillations, with opposite effects between cortical theta and beta oscillators. This suggests that the effects of TBS involve a complex, systems-level impact of TMS on brain function. Furthermore, it should be noted that the time courses of all these TMS-induced modulations (MEPs, EEG after single-pulse TMS, EEG at rest) are different, which suggests that cTBS effects last longer than one can expect from MEP recordings. Future studies are needed to examine these observations at the individual level (for TEPs) and with populations from a different age-range. If confirmed, TMS-induced potentials and oscillations might be useful tools to explore plasticity of areas outside the motor cortex where no MEPs can be recorded.
Acknowledgments
This work was supported in part by grants from CIMIT (Dr. Pascual-Leone), the National Center for Research Resources: Harvard Clinical and Translational Science Center (UL1 RR025758). Dr. Pascual-Leone serves on the scientific advisory boards for Nexstim, Neuronix, Starlab Neuroscience, Neosync, and Novavision, and is a listed inventor on issued and pending patents on the real-time integration of transcranial magnetic stimulation (TMS) with electroencephalography (EEG) and magnetic resonance imaging (MRI). Dr. Vernet was supported by the Fyssen Foundation (France). Dr. Yoo was supported by a National Research Foundation of Korea grant funded by the Korean Government MEST, Basic Research Promotion Fund (NRF-013-2010-1-E00018). The authors thank Ilan Mizrahi for his participation during data acquisition, and Andrea Vatulas, Cara Burzynski and Ann Connor for their administrative support. The authors also wish to thank the two anonymous Reviewers for their valuable comments, which helped us improve the manuscript.
Abbreviations
- AMT
active motor threshold
- cTBS
continuous theta-burst stimulation
- EEG
electroencephalography
- EMG
electromyography
- EOG
electrooculogram
- FDI
first dorsal interosseus
- FFT
fast Fourier transformation
- ICA
independent component analysis
- iTBS
intermittent theta-burst stimulation
- LTD
long-term depression
- LTP
long-term potentiation
- M1
primary motor cortex
- MEPs
motor-evoked potentials
- MMSE
Mini Mental State Examination
- RMT
resting motor threshold
- TBS
theta-burst stimulation
- TMS
transcranial magnetic stimulation
- TRSP
TMS-related spectrum perturbation
References
- Benali A, Trippe J, Weiler E, Mix A, Petrasch-Parwez E, Girzalsky W, Eysel UT, Erdmann R, Funke K. Theta-burst transcranial magnetic stimulation alters cortical inhibition. J Neurosci. 2011;31:1193–1203. doi: 10.1523/JNEUROSCI.1379-10.2011. [DOI] [PMC free article] [PubMed] [Google Scholar]
- Bender S, Basseler K, Sebastian I, Resch F, Kammer T, Oelkers-Ax R, Weisbrod M. Electroencephalographic response to transcranial magnetic stimulation in children: Evidence for giant inhibitory potentials. Ann Neurol. 2005;58:58–67. doi: 10.1002/ana.20521. [DOI] [PubMed] [Google Scholar]
- Bonato C, Miniussi C, Rossini PM. Transcranial magnetic stimulation and cortical evoked potentials: a TMS/EEG co-registration study. Clin Neurophysiol. 2006;117:1699–1707. doi: 10.1016/j.clinph.2006.05.006. [DOI] [PubMed] [Google Scholar]
- Bonnard M, Spieser L, Meziane HB, de Graaf JB, Pailhous J. Prior intention can locally tune inhibitory processes in the primary motor cortex: direct evidence from combined TMS-EEG. Eur J Neurosci. 2009;30:913–923. doi: 10.1111/j.1460-9568.2009.06864.x. [DOI] [PubMed] [Google Scholar]
- Brignani D, Manganotti P, Rossini PM, Miniussi C. Modulation of cortical oscillatory activity during transcranial magnetic stimulation. Hum Brain Mapp. 2008;29:603–612. doi: 10.1002/hbm.20423. [DOI] [PMC free article] [PubMed] [Google Scholar]
- Cardenas-Morales L, Nowak DA, Kammer T, Wolf RC, Schonfeldt-Lecuona C. Mechanisms and applications of theta-burst rTMS on the human motor cortex. Brain Topogr. 2010;22:294–306. doi: 10.1007/s10548-009-0084-7. [DOI] [PubMed] [Google Scholar]
- Delorme A, Makeig S. EEGLAB: an open source toolbox for analysis of single-trial EEG dynamics including independent component analysis. J Neurosci Methods. 2004;134:9–21. doi: 10.1016/j.jneumeth.2003.10.009. [DOI] [PubMed] [Google Scholar]
- Di Lazzaro V, Pilato F, Saturno E, Oliviero A, Dileone M, Mazzone P, Insola A, Tonali PA, Ranieri F, Huang YZ, Rothwell JC. Theta-burst repetitive transcranial magnetic stimulation suppresses specific excitatory circuits in the human motor cortex. J Physiol. 2005;565:945–950. doi: 10.1113/jphysiol.2005.087288. [DOI] [PMC free article] [PubMed] [Google Scholar]
- Esser SK, Huber R, Massimini M, Peterson MJ, Ferrarelli F, Tononi G. A direct demonstration of cortical LTP in humans: a combined TMS/EEG study. Brain Res Bull. 2006;69:86–94. doi: 10.1016/j.brainresbull.2005.11.003. [DOI] [PubMed] [Google Scholar]
- Ferreri F, Pasqualetti P, Maatta S, Ponzo D, Ferrarelli F, Tononi G, Mervaala E, Miniussi C, Rossini PM. Human brain connectivity during single and paired pulse transcranial magnetic stimulation. Neuroimage. 2011;54:90–102. doi: 10.1016/j.neuroimage.2010.07.056. [DOI] [PubMed] [Google Scholar]
- Fitzgerald PB. TMS-EEG: a technique that has come of age? Clin Neurophysiol. 2010;121:265–267. doi: 10.1016/j.clinph.2009.11.012. [DOI] [PubMed] [Google Scholar]
- Fuggetta G, Fiaschi A, Manganotti P. Modulation of cortical oscillatory activities induced by varying single-pulse transcranial magnetic stimulation intensity over the left primary motor area: a combined EEG and TMS study. Neuroimage. 2005;27:896–908. doi: 10.1016/j.neuroimage.2005.05.013. [DOI] [PubMed] [Google Scholar]
- Gentner R, Wankerl K, Reinsberger C, Zeller D, Classen J. Depression of human corticospinal excitability induced by magnetic theta-burst stimulation: evidence of rapid polarity-reversing metaplasticity. Cereb Cortex. 2008;18:2046–2053. doi: 10.1093/cercor/bhm239. [DOI] [PubMed] [Google Scholar]
- Goldsworthy MR, Pitcher JB, Ridding MC. A comparison of two different continuous theta burst stimulation paradigms applied to the human primary motor cortex. Clin Neurophysiol. 2012;123:2256–2263. doi: 10.1016/j.clinph.2012.05.001. [DOI] [PubMed] [Google Scholar]
- Huang YZ, Chen RS, Rothwell JC, Wen HY. The after-effect of human theta burst stimulation is NMDA receptor dependent. Clin Neurophysiol. 2007;118:1028–1032. doi: 10.1016/j.clinph.2007.01.021. [DOI] [PubMed] [Google Scholar]
- Huang YZ, Edwards MJ, Rounis E, Bhatia KP, Rothwell JC. Theta burst stimulation of the human motor cortex. Neuron. 2005;45:201–206. doi: 10.1016/j.neuron.2004.12.033. [DOI] [PubMed] [Google Scholar]
- Huber R, Maatta S, Esser SK, Sarasso S, Ferrarelli F, Watson A, Ferreri F, Peterson MJ, Tononi G. Measures of cortical plasticity after transcranial paired associative stimulation predict changes in electroencephalogram slow-wave activity during subsequent sleep. J Neurosci. 2008;28:7911–7918. doi: 10.1523/JNEUROSCI.1636-08.2008. [DOI] [PMC free article] [PubMed] [Google Scholar]
- Komssi S, Kahkonen S. The novelty value of the combined use of electroencephalography and transcranial magnetic stimulation for neuroscience research. Brain Res Rev. 2006;52:183–192. doi: 10.1016/j.brainresrev.2006.01.008. [DOI] [PubMed] [Google Scholar]
- Komssi S, Kahkonen S, Ilmoniemi RJ. The effect of stimulus intensity on brain responses evoked by transcranial magnetic stimulation. Hum Brain Mapp. 2004;21:154–164. doi: 10.1002/hbm.10159. [DOI] [PMC free article] [PubMed] [Google Scholar]
- Maeda F, Keenan JP, Tormos JM, Topka H, Pascual-Leone A. Interindividual variability of the modulatory effects of repetitive transcranial magnetic stimulation on cortical excitability. Exp Brain Res. 2000;133:425–430. doi: 10.1007/s002210000432. [DOI] [PubMed] [Google Scholar]
- Maki H, Ilmoniemi RJ. The relationship between peripheral and early cortical activation induced by transcranial magnetic stimulation. Neurosci Lett. 2010;478:24–28. doi: 10.1016/j.neulet.2010.04.059. [DOI] [PubMed] [Google Scholar]
- McAllister SM, Rothwell JC, Ridding MC. Selective modulation of intracortical inhibition by low-intensity Theta Burst Stimulation. Clin Neurophysiol. 2009;120:820–826. doi: 10.1016/j.clinph.2009.02.003. [DOI] [PubMed] [Google Scholar]
- McAllister SM, Rothwell JC, Ridding MC. Cortical oscillatory activity and the induction of plasticity in the human motor cortex. Eur J Neurosci. 2011;33:1916–1924. doi: 10.1111/j.1460-9568.2011.07673.x. [DOI] [PubMed] [Google Scholar]
- Miniussi C, Thut G. Combining TMS and EEG offers new prospects in cognitive neuroscience. Brain Topogr. 2010;22:249–256. doi: 10.1007/s10548-009-0083-8. [DOI] [PubMed] [Google Scholar]
- Nikouline V, Ruohonen J, Ilmoniemi RJ. The role of the coil click in TMS assessed with simultaneous EEG. Clin Neurophysiol. 1999;110:1325–1328. doi: 10.1016/s1388-2457(99)00070-x. [DOI] [PubMed] [Google Scholar]
- Noh NA, Fuggetta G, Manganotti P, Fiaschi A. Long lasting modulation of cortical oscillations after continuous theta burst transcranial magnetic stimulation. PLoS One. 2012;7:e35080. doi: 10.1371/journal.pone.0035080. [DOI] [PMC free article] [PubMed] [Google Scholar]
- Pascual-Leone A, Freitas C, Oberman L, Horvath JC, Halko M, Eldaief M, Bashir S, Vernet M, Shafi M, Westover B, Vahabzadeh-Hagh AM, Rotenberg A. Characterizing Brain Cortical Plasticity and Network Dynamics Across the Age-Span in Health and Disease with TMS-EEG and TMS-fMRI. Brain Topogr. 2011;24:302–315. doi: 10.1007/s10548-011-0196-8. [DOI] [PMC free article] [PubMed] [Google Scholar]
- Paus T, Sipila PK, Strafella AP. Synchronization of neuronal activity in the human primary motor cortex by transcranial magnetic stimulation: an EEG study. J Neurophysiol. 2001;86:1983–1990. doi: 10.1152/jn.2001.86.4.1983. [DOI] [PubMed] [Google Scholar]
- Ridding MC, Ziemann U. Determinants of the induction of cortical plasticity by non-invasive brain stimulation in healthy subjects. J Physiol. 2010;588:2291–2304. doi: 10.1113/jphysiol.2010.190314. [DOI] [PMC free article] [PubMed] [Google Scholar]
- Rosanova M, Casali A, Bellina V, Resta F, Mariotti M, Massimini M. Natural frequencies of human corticothalamic circuits. J Neurosci. 2009;29:7679–7685. doi: 10.1523/JNEUROSCI.0445-09.2009. [DOI] [PMC free article] [PubMed] [Google Scholar]
- Rossi S, Hallett M, Rossini PM, Pascual-Leone A. Safety, ethical considerations, and application guidelines for the use of transcranial magnetic stimulation in clinical practice and research. Clin Neurophysiol. 2009;120:2008–2039. doi: 10.1016/j.clinph.2009.08.016. [DOI] [PMC free article] [PubMed] [Google Scholar]
- Rossini PM, Barker AT, Berardelli A, Caramia MD, Caruso G, Cracco RQ, Dimitrijevic MR, Hallett M, Katayama Y, Lucking CH, Maertens de Noordhout AL, Marsden CD, Murray NMF, Rothwell JC, Swash M, Tomberg C. Non-invasive electrical and magnetic stimulation of the brain, spinal cord and roots: basic principles and procedures for routine clinical application. Report of an IFCN committee. Electroencephalogr Clin Neurophysiol. 1994;91:79–92. doi: 10.1016/0013-4694(94)90029-9. [DOI] [PubMed] [Google Scholar]
- Silva LR, Amitai Y, Connors BW. Intrinsic oscillations of neocortex generated by layer 5 pyramidal neurons. Science. 1991;251:432–435. doi: 10.1126/science.1824881. [DOI] [PubMed] [Google Scholar]
- Spieser L, Meziane HB, Bonnard M. Cortical mechanisms underlying stretch reflex adaptation to intention: a combined EEG-TMS study. Neuroimage. 2010;52:316–325. doi: 10.1016/j.neuroimage.2010.04.020. [DOI] [PubMed] [Google Scholar]
- Van Der Werf YD, Paus T. The neural response to transcranial magnetic stimulation of the human motor cortex. I. Intracortical and cortico-cortical contributions. Exp Brain Res. 2006;175:231–245. doi: 10.1007/s00221-006-0551-2. [DOI] [PubMed] [Google Scholar]
- Virtanen J, Ruohonen J, Naatanen R, Ilmoniemi RJ. Instrumentation for the measurement of electric brain responses to transcranial magnetic stimulation. Med Biol Eng Comput. 1999;37:322–326. doi: 10.1007/BF02513307. [DOI] [PubMed] [Google Scholar]