Abstract
A critical constraint in the design of appropriate medical devices for the lowest-resource settings is the lack of access to maintenance or repair on instrumentation. There are numerous point-of-care applications for which quantitative readout would have clinical utility. Thus, a challenge to the device developer is to enable quantitative device readout in an equipment-free model that is appropriate for use in even the lowest-resource settings. Paper microfluidics has great potential for enabling equipment-free devices that are very low-cost, operable by minimally-trained users, and provide quantitative readout. The focus of this critical review is to describe the work, starting several decades ago and continuing to the present, to enable assays with quantitative readout in a fully-disposable device.
Introduction
Paper microfluidics is a rapidly growing subfield of microfluidics that makes use of paper-like porous materials to create devices. A significant advantage of the use of porous materials is the potential for very low-cost, fully-disposable devices that are suitable for use in low-resource settings. Porous materials utilize capillary flow, so there is no need for instrumentation for pumping fluids through the device. Additionally, porous materials such as cellulose and nitrocellulose are lower cost than materials that have traditionally been used in microfluidic devices, e.g., silicon. Further, paper microfluidics can build upon the established technology base of conventional lateral flow tests (LFTs) that have for decades been the standard bioassay format for low-resource settings. Lateral flow tests can be affordable, user-friendly, rapid, equipment-free, and deliverable to the user, thus fulfilling a number of the characteristics of the ASSURED standard set by the World Health Organization1. However, conventional LFTs have multiple limitations such as (i) being difficult to multiplex for the detection of multiple analytes from a single biosample, (ii) relatively low sensitivity, and (iii) an inability to provide quantitative output without a dedicated reader. Paper microfluidics has the potential to address each of these deficiencies of LFTs. Regarding work to address the first two limitations, Martinez et al.2 reviewed extensive early work on the multi-analyte capability of paper-based tests and Byrnes et al.3 recently described work to enable automatic multi-step sample processing for increased sensitivity in paper microfluidics. Regarding work to address the third limitation, there have been multiple reviews describing the use of non-dedicated mobile phones to enable quantitative output in paper-based tests (most notably by Yetisen et al.4). The use of non-dedicated cell and smart phones as readers for high-quality quantitative output is promising, but there are still multiple challenges that need to be addressed before their use in the lowest-resource settings is realized3. Thus, the focus of this critical review is on the topic of enabling quantitative readout in an equipment-free model of device development.
The need for quantitative readout
There are multiple health applications where quantitative readout would be useful in a point-of-care (POC) assay. Generally, quantitative readout has value in cases where appropriate clinical actions depend on distinguishing between normal and abnormal levels of a biomarker in a patient sample. One scenario is screening for individuals that have a disease or condition characterized by biomarker levels elevated above a normal range. For example, C-reactive protein (CRP) is a biomarker for inflammation that has predictive value for heart disease5 and bacterial infection6. Another scenario is frequent monitoring of the level of a biomarker or drug in a patient to inform therapy. For example, therapeutic drug monitoring in patients with epilepsy7 or asthma8 may be used to improve individual dosing. The drugs used for controlling the symptoms of these diseases have adverse side effects on patient health, which can impair daily activities and lead to decreased quality of life. Real-time correlation of the concentration of the drug in the patient with disease symptoms and the degree of adverse drug side effects could be useful information to have in order to optimally dose an individual. Other examples include quantifying the viral load in patients with HIV for monitoring the effectiveness of drug therapy9 and the well-known case of blood glucose testing in patients with diabetes to maintain appropriate glucose levels10. These are a few example applications for which quantitative readout has clinical utility, and for which an equipment-free device would be required in the lowest-resource settings.
Though there are numerous applications that require some level of quantitative test readout, the quantitative resolution and dynamic range that is required for a given application will vary. For example, an effective screening test for CRP may only require a low quantitative resolution, e.g., a course-grained output of CRP levels in “normal”, “mid-level”, and “high” ranges. In contrast, a monitoring test for therapeutic drug levels may require a higher degree of quantitative resolution to achieve the optimal drug regimen for a patient. Regarding dynamic range, a test for HIV viral load monitoring may require a much larger dynamic range than for another application such as CRP detection. In POC devices, as with lab-based assays, both the quantitative resolution and the dynamic range achievable by a quantitative assay need to be tailored to the application.
Quantitative readout in an equipment-free model
There has been considerable effort dedicated to the development of equipment-free quantitative readout in the context of POC bioassays. Relevant to this, Phillips et al.11 reviewed the development of quantitative POC assays from a materials science perspective, describing a small subset of more recent work. The goal of this review is to provide a more comprehensive picture of the approaches that can be used to achieve quantitative readout in a fully-disposable device without the use of any instrumentation. These approaches, shown schematically in Figure 1, can be divided into four categories based on the type of assay readout; intensity-based or hue-based readout, direct distance-based readout, ladder-bar readout, and time-based readout. These approaches are discussed in the following sections in the context of specific demonstrations. In addition, potential advantages and disadvantages are provided in order to inform considerations when deciding on the suitability of an approach for a given application. Finally, next steps toward realizing equipment-free quantitative assays in the field are discussed.
Figure 1.
Schematic of the main approaches that have been used to enable robust quantitative readout without any instrumentation.
Intensity-based or hue-based readout
One approach to achieving quantitative readout is to use differences in intensities13 or hues within the detection region of the assay. The simplest implementation of this approach is to include an instruction card depicting signal intensity standards for a concentration series of the analyte that the user can use to identify the sample concentration. Two critical issues that could affect the accuracy of this simple implementation scenario are user variability in interpretation of intensity differences and differences in environmental conditions at the test sites compared to the location where the standards were generated. This section describes work to address these two issues to achieve quantitative intensity-based or hue-based measurements.
Dungchai et al.12 used multiple colorimetric indicators for a single analyte to create a quantitative readout based on hue and intensity in a paper-based assay. Their device consisted of a series of radial detection regions about the centrally located source. For the analyte glucose, five indicators were patterned over four detection regions in various combinations to distinguish between four concentration ranges of glucose. Figure 2 shows example results for two different glucose concentrations in serum. Comparison of the multi-indicator system to a single indicator system, in a pilot study of N=10 untrained individuals performing the tests, showed an increase in accuracy of test results from 85% to 95%. These results also indicated the potential for increasing the quantitative resolution of an assay through the use of multiple indicators. Multiplexed target detection was also demonstrated with the additional analytes lactate and uric acid.
Figure 2.
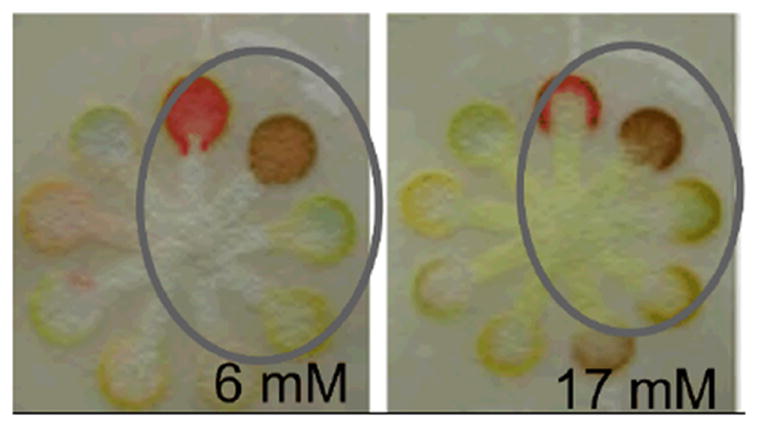
Quantitative readout using multiple colorimetric indicators. The circled region in each panel contains the intensity-based and hue-based results for the glucose concentration specified. The image is adapted from Dungchai et al.12, Copyright (2010), with permission from Elsevier.
Wang et al.14 demonstrated quantitative readout in a tree-shaped paper assay using on-device calibrators. In their model assay for albumin, the detection reagent was spotted upstream of a known calibrator or the unknown concentration of sample in each of the seven “branches” of the tree. The “trunk” of the tree was then submerged into water and the color change in the detection region of each branch was read by eye. Their results indicated that a set of calibrators could be used to bracket the concentration of an unknown sample. The authors stressed the advantage of on-device calibrators in controlling for differences in temperature, humidity, and pressure among test locations, although this was not explicitly addressed.
Zhu et al.15 extended this work to an enzyme-based system for the detection of glucose in serum. In their assay, hydrogen peroxide generated via the reaction of glucose and glucose oxidase was used in a second enzyme-based reaction between horseradish peroxidase and a substrate to create a colored product. Either a calibrator or the sample was spotted upstream of the detection reagents and all of the reagents were brought into contact by submerging the trunk of their paper tree-shaped assay into water. An example assay is shown in Figure 3. The authors suggested that a simple Y-structure, consisting of one calibrator per sample could be used for a device intended for visual readout. Though this might be suitable for a rough categorization of “low” versus “high” levels, the straightforward incorporation of additional calibrators could enable higher quantitative resolution even in a scenario of simple visual interpretation.
Figure 3.
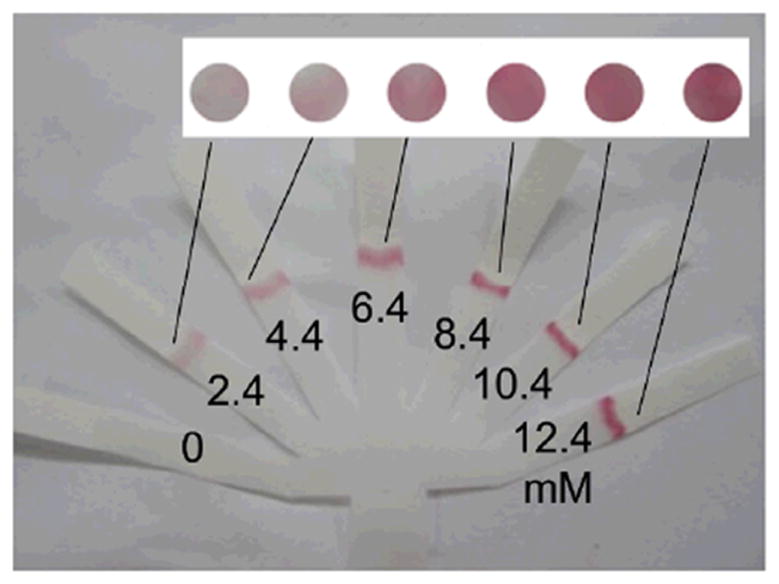
Quantitative readout using real-time calibration in a tree-shaped paper device. The concentration of hydrogen peroxide corresponding to the result in each branch of the assay is specified. The image is adapted from Zhu et al.15, Copyright (2014), with permission from Elsevier.
Most notably, Pollock et al. have developed a quantitative test for the detection of alanine aminotransferase (ALT) to monitor patients with HIV and tuberculosis for medication-induced damage to the liver. After initial demonstration of the test to produce visual readout in three concentration ranges with greater than 90% accuracy16, a comprehensive field evaluation of the test was performed17. Instead of incorporating on-device calibrators to address the issue of varying test signal development under different environmental operating conditions, the ALT test utilized a different read time depending on the ambient temperature range measured (i.e., 18 min for 20-24°C, 14 min for 25-29°C, 12 min for 30-33°C, and 10 min for 34-37°C). The study demonstrated the feasibility of training local nurses to perform the test in a point-of-care clinical setting with 84% accuracy in interpreting the readout (96% agreement between operators) and identified further work to optimize the test. The study also provided a clear discussion of the issues relevant to designing the ALT test for the intended operators and settings.
As shown by the work discussed in this section, intensity-based and hue-based assays have the potential for robust quantitative readout. Two strategies for addressing the issue of variable test results in operating environments with different temperature and humidity levels have been demonstrated as feasible. A significant advantage of on-device calibrators is the potential to maintain test operation simplicity and have utility in the lowest-resource settings where minimal user training is assumed. However, the disadvantage is added complexity of the device. A significant advantage to the alternative strategy of requiring different “read” times for interpretation of a test in different operating environments is that device complexity and cost are minimized. However, a disadvantage to this strategy is added complexity to user steps, including a temperature measurement and interpretation of the test at a precise time. Further, the higher level of training required for test operators may limit the use of the test to higher-resource clinical settings. More generally, potential disadvantages of the intensity-based or hue-based readout are that interpretation of the assay results can be complex for applications that require a higher level of quantitative resolution and hue-based readout would be problematic for color-blind individuals.
Direct distance-based readout
Another approach that has potential for quantitative readout relies on the spatial distribution of signal in a region. Specifically, a capture or other species required for detection is deposited in an extended region along the direction of flow. The visible signal develops along the length of the detection region, for example, in proportion to the concentration of analyte in the sample. The user can match the distance over which the visible signal extends to the marks on a preprinted “concentration” ruler within the detection region, to identify the concentration of analyte in the sample. Multiple examples of distance-based readout in the context of paper-based devices are described below.
Zuk et al.18 first reported on a distance-based readout in a competition format immunoassay for theophylline detection in 1985. The assay protocol consisted of the following steps: analyte in the sample was applied to the test strip, complex of analyte conjugated to a label was rehydrated by the sample as the sample traveled downstream, analyte and complex competed for capture antibody sites within the detection region, and the detection region was exposed to enzyme substrate and generated colored product in the regions of surface-bound labeled complex. For low concentrations of analyte, the labeled complex encountered many free capture antibody sites and was localized to the upstream region of the detection region only, while for high concentrations of analyte, the analyte competed effectively for capture antibody such that labeled complex was exposed to and bound to downstream regions, as well as upstream regions of the detection region. The result was an increasing distance in which bound label was localized, and in which colored product was generated, for increasing analyte concentration. The time-to-result for their assay, starting with a whole blood sample, was less than 15 minutes.
Subsequently, Vaughan et al.19 reported on the evaluation of this paper-based device, shown in Figure 4, for the therapeutic monitoring of theophylline in patients with chronic asthma. Their investigation indicated that the paper-based test agreed well with hospital laboratory reference methods for theophylline quantification within the clinically relevant range for theophylline in blood, with coefficients of variation of less than 12% for the device. Subsequently, Chen et al.20 extended this method, demonstrating a variant of the original assay that required only one user step. In their implementation, a one-step delivery of all the required species for binding and color generation was enabled by chemically delaying the color generation reaction until the flow and binding steps were completed.
Figure 4.
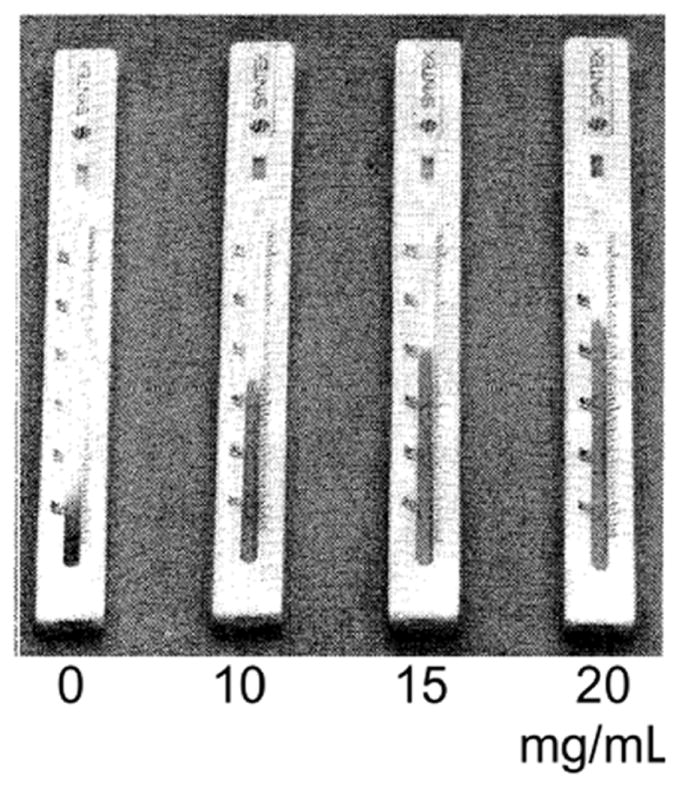
Direct distance-based measurement demonstrated for quantitative theophylline detection. The image is adapted from The Lancet, Vaughan et al.19, Copyright (1986), with permission from Elsevier.
In addition to antibody-based assays, enzyme-based systems have been investigated in the context of equipment-free, distance-based readout. Allen et al.21 demonstrated the quantitative, enzyme-based detection of plasma cholesterol. In their assay, hydrogen peroxide generated from the interaction of cholesterol with cholesterol oxidase, traveled downstream with the enzyme horseradish peroxidase and reacted with enzyme substrate immobilized in the detection region. Colored product was produced in proportion to the original concentration of cholesterol in the sample. The assay, demonstrated in the range of 150 to 450 mg/dL cholesterol, was shown to have a high level of accuracy and precision, with coefficients of variation of less than 6%. This same approach was applied to the detection of high-density lipoprotein by Liu et al.22. The authors demonstrated quantitative detection between 25–75 mg/dL from plasma.
More recently, Cate et al.23 revisited distance-based detection using enzymatic reactions for the detection of glucose. In their assay, glucose oxidase, horseradish peroxidase, and the horseradish peroxidase substrate diaminobenzidine were deposited in the detection region of the assay. Glucose in the sample reacted with glucose oxidase to create hydrogen peroxide; hydrogen peroxide then reacted with horseradish peroxidase and its substrate to create a distance-dependent column of brown precipitate along the detection region. Cate et al. also explored distance-based detection using metal complexation and nanoparticle aggregation, for nickel and glutathione, respectively.
Most recently, Nilghaz et al.24 extended distance-based detection to thread-based assays. In their assay format, a colorimetric indicator for the analyte of interest was applied to the thread. The total length of color development in the thread was linearly related to the concentration of analyte in the sample. This result was consistent with a scenario in which colorimetric product was generated in a concentration proportional to the analyte concentration, and was then adsorbed or absorbed to the fibers in the thread in a concentration proportional to the concentration of colorimetric product. Thread-based assays for three analytes, total protein, nitrite, and nickel were demonstrated.
The work described in this section demonstrated distance-based assays for a variety of target analytes. A significant advantage of distance-based assays is their potential for high quantitative resolution. Specifically, distance-based readout is inherently less susceptible to user interpretation error than intensity-based or hue-based readout. However, a next step to achieving robust distance-based measurements over a wide range of environmental operating conditions is to incorporate on-device calibrators. A consideration in creating distance-based readout is that Washburn flow will result in decreasing flow rate and increasing interaction times for increasing downstream distances. Thus, assay design parameters such as the capture density of species within the detection region and the sequence of reagent delivery must be chosen to produce the desired dynamic range and quantitative resolution for a given application.
Ladder-bar readout
A variation of directly reading distance to quantify the levels of analyte in the sample is counting the number of discrete detection subregions in which signal has developed. In the “ladder-bar” or “radial-bar” readout, a capture or detection species is deposited in multiple subregions, or bars, that are sequentially exposed to sample flow. The number of bars in which signal is visible at the end of the assay is related to the analyte concentration. The user can refer to an instruction card to translate the number of visible bars to an analyte concentration range. Several examples of ladder-bar assays in the context of conventional lateral flow tests and more recent extensions are described in this section.
Lou et al.25 first reported on a ladder-bar approach for a competition format immunoassay for lipoprotein(a). In their assay, analyte-specific antibody was patterned in bands perpendicular to flow within the detection region. Their assay protocol consisted of the following steps: analyte in the sample was applied to the test strip and flowed downstream, a complex of analyte conjugated to a label was rehydrated with sample, and both the analyte and complex competed for capture antibody sites patterned within bands in the detection region. The authors demonstrated the ability to distinguish four concentration ranges of lipoprotein(a), less than 40 mg/dL, 40 to 70 mg/dL, 70 to 120 mg/dL, and 120 to 180 mg/dL. A pilot investigation of 29 clinical samples were tested and showed a 98% agreement between the ladder-bar assay results and those from an ELISA for lipoprotein(a).
Buhrer-Sekula et al.26 also reported on a competition immunoassay using multiple capture regions for the quantitative detection of neoptin, a biomarker for inflammation. However, their assay response differed significantly from that of Lou et al. In the assay of Buhrer-Sekula et al., competition between the analyte in the sample and a labeled competitor for binding sites within 3 sequential capture bands in the detection region produced signal that was inversely proportional to the concentration of neoptin in the sample. Specifically, both the number of bands that were visible and the amount of label in the bands increased for decreasing concentrations of neoptin. An estimate of the analyte concentration could be made by correlation of the band pattern to the best match among one of 6 standards run at the same time. Though this specific demonstration showed some promise for use in higher-resource settings (in which users with some training and access to facilities could reproducibility run standards in parallel with unknowns and interpret the results), additional assay optimization would be needed to achieve increased sensitivity, i.e., to improve the reported 77% correlation of test results with the results of a competition ELISA.
Leung et al.27 applied the ladder-bar approach to a sandwich format immunoassay for the detection of CRP. In their assay, a capture antibody to CRP was patterned in multiple bands within the detection region. Their assay protocol consisted of the following steps: analyte in the sample was applied to the pad and flowed downstream, a species of detection antibody to CRP conjugated to label was rehydrated and mixed with the analyte in the sample and produced complexes, and the complexes bound to the capture antibody producing visible bars in the detection region. The ladder-bar assay was designed to produce between 0 and 4 bars corresponding to CRP concentration ranges of less than 10 mg/L, 10 to 25 mg/L, 25 to 50 mg/L, 50 to 100 mg/L, and greater than 100 mg/L. Example devices are shown in Figure 5. Note that the depressed signal intensity in the capture bands for the highest concentration range tested, if due to the Hook effect, could be mitigated by the use of a higher concentration of conjugate. The results of the ladder-bar assay correlated well with results from an ELISA for CRP, with both characterized by a sensitivity of ~90%. An interesting aspect of the layout of the ladder-bar design was the non-uniform spacing of the capture bands, with (generally) decreasing spacing for bands located further downstream. Though not explicitly discussed, the decreasing spacing in the capture pattern would offset the increasing interaction time for solution species to bind with the capture species in Washburn flow.
Figure 5.
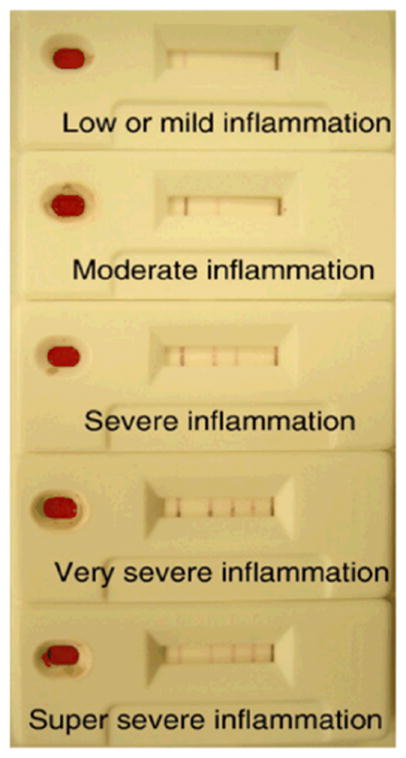
Quantitative detection in an immunoassay for C-reactive protein (CRP). Each test window shows a result corresponding to the following concentration ranges of CRP: less than 10 mg/L, between 10 and 25 mg/L, between 25 and 50 mg/L, between 50 and 100 mg/L, and greater than 100 mg/L, from top to bottom, respectively. The image is reprinted from Leung et al.27, Copyright (2008), with permission from Elsevier.
Fung et al.28 extended the ladder-bar approach to an enzyme-based system for the detection of hydrogen peroxide. In their optimal assay configuration, the enzyme (HRP) was patterned within the bands and the substrate was stored dry in an upstream pad for rehydration at the time of sample flow within the device. They demonstrated the detection of hydrogen peroxide in three ranges of “low” (less than 2.5 μM), “medium” (2.5 to 20 μM), and “high” (greater than 20 μM). The method was then extended by coupling to glucose oxidase upstream for the detection of low (less than 5 μM), medium (5 to 100 μM), and high (greater than 100 μM) levels of glucose. Example assays are shown in Figure 6. In a related effort, Fung et al. demonstrated quantitative detection of creatinine 29.
Figure 6.
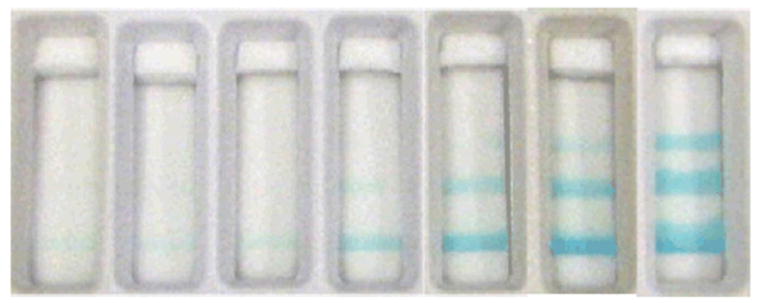
Demonstration of an enzyme-based ladder-bar assay for glucose detection (0, 1, 5, 25, 50, 100, and 200 μM). The image is reprinted from Fung et al.28, Copyright (2009), with permission from Elsevier.
More recently Lewis et al.30 revisited the idea of using the spatial distribution of the signal to quantify analyte concentration in a novel system. Their system was based on selective modification of the wetting properties of the paper substrate to create a quantitative “radial bar” readout for hydrogen peroxide detection. In their assay, a hydrophobic substance, localized to a radial bar, a sub-region of the detection region of a device, reacted with the analyte hydrogen peroxide to produce hydrophilic products, which then allowed the sample to flow into that radial bar and rehydrate a colored dye. The additional radial bars, initially patterned with increasing amounts of the hydrophobic substance, were connected in series, so that the concentration of hydrogen peroxide, from 10 mM to 100 mM, was a linear function of the number of visible colored bars at the end of a fixed time. A time sequence of a device is shown in Figure 7. The authors indicated that their next steps would be to create additional compounds to extend this promising method to a wider set of analytes.
Figure 7.

Radial bar readout for hydrogen peroxide detection using a hydrophobic to hydrophilic switch. The number of colored bars is proportional to the concentration of analyte hydrogen peroxide. The image is reprinted from Lewis et al.30, Copyright (2012), with permission from Wiley.
Zhang et al.31 also demonstrated a quantitative method for hydrogen peroxide detection using the spatial distribution of signal. Their method relied on the reduction and oxidation of colorless potassium iodide and colored iodine, respectively. Specifically, successive zones of the detection region of an assay were spotted with the same amount of potassium iodine and a weak acid, and an increasing amount of sodium hyposulfite, so that the number of colored bars was linearly related to the concentration of hydrogen peroxide in the sample. The authors demonstrated hydrogen peroxide detection from 0.65 mM to 300 mM.
The work described in this section demonstrated ladder-bar assays for the quantitative detection of a variety of analytes. As in the case of intensity-based and direct distance-based assays, on-device calibration is critical to achieving robust results with high quantitative resolution. A difference between the direct distance-based readout and the ladder-bar readout is the additional tunable parameters of the bar dimensions and the spacing between the bars. Creating a bar-based readout with the desired dynamic range and quantitative resolution can be achieved by tuning these parameters, as well as the concentration of reacting species within the bars. Additionally, the ladder-bar format is amenable to independently fine-tuning reagent concentrations in each of the bars to obtain a desired level of signal. Finally, a slight advantage of the ladder-bar readout to direct distance-based readout is the simplicity of counting bars to interpret the test results.
Time-based readout
A complementary readout approach to using distance-based measurement is to measure the time that it takes for the assay to produce a signal relative to a control, as shown in Figure 8. Lewis et al.30,32 demonstrated the use of the flow time of the analyte hydrogen peroxide through the detection region for quantitative readout.
Figure 8.
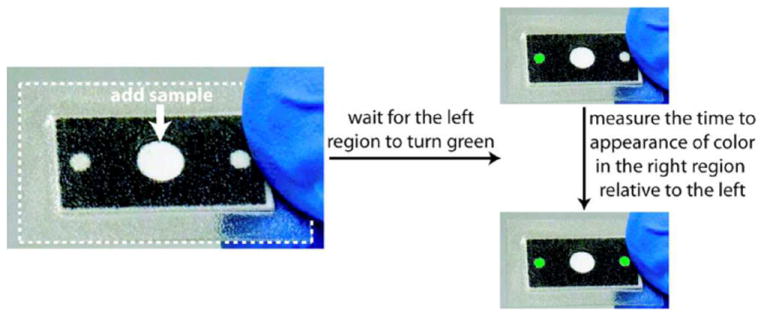
Device operation for time-based quantitative readout. The image is reprinted with permission from Lewis et al.32. Copyright (2013) American Chemical Society.
The authors used a phase switching system in which the concentration of the hydrophilic products produced is an increasing function of the concentration of hydrogen peroxide in the sample. Thus, the time measured for the sample to flow through the detection region of the assay and produce a colored product relative to a control can be used to inform on the concentration of analyte in the sample. Zhang et al.31 complemented this work by using a hydrophilic to hydrophobic switching system to quantitatively detect hydrogen peroxide with a greater dynamic range and lower limit of detection.
Time-based assays, like direct distance-based assays, have the potential for high quantitative resolution. A potential disadvantage of time-based measurements is that in its simplest form, the user’s attention must be fixed on the assay while it is running, so is not compatible with a user multitasking, e.g., running several tests in parallel. On the other hand, coupling time-based readout with a cellular phone for the detection of the assay run time could be a promising approach to remove user intervention and significantly increase the usability of this approach for some settings.
Next steps
Much progress has been made in the development of equipment-free quantitative tests for low-resource settings. However, moving forward, the translation of current research prototypes into high-impact field tests requires addressing two challenges.
The first challenge is to achieve reproducible quantitative results. As described above, the varying environmental operating conditions that may be encountered in the lowest-resource settings can affect assay signal output such that on-device calibrators are critical for robust test performance. Though on-board calibrators have been demonstrated in the context of intensity-based measurements by several investigators14,15, their implementation in the distance-based approaches would also have value. Further, device evaluation should be extended from small-scale pilot studies in research laboratories to large-scale studies in the field. The study by Pollock et al.17, demonstrated the utility of a field evaluation for assessing the reproducibility of their device output as performed by relevant operators and under relevant environmental operating conditions. In addition, the results of the field evaluation study provided valuable insight into the usability of their device for their intended operators and identified specific ways to improve their test.
The second challenge is to create user-friendly tests for the minimally-trained user of the lowest-resource settings. This means creating tests that are integrated and automated with minimal and simple steps for the user to perform. For example, the calibrators would ideally be run from dry reagents stored on the card and rehydrated by the user. Recent work in the paper microfluidics field has produced a number of fluid metering tools that enable integration and automation3. In addition, other paper microfluidic tools such as fluidic timers and batteries could enable visual or audible cues to guide the user during test operation11. For example, for the time-based readout approach, visual cues to indicate the progress of the assay and an audio alert to signal the end of the test could improve the accuracy of the test.
Meeting the above challenges can enable quantitative testing for numerous compelling applications in the lowest-resource settings and thus expand the reach of appropriate testing to those populations in need.
Acknowledgments
EF acknowledges Carly Holstein, Tinny Liang, and Stephen Ramsey for helpful comments on the manuscript. EF also acknowledges support by the National Institute of Allergy and Infectious Disease of the National Institutes of Health under award number R01AI096184. The content is solely the responsibility of the author and does not necessarily represent the official views of the National Institutes of Health.
References
- 1.Mabey D, Peeling RW, Ustianowski A, Perkins MD. Nature Reviews Microbiology. 2004;2:231–240. doi: 10.1038/nrmicro841. [DOI] [PubMed] [Google Scholar]
- 2.Martinez A, Phillips S, Whitesides G, Carrilho E. Anal Chem. 2010;82:3–10. doi: 10.1021/ac9013989. [DOI] [PubMed] [Google Scholar]
- 3.Byrnes S, Thiessen G, Fu E. Bioanalysis. 2013;5:2821–2836. doi: 10.4155/bio.13.243. [DOI] [PMC free article] [PubMed] [Google Scholar]
- 4.Yetisen AK, Akram MW, Lowe CR. Lab Chip. 2013;13:2210–2251. doi: 10.1039/c3lc50169h. [DOI] [PubMed] [Google Scholar]
- 5.Pearson TA, Mensah GA, Alexander RW, Anderson JL, Cannon RO, Criqui M, Fadl YY, Fortmann SP, Hong Y, Myers GL, Rifai N, Smith SC, Taubert K, Tracy RP, Vinicor F. Circulation. 2003;107:499–511. doi: 10.1161/01.cir.0000052939.59093.45. [DOI] [PubMed] [Google Scholar]; Myers GL, Rifai N, Tracy RP, Roberts WL, Alexander RW, Biasucci LM, Catravas JD, Cole TG, Cooper GR, Khan BV, Kimberly MM, Stein EA, Taubert KA, Warnick GR, Waymack PP. Circulation. 2004;110:E545–E549. doi: 10.1161/01.CIR.0000148980.87579.5E. [DOI] [PubMed] [Google Scholar]
- 6.Mackie PH, Crockson RA, Stuart J. Journal of Clinical Pathology. 1979;32:1253–1256. doi: 10.1136/jcp.32.12.1253. [DOI] [PMC free article] [PubMed] [Google Scholar]; Ip M, Rainer TH, Lee N, Chan C, Chau SSL, Leung W, Leung MF, Tam TK, Antonio GE, Lui G, Lau TK, Hui DSC, Fuchs D, Renneberg R, Chan PKS. Diagnostic Microbiology and Infectious Disease. 2007;59:131–136. doi: 10.1016/j.diagmicrobio.2007.04.019. [DOI] [PubMed] [Google Scholar]
- 7.Herkes GK, Eadie MJ. Epilepsy Research. 1990;6:146–154. doi: 10.1016/0920-1211(90)90090-i. [DOI] [PubMed] [Google Scholar]; Drobitch RK, Svensson CK. Clinical Pharmacokinetics. 1992;23:365–379. doi: 10.2165/00003088-199223050-00003. [DOI] [PubMed] [Google Scholar]; Neels HM, Sierens AC, Naelaerts K, Scharpe SL, Hatfield GM, Lambert WE. Clinical Chemistry and Laboratory Medicine. 2004;42:1228–1255. doi: 10.1515/CCLM.2004.245. [DOI] [PubMed] [Google Scholar]
- 8.Trummer M, Aberer W, Kranke B. Allergologie. 2007;30:149–154. [Google Scholar]
- 9.Rowley CF. Clinical Infectious Diseases. 2014;58:407–412. doi: 10.1093/cid/cit733. [DOI] [PMC free article] [PubMed] [Google Scholar]
- 10.Copeland KC, Silverstein J, Moore KR, Prazar GE, Raymer T, Shiffman RN, Springer SC, Thaker VV, Anderson M, Spann SJ, Flinn SK. Pediatrics. 2013;131:364–382. doi: 10.1542/peds.2012-3494. [DOI] [PubMed] [Google Scholar]; Robert JJ. Diabetes Metab. 2003;29:S47–S53. [PubMed] [Google Scholar]
- 11.Phillips ST, Lewis GG. MRS Bulletin. 2013;38:315–319. [Google Scholar]
- 12.Dungchai W, Chailapakul O, Henry CS. Anal Chim Acta. 2010;674:227–233. doi: 10.1016/j.aca.2010.06.019. [DOI] [PubMed] [Google Scholar]
- 13.Rattanarat P, Dungchai W, Cate DM, Siangproh W, Volckens J, Chailapakul O, Henry CS. Anal Chim Acta. 2013;800:50–55. doi: 10.1016/j.aca.2013.09.008. [DOI] [PMC free article] [PubMed] [Google Scholar]
- 14.Wang W, Wu WY, Zhu JJ. J Chromatogr A. 2010;1217:3896–3899. doi: 10.1016/j.chroma.2010.04.017. [DOI] [PubMed] [Google Scholar]
- 15.Zhu WJ, Feng DQ, Chen M, Chen ZD, Zhu R, Fang HL, Wang W. Sens Actuator B-Chem. 2014;190:414–418. [Google Scholar]
- 16.Pollock NR, Rolland JP, Kumar S, Beattie PD, Jain S, Noubary F, Wong VL, Pohlmann RA, Ryan US, Whitesides GM. Science Translational Medicine. 2012;4:152ra129. doi: 10.1126/scitranslmed.3003981. [DOI] [PMC free article] [PubMed] [Google Scholar]
- 17.Pollock NR, McGray S, Colby DJ, Noubary F, Nguyen H, Nguyen TA, Khormaee S, Jain S, Hawkins K, Kumar S, Rolland JP, Beattie PD, Chau NV, Quang VM, Barfield C, Tietje K, Steele M, Weigl BH. Plos One. 2013;8:e75616. doi: 10.1371/journal.pone.0075616. [DOI] [PMC free article] [PubMed] [Google Scholar]
- 18.Zuk RF, Ginsberg VK, Houts T, Rabbie J, Merrick H, Ullman EF, Fischer MM, Sizto CC, Stiso SN, Litman DJ. Clin Chem. 1985;31:1144–1150. [PubMed] [Google Scholar]
- 19.Vaughan LM, Milavetz G, Ellis E, Szefler SJ, Conboy K, Weinberger MM, Tillson S, Jenne J, Wiener MB, Shaughnessy T, Carrico J. Lancet. 1986;1:184–186. doi: 10.1016/s0140-6736(86)90655-0. [DOI] [PubMed] [Google Scholar]
- 20.Chen R, Li TM, Merrick H, Parrish RF, Bruno V, Kwong A, Stiso C, Litman DJ. Clin Chem. 1987;33:1521–1525. [PubMed] [Google Scholar]
- 21.Allen MP, Delizza A, Ramel U, Jeong H, Singh P. Clin Chem. 1990;36:1591–1597. [PubMed] [Google Scholar]
- 22.Liu VYS, Lin TY, Schrier W, Allen M, Singh P. Clin Chem. 1993;39:1948–1952. [PubMed] [Google Scholar]
- 23.Cate DM, Dungchai W, Cunningham JC, Volckens J, Henry CS. Lab Chip. 2013;13:2397–2404. doi: 10.1039/c3lc50072a. [DOI] [PubMed] [Google Scholar]
- 24.Nilghaz A, Ballerini DR, Fang XY, Shen W. Sens Actuator B-Chem. 2014;191:586–594. [Google Scholar]
- 25.Lou SC, Patel C, Ching SF, Gordon J. Clin Chem. 1993;39:619–624. [PubMed] [Google Scholar]
- 26.Buhrer-Sekula S, Hamerlinck FFV, Out TA, Bordewijk LG, Klatser PR. J Immunol Methods. 2000;238:55–58. doi: 10.1016/s0022-1759(00)00148-4. [DOI] [PubMed] [Google Scholar]
- 27.Leung W, Chan CP, Rainer TH, Ip M, Cautherley GWH, Renneberg R. J Immunol Methods. 2008;336:30–36. doi: 10.1016/j.jim.2008.03.009. [DOI] [PubMed] [Google Scholar]
- 28.Fung KK, Chan CPY, Renneberg R. Anal Chim Acta. 2009;634:89–95. doi: 10.1016/j.aca.2008.11.064. [DOI] [PubMed] [Google Scholar]
- 29.Fung KK, Chan CPY, Renneberg R. Analytical and Bioanalytical Chemistry. 2009;393:1281–1287. doi: 10.1007/s00216-008-2551-5. [DOI] [PubMed] [Google Scholar]
- 30.Lewis GG, DiTucci MJ, Phillips ST. Angewandte Chemie-International Edition. 2012;51:12707–12710. doi: 10.1002/anie.201207239. [DOI] [PubMed] [Google Scholar]
- 31.Zhang Y, Zhou CB, Nie JF, Le SW, Qin Q, Liu F, Li YP, Li JP. Anal Chem. 2014;86:2005–2012. doi: 10.1021/ac403026c. [DOI] [PubMed] [Google Scholar]
- 32.Lewis GG, Robbins JS, Phillips ST. Anal Chem. 2013;85:10432–10439. doi: 10.1021/ac402415v. [DOI] [PubMed] [Google Scholar]


