

Abstract
Recent studies have emphasized a role of adaptive immunity, and particularly T cells, in the genesis of hypertension. We sought to determine the T cell subtypes that contribute to hypertension and renal inflammation in angiotensin II-induced hypertension. Using T cell receptor (TCR) spectratyping to examine TCR usage we demonstrated that CD8+ cells, but not CD4+ cells, in the kidney exhibited altered TCR transcript lengths in Vβ3, 8.1 and 17 families in response to angiotensin II-induced hypertension. Clonality was not observed in other organs. The hypertension caused by angiotensin II in CD4−/− and MHCII−/− mice was similar to that observed in WT mice, while CD8−/− mice and OT1xRAG-1−/− mice, which have only one TCR, exhibited a blunted hypertensive response to angiotensin II. Adoptive transfer of pan-T cells and CD8+ T cells but not CD4+/CD25− cells conferred hypertension to RAG-1−/− mice. In contrast, transfer of CD4+/CD25+ cells to wild type mice receiving angiotensin II decreased blood pressure. Mice treated with angiotensin II exhibited increased numbers of kidney CD4+ and CD8+ T cells. In response to a sodium/volume challenge, wild type and CD4−/− mice infused with angiotensin II retained water and sodium whereas CD8−/− mice did not. CD8−/− mice were also protected against angiotensin-induced endothelial dysfunction and vascular remodeling in the kidney. These data suggest that in the development of hypertension, an oligoclonal population of CD8+ cells accumulate in the kidney and likely contribute to hypertension by contributing to sodium and volume retention and vascular rarefaction.
Keywords: T cell receptor, adaptive immunity, angiotensin II, diuresis, natriuresis
INTRODUCTION
Hypertension affects 30% of adults in Western populations and predisposes to myocardial infarction, stroke, heart failure and renal failure.1, 2 Despite the prevalence of this disease, the etiology of hypertension in most adults is unknown and perturbations of the central nervous system, the kidney and the vasculature have been implicated. Recently our laboratory and others have demonstrated a role of inflammation and the adaptive immune system in the genesis of hypertension.3, 4 Several studies have shown that RAG-1−/− mice, which lack lymphocytes, are partly protected against hypertension caused by angiotensin II, DOCA-salt challenge and norepinephrine. Adoptive transfer of T cells restores hypertension in these animals. Very recently, Mattson et al. have shown that T cells play a role in hypertension in Dahl salt sensitive rats.5 Recent data suggests that T cells release cytokines that mediate sodium retention in the kidney and vasoconstriction.4
Our laboratory has previously found that both CD4+ and CD8+ T cells accumulate in aortic perivascular fat of hypertensive mice. CD4+ T regulatory cells have been shown to be protective against hypertension and end organ damage.6 Despite these findings, there is little information on the relative importance of CD4+ and CD8+ T cells and whether hypertension is dependent on expansion of specific T cell clones. The purpose of this investigation is to determine the T cell subtypes involved in the genesis of hypertension. We hypothesized that T cells in the kidney and vasculature would exhibit altered T cell receptor (TCR) usage in response to angiotensin II-induced hypertension. We found that CD8+ but not CD4+ T cells in the kidney exhibited altered T cell receptor usage. We examined the role of CD4+ and CD8+ T cells using mice lacking these subtypes and mice lacking CD8+ T cells were protected against hypertension. Further, CD8+ T cells seem to modulate renovascular remodeling and promote the anti-natiruetic and anti-diuretic effects of angiotensin II.
MATERIALS AND METHODS
Animals studied
Hypertension was produced in Wild type, RAG-1−/−, CD4−/−, CD8−/− and MCHII−/−, and OT1xRAG-1−/− male mice by infusion of angiotensin II (490 ng/kg/min) for two weeks. Blood pressure was measured both invasively using telemetry and non-invasively using the tail cuff method as previously described.3 Flow cytometry, vascular reactivity in mesenteric arteries, sodium and volume challenge experiments and kidney vascular morphology analyses are described in detail in the online supplement.
T cell Receptor Analysis
TCR Vβ spectratyping was performed using PCR with a forward primer for each of the 24 TCR Vβ genes and a constant reverse primer for the Cβ gene labeled with FAM on the 5′ end (Table S1). TCR deep sequencing was performed in spleen, mesenteric and renal CD8+ T cells as detailed in the supplemental methods and described previously.7, 8
Detailed materials and methods are provided in the online supplement.
RESULTS
The effect of hypertension on T cell receptor clonality
T cell activation occurs upon presentation of antigenic peptides by major histocompatibility complexes, leading to proliferation of T cell clones that are specific for individual antigens. The Vβ region of the TCR gene exhibits enormous diversity and analysis of this region can provide insight into adaptive immune responses. The presence of a dominant transcript length for a given Vβ family is indicative of clonal expansion and provides insight into the antigenic repertoire responsible for T cell activation.9, 10 We therefore performed spectratyping analysis of CD4+ and CD8+ T cells isolated from the spleen, mesenteric vascular arcade and the kidneys of mice treated with vehicle or angiotensin II. In the spleen both CD4+ and CD8+ TCR Vβ families exhibited a Gaussian distribution in both sham and angiotensin II treated mice, indicative of a relatively naïve pool of T cells (Figure 1A, B). Greater TCR transcript length variability was exhibited in mesentery (Figure 1C, D) and kidney (Figure 2A, B). In many Vβ families, in both kidney and mesentery, there was considerable variation in the spectratyping profiles regardless of presence or absence of angiotensin II. To determine whether the transcript length distribution was consistently altered across mice that received angiotensin II and to detect the presence of dominant transcript lengths, Dirichelet and MaGiK analyses were employed.11, 12 T cell receptor spectratyping profiles from the spleen and mesenteric vasculature CD4+ and CD8+ cells as well as kidney CD4+ cells revealed no statistical differences when comparing sham to angiotensin II treated mice (n = 8–10 per group). In contrast, angiotensin II resulted in the presence of dominant transcript lengths in kidney T cell CD8+ Vβ 3, 8.1, and 17 families (Figure 2C–E).
Figure 1.

Sample TCR Vβ Family Spectratype Profiles from Spleen and Mesenteric Vasculature. Mice were made hypertensive by infusion of angiotensin II (Ang II, 490 ng/kg/min) for 14 days. CD4+ and CD8+ T cells were isolated from the spleen or mesentery, mRNA isolated and reverse transcribed to cDNA. PCR was performed using 24 different Vβ primers and a single FAM labeled Cβ primer. The resulting fragment profiles were visualized using Peak Scanner software from Applied Biosystems. A) Spleen sample distributions for each CD4+ Vβ family from sham and angiotensin II treated mice. B) Spleen sample distributions from CD8+ Vβ families. C) Mesentery sample distributions from CD4+ Vβ families. C) Mesentery sample distributions from CD8+ Vβ families. Vβ families not shown were undetectable.
Figure 2.

TCR Vβ Family Spectratype Profiles from Kidney T cells. Samples were prepared from the kidneys of sham and angiotensin II (Ang II)-infused mice as described in figure 1. A) Kidney sample distributions for each CD4+ Vβ family from sham and angiotensin II treated mice. B) Kidney sample distributions from CD8+ Vβ families. Vβ families not shown were undetectable. TCR length profiles were analyzed using Applied Biosystems Peak Scanner software and the area under each peak at a given transcript length was divided by the total area under all peaks to determine the relative frequency of each individual transcript length. Frequency distributions are shown for CD8+ C) Vβ3, D) Vβ8.1 and E) Vβ17 families. Spectratyping profiles were p values determined by Dirichelet distribution and the MaGiK analysis, n = 8–10 per group.
In additional studies, we employed deep sequencing of CD8+ TCR to provide further insight into potential clones involved in the hypertensive response. In kidney CD8+ T cells, deep sequencing revealed 4341 ± 514 unique TCR sequences in sham mice and 3522 ± 1049 unique TCR sequences in mice treated with angiotensin II (n = 5 per group). The most commonly shared clonotypes among angiotensin II treated mice included 3 clonotypes which were shared by 4 out of 5 angiotensin II treated mice and 2 that were shared by 3 out of 5 angiotensin II treated mice (Table 1). These clonotypes were not present in multiple sham mice. Notably, the clone with amino acid sequence CASSDNTEVFF observed in angiotensin II treated mice exists in the Vβ8.1 family and is identical to the dominant transcript length observed by spectratyping (Figure 2D). We found that these unique sequences were also present in the spleen, but their frequencies were low and not different between sham and angiotensin II-treated mice. The sequences shared by angiotensin II treated mice in the kidney were not present in the mesentery.
Table.
Kidney CD8+ T cell clonotypes shared by Angiotensin II treated mice
| % Clone Frequency in Angiotensin II Treated mice | ||||||||
|---|---|---|---|---|---|---|---|---|
| CDR3 sequence | Vβ | Jβ | mouse | #1 | #2 | #3 | #4 | #5 |
| CASSLGTANTGQLYF | 5.1 | 2.5 | 0.014 | 0.020 | 0.062 | 0.009 | * | |
| CASSDNTEVFF | 8.1 | 1.1 | 0.061 | 0.010 | 0.024 | * | 0.106 | |
| CASSPGTGNTEVFF | 11 | 1.1 | 0.034 | 0.020 | * | 0.013 | 0.213 | |
| CASSFSSGNTLYF | 13 | 1.3 | * | 0.021 | 0.060 | * | 0.006 | |
| CASGDGHQDTQYF | 8.2 | 2.5 | * | 0.010 | 0.029 | 0.023 | * | |
clone not present
The role of T cell subtypes in hypertension
The specific skewing of CD8+ T cells, rather than CD4+ cells was surprising. We therefore performed additional experiments to examine the roles of these cells in hypertension. We infused angiotensin II for 14 days into wild type (WT), CD4−/− and CD8−/− mice. Both systolic and diastolic blood pressures were significantly increased in WT and CD4−/− mice (Figure 3A, B). In contrast, the angiotensin II-induced increase in blood pressure was blunted in CD8−/− mice (Figure 3A, B). MCHII−/− mice, an alternate model of CD4+ deficiency, also exhibited increased blood pressure in response to angiotensin II (Figure 3A, B). To determine whether an alternate model of hypertension is also dependent on CD8+ T cells we induced DOCA-salt hypertension in WT, CD8−/− and CD4−/− mice. The increase in blood pressure in response to DOCA-salt challenge was significantly reduced in CD8−/− mice compared to either CD4−/− or WT mice (Figure S1), similar to angiotensin II-induced hypertension.
Figure 3.

Role of T cell subtypes in angiotensin II (Ang II)-induced hypertension. Wild-type (WT, n = 4), CD4−/− (n = 5), CD8−/− (n = 5), MHCII−/− (n = 6) and OT1xRAG-1−/− (n = 10) mice received angiotensin II (490 ng/kg/min) for 15 days via osmotic minipumps. Blood pressure was monitored by telemetry and values represent day/night averages for each group during the last 3 days of infusion. A) Baseline systolic (top) and diastolic blood pressures (bottom) B) 14 day systolic (top) and diastolic blood pressures (bottom). C) Adoptive transfer of T cells into RAG-1−/− mice. RAG-1−/− mice received angiotensin II (Ang II) via osmotic minipump starting at day 0 and at day 10 received no cells, pan T cells, CD4+/CD25− or CD8+ T cells from WT mice (n = 7–9 per group) that had previously received angiotensin II for 2 weeks. Blood pressure was measured by tail cuff. D) Adoptive transfer of CD4+/CD25+ into WT mice. Both groups received Ang II starting at day 0 and at day 9 received no cells or CD4+/CD25+ T cells from untreated WT mice. (n = 5 per group) P values for blood pressure were determined using repeated measures ANOVA and a Student Newman Keuls post-hoc test. D = day, N = night.
To determine whether mice with an altered TCR phenotype are resistant to hypertension, we infused angiotensin II or vehicle in OT1xRAG-1−/− mice, which possess a transgene for a TCR specific for ovalbumin peptide OVA257–264 presented on MHC I. These mice are on a RAG-1−/− background and therefore cannot generate endogenous TCRs. The angiotensin II-induced increases in both systolic and diastolic blood pressures were blunted in OT1xRAG-1−/− mice compared to those observed in WT, CD4−/− and MHCII−/− mice, but were similar to the pressures observed in CD8−/− mice (Figure 3A, B).
To gain further insight into T cell subtypes in hypertension, adoptive transfer experiments were performed. As previously reported, angiotensin II had only a modest effect on blood pressure in RAG-1−/− mice3, 13, whereas adoptive transfer of pan T cells from WT mice that had received angiotensin II for 2 weeks increased blood pressure to approximately 160 mmHg in the recipient RAG-1−/− mice (Figure 3C). Adoptive transfer of CD4+/CD25− cells from angiotensin II treated mice into RAG-1−/− mice had no effect on blood pressure (Figure 3C). In contrast, adoptive transfer of CD8+ cells caused a striking elevation in blood pressure to greater than 180 mmHg (Figure 3C). As previously reported,6 adoptive transfer of CD4+/CD25+ T regulatory cells to wild-type mice on day 9 of angiotensin II infusion lowered blood pressure (Figure 3D).
Leukocyte Accumulation in Kidney and Vasculature
Flow cytometry was employed to determine the whether angiotensin II alters the T cell subtypes present in the kidney. Angiotensin II infusion caused a 3-fold increase in both CD8+ and CD4+ T cells in the kidney (Figure 4A, B). To determine whether CD8+ T cells orchestrate angiotensin II-induced accumulation of leukocytes in the vasculature aortas form wild type and CD8−/− mice were also analyzed. The accumulation of CD45+ leukocytes was greater in wild type compared to CD8−/− mice (Figure S2).
Figure 4.

Renal T cells accumulation and their role in the anti-diuresis and anti-natriuresis caused by angiotensin II (Ang II). Kidney single cell suspensions from sham and Ang II treated mice were subjected to flow cytometry for analysis of CD4+ and CD8+ T cell accumulation. A) Sample flow cytometry plots and B) Absolute numbers of CD4+ and CD8+ cells per kidney. n = 6 per group p values determined by unpaired t test. C) urine, D) sodium and E) chloride output over 4 hours in response to 10% of mouse body weight in saline IP on the days indicated (n = 5–6 per group). P values represent changes from baseline determined by repeated measures ANOVA. B-Baseline 2-, 5-, 10-days of angiotensin II treatment.
Role of CD8+ and CD4+ T cells on responses to sodium and volume challenge
To determine the effect of T cell subsets on sodium and volume retention, studies were performed in which mice received an intraperitoneal injection of normal saline equal to 10% of their body weight at various times before and during angiotensin II infusion. At baseline (day-1), mice excreted more than 80% of this challenge in 4 hours, independent of their T cell populations (Figure 4C). In WT mice, angiotensin II infusion induced a modest retention of volume and NaCl compared to baseline values that persisted through day 10 (Figure 4C–E). In CD4−/− mice, volume and NaCl retention was similar to that in WT mice on day 2, but on day 5, CD4−/− mice excreted only about 20% of the volume and NaCl challenge (Figure 4C–E). In contrast, CD8−/− mice were protected against urinary volume and NaCl retention at all times following onset of angiotensin II infusion (Figure 4C–E). Taken together, these data illustrate that CD8+ T cells play a critical role in the anti-diuretic and anti-natriuretic responses to angiotensin II.
Effect of CD8+ T cells on renal vascular remodeling in hypertension
To determine if inflammatory T cells mediate vascular remodeling in the kidney during hypertension we examined renal vascular volume using microCT angiography (Figure 5A). Total kidney and cortical vascular volumes were decreased with angiotensin II in WT and CD4−/− mice but was persevered in CD8−/− mice (Figure 5B, C). Notably, a decrease in vessels < 25 μm in diameter, represented by a loss of blue pseudo-color, appears to account for the decrease in vascular volume with angiotensin II (Figure 5A). Medullary vascular volume was decreased with angiotensin II in WT but not CD4−/− or CD8−/− mice (Figure 5D). To further characterize alterations in small arterioles, alpha actin staining was employed. In these small vessels, media-to-lumen ratio was increased in WT and CD4−/− mice but not CD8−/− mice (Figure 5E, F).
Figure 5.

Effect of T cell subtypes on the kidney vascular structure. A) Representative CT models of the kidney vasculature in sham and angiotensin II (Ang II) treated mice. Quantification of B) total vascular volume (mm2), C) cortex vascular volume, D) medulla vascular volume (n = 3–5 per group). E) alpha actin staining for renal cortical arterioles in wild-type (WT), CD4−/− and CD8−/− mice. F) Renal arterioles <25 mm in diameter and arteries > 25 mm were quantified by planimetry (n = 4 per group). P values determined by 2 way ANOVA.
Role of T cell subtypes in vascular reactivity
To examine vascular reactivity, we studied 2nd and 3rd order mesenteric arteries, which are involved in modulation of vascular resistance, in a wire myograph preparation. Endothelium-dependent relaxations in response to acetylcholine were impaired in vessels of WT and CD4−/− mice, compared to arteries of sham infused wild-type mice. In contrast, angiotensin II did not impair endothelium-dependent relaxation in vessels of CD8−/− mice (Figure 6A). Endothelium-independent relaxations were not altered (Figure 6B).
Figure 6.
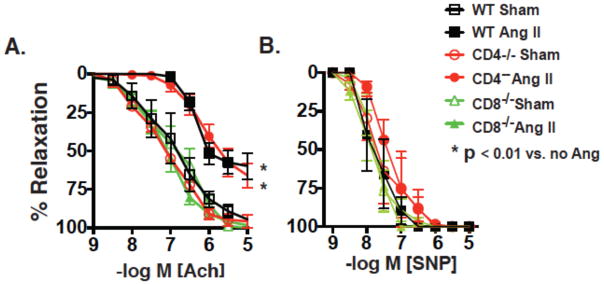
Influence of T cell subtypes in angiotensin II-induced vascular dysfunction. Mice received sham or angiotensin II (Ang II) infusions for 2 weeks as in figure 1. Second and third order mesenteric vessels were mounted in wire myographs and pre-constricted with phenylephrine (1 μm). A) Endothelium-dependent relaxations to acetylcholine and B) endothelium-dependent independent relaxations to sodium nitroprusside (SNP) were then determined and compared using ANOVA for repeated measures (n = 4–7 per group).
DISCUSSION
In the current study, we sought to determine the nature of T cells involved in the genesis of hypertension by examining clonality in various organs involved in hypertension and by examining the role of T cell subtypes. Spectratyping of TCRs revealed the development of dominant transcript lengths in kidney CD8+ T cell Vβ3, 8.1 and 17 families following angiotensin II infusion. Deep sequencing of renal CD8+ cells revealed five sequences that were shared by angiotensin II treated mice. Mice that lacked CD8+ T cells or endogenous TCRs exhibited blunted pressor responses to angiotensin II. Adoptive transfer of pan T cells or CD8+ T cells induced hypertension in RAG-1−/− mice infused with angiotensin II. Mice that lacked CD8+ T cells were protected against angiotensin II-induced endothelial dysfunction, renal salt and water retention and vascular rarefaction. These data suggest that an oligoclonal population of CD8+ T cells accumulates in the kidney and that CD8+ T cells promote sodium and volume retention and arterial rarefaction resulting in overt hypertension.
To determine whether the T cell response in the kidney is monoclonal, oligoclonal or nonspecific, we employed TCR spectratyping. During T cell development in the thymus recombination of the Variable (V), Junctional (J) and Diversity (D) regions of the TCR beta chain occurs. In addition, terminal deoxynucleotidyl transferase facilitates random insertion of nucleotides at the V/D and D/J junctions, ultimately leading to enormous TCR diversity and specificity.14 In naïve pools of T cells this results in a Gaussian distribution of TCR gene transcript lengths. Spectratyping allows analysis of TCR transcript lengths and detection of non-Gaussian distributions. The presence of TCR dominant transcript lengths strongly suggests clonal expansion.9 Such analyses have revealed clonal expansion in the context of infection 15 and autoimmune disease.16 More recently, this has also been observed in models of atherosclerosis 17 and obesity.18, 19 We found that angiotensin II infusion resulted in dominant TCR transcript lengths in CD8+ T cells within the Vβ3, 8.1 and 17 TCR families in the kidney, while not altering the distributions within CD4+ cells or either CD4+ or CD8+ T cells in the spleen or mesenteric vasculature. While perturbations of both the vasculature and kidney have been shown to be involved in hypertension, the accumulation of a unique population of CD8+ T cells in the kidney suggests that this might be a primary site for immune activation in hypertension.
To gain further insight into TCRs involved in hypertension, we also employed deep sequencing of kidney, spleen and mesentery CD8+ TCRs. This approach provides a complete overview of the amino acid sequences of the TCR CDR3 region, which is the region of the TCR that binds to antigen.7, 8 We found that five CD8+ TCR sequences in the kidney were shared by multiple angiotensin II-treated mice. Of note, the CASSDNTEVFF clone is of the same transcript length as the dominant length observed within the Vβ8.1 family identified by spectratyping. Importantly, these sequences were not shared with sham mice. These sequences were not found in the mesenteric vasculature and found in both sham and angiotensin II treated mice in the spleen. The presence of these sequences in the spleens of both sham and angiotensin II-treated mice suggests that these sequences exist in the naïve pool of T cells in all animals and that unique sequences are mobilized to the kidney in hypertension. The presence of TCR sequences shared by angiotensin II treated mice exclusively in the kidney together with the skewing of selected TCR Vβ family transcript lengths in the kidney suggests that the kidney might represent a site of neoantigen formation in hypertension.
In unusual instances, such as T cell leukemia, a single TCR clone can account for up to 50% of the total TCR usage.20 In contrast, we found that clones shared among hypertensive mice represent less than 0.2% of all CD8+ TCR transcripts in the kidney. This is similar to shared clonotypes of islet infiltrating T cells in mice with type one diabetes.21 The relatively low frequency of unique TCR clonotypes in hypertensive mice is consistent with a common pattern of inflammation where specific T cell clones are first activated, followed by infiltration of other T cells unrelated to the initial clone that then contribute to the inflammatory response.22 In addition, in a region of inflammation, there may be development of other antigens, due to protein modifications that lead to activation of T cells other than the originally stimulated clones. This phenomenon is often referred to as epitope spreading,23 which can occur in response to either foreign proteins in infectious disease or to self-proteins in the context of autoimmune disease. In addition, depending on the topology of the MHC complex and antigen peptide “public” or “private” T cell responses can occur.24 If the MHC/peptide complex has distinct features, a single T cell clone is likely to recognize this complex across mice and this phenomenon is referred to as a public response. In contrast, if the MHC/peptide complex is relatively featureless, a private response can occur, where the TCR clones vary from one animal to the next. In summary, recruitment of non-specific T cell clones, epitope spreading and public vs. private T cell response may explain the generally low frequencies of unique TCR clonotypes in the kidneys of hypertensive mice. The precise nature of potential neoantigens involved in hypertension is an important topic for future study.
Because we observed skewing of CD8+ T cell receptors in the kidney, we performed additional studies to examine the role of these cells in hypertension. Interestingly, we found the hypertensive response to angiotensin II was blunted in CD8−/−, but not in CD4−/− mice. We also found that mice lacking MHCII, which are also deficient in CD4+ cells, were not protected against hypertension. These data indicate that not only is there alteration of CD8+ TCR sequences, but that these cells likely contribute to the elevation of blood pressure in response to angiotensin II. Importantly, Youn et al. recently demonstrated that proinflammatory immunosenescent CD8+ cells are increased in humans with hypertension.25
It is possible that the renal inflammation promotes inflammation in other organs. In keeping with this, we found that total leukocyte accumulation in the aorta of CD8−/− mice with angiotensin II treatment was less than that of wild type mice. One explanation for this is the reduced systemic pressure in the CD8−/− mice. In a recent study, we found that lowering blood pressure with hydralazine and hydrochlorothiazide markedly reduced vascular inflammation in response to chronic angiotensin II infusion.26
As we observed that hypertension is associated with alterations in TCR receptor usage in the kidney, we sought to determine if mice with an altered TCR repertoire would be protected against hypertension. The pressor response in OT1xRAG-1−/− mice, which do not posses endogenous TCR, is similar in magnitude to that observed in RAG-1−/− mice.3 This supports the concept that endogenous TCR are required for the development of overt hypertension. If the T cell response in hypertension were nonspecific, these mice would be expected to develop hypertension in a similar manner to wild type mice. We employed OT1xRAG-1−/− mice, as OT1 mice, despite a heavily skewed TCR repertoire, can still generate endogenous TCR, whereas OT1xRAG-1−/− mice cannot.27
Hypertensive stimuli such as angiotensin II have an anti-natriuretic effect, promoting an increase in intravascular volume. This is then followed by an increase in systemic vascular resistance, or systemic autoregulation, which is accompanied by alterations in vascular tone, arterial remodeling and vascular rarefaction. Our current findings suggest that CD8+ T cells act as an intermediate in angiotensin II-induced endothelilal dysfunction, vascular rarefaction and sodium and volume retention, key processes in the development of hypertension.28 Importantly, 25% of the cardiac output is directed to the kidneys. The loss in renal cortical arterioles and the resultant increase in systemic vascular resistance, likely contributes to hypertension. In addition, it is conceivable that decreased kidney blood flow may contribute to enhanced sodium and water reabsorption, also leading to increased blood pressure.
Our studies should not be interpreted as indicating that there is no role of CD4+ T cells in hypertension. The development of memory CD8+ T cells depends on CD4+ cell help.29 In addition, CD8+ T regulatory cells also exist and can exert anti-inflammatory effects in a similar manner to CD4+ T regulatory cells.30 We found greater numbers of both CD4+ and CD8+ T cells in the kidneys of hypertensive mice. Recent reports from our laboratory have also shown that CD4+ and CD8+ T cells accumulate in the aortas of hypertensive mice.3, 26 In RAG-1−/− mice, transfer of CD4+ cells from which CD25+ cells had been depleted, (thus excluding most T regulatory cells), did not raise blood pressure. Transfer of CD8+ cells alone caused a greater elevation in blood pressure than pan-T cells, suggesting that CD4+ cells play a protective role. Similarly, blood pressure in CD4−/− mice was greater than that of wild type mice in the DOCA salt experiments. Importantly, CD4−/− mice lack CD4+ regulatory cells, which are protective in hypertension.6 In accord with this observation we found that adoptive transfer of CD4+/CD25+ (primarily T regulatory cells) decreased blood pressure in wild type animals. These findings are consistent with ample evidence for inhibition of CD8+ T cells by CD4+ regulatory cells.31, 32 Taken together, these studies confirm a unique pro-hypertensive role of CD8+ T cells.
Supplementary Material
PERSPECTIVES.
Our data suggest that CD8+ T cells have an important role in hypertension and provide evidence that there is an oligoclonal response of these cells in the kidney. These cells help coordinate alterations in renal and vascular function that ultimately lead to hypertension and end organ dysfunction caused by hypertensive stimuli. One explanation for these results is that unique neoantigens develop in the hypertensive kidney and are presented in the context of MHC I. Our findings allow new insight into understanding hypertension and potentially provide new therapeutic directions for treatment in this disease and its end-organ damage.
NOVELTY AND SIGNIFICANCE.
What is new?
T cells have been shown to play a role in the development of hypertension, this study demonstrates that a specific subset of CD8+ T cells play a critical role in hypertension
These CD8+ T cells have altered T cell receptors, suggesting an immune response to a neoantigen in kidney
What is relevant?
The identification of this subset of CD8+ T cells provides insight into the development of high blood pressure and a potential target for future treatment
Summary
In the development of hypertension, a subset of CD8+ T cells act to decrease small blood vessel number and size in the kidney and contribute to the retention of salt and water, causing an increase in blood pressure
Acknowledgments
Supported by: NIH R01HL039006, P01HL058000, P01HL095070, P01GM015431, R01HL10529402, T32GM07569
Footnotes
Conflict(s) of Interest/Disclosure(s) Statement: none
References
- 1.Wolf-Maier K, Cooper RS, Banegas JR, Giampaoli S, Hense HW, Joffres M, Kastarinen M, Poulter N, Primatesta P, Rodriguez-Artalejo F, Stegmayr B, Thamm M, Tuomilehto J, Vanuzzo D, Vescio F. Hypertension prevalence and blood pressure levels in 6 European countries, Canada, and the United States. JAMA. 2003;289:2363–2369. doi: 10.1001/jama.289.18.2363. [DOI] [PubMed] [Google Scholar]
- 2.Kearney PM, Whelton M, Reynolds K, Muntner P, Whelton PK, He J. Global burden of hypertension: analysis of worldwide data. Lancet. 2005;365:217–223. doi: 10.1016/S0140-6736(05)17741-1. [DOI] [PubMed] [Google Scholar]
- 3.Guzik TJ, Hoch NE, Brown KA, McCann LA, Rahman A, Dikalov S, Goronzy J, Weyand C, Harrison DG. Role of the T cell in the genesis of angiotensin II induced hypertension and vascular dysfunction. J Exp Med. 2007;204:2449–2460. doi: 10.1084/jem.20070657. [DOI] [PMC free article] [PubMed] [Google Scholar]
- 4.Crowley SD, Song YS, Lin EE, Griffiths R, Kim HS, Ruiz P. Lymphocyte responses exacerbate angiotensin II-dependent hypertension. Am J Physiol Regul Integr Comp Physiol. 2010;298:R1089–1097. doi: 10.1152/ajpregu.00373.2009. [DOI] [PMC free article] [PubMed] [Google Scholar]
- 5.Mattson DL, Lund H, Guo C, Rudemiller N, Geurts AM, Jacob H. Genetic mutation of recombination activating gene 1 in Dahl salt-sensitive rats attenuates hypertension and renal damage. Am J Physiol Regul Integr Comp Physiol. 2013;304:R407–414. doi: 10.1152/ajpregu.00304.2012. [DOI] [PMC free article] [PubMed] [Google Scholar]
- 6.Barhoumi T, Kasal DA, Li MW, Shbat L, Laurant P, Neves MF, Paradis P, Schiffrin EL. T regulatory lymphocytes prevent angiotensin II-induced hypertension and vascular injury. Hypertension. 2011;57:469–476. doi: 10.1161/HYPERTENSIONAHA.110.162941. [DOI] [PubMed] [Google Scholar]
- 7.Robins HS, Campregher PV, Srivastava SK, Wacher A, Turtle CJ, Kahsai O, Riddell SR, Warren EH, Carlson CS. Comprehensive assessment of T-cell receptor beta-chain diversity in alphabeta T cells. Blood. 2009;114:4099–4107. doi: 10.1182/blood-2009-04-217604. [DOI] [PMC free article] [PubMed] [Google Scholar]
- 8.Robins H, Desmarais C, Matthis J, Livingston R, Andriesen J, Reijonen H, Carlson C, Nepom G, Yee C, Cerosaletti K. Ultra-sensitive detection of rare T cell clones. Journal of immunological methods. 2012;375:14–19. doi: 10.1016/j.jim.2011.09.001. [DOI] [PMC free article] [PubMed] [Google Scholar]
- 9.Currier JR, Robinson MA. Spectratype/immunoscope analysis of the expressed TCR repertoire. Curr Protoc Immunol. 2001;Chapter 10(Unit 10):28. doi: 10.1002/0471142735.im1028s38. [DOI] [PubMed] [Google Scholar]
- 10.Pannetier C, Even J, Kourilsky P. T-cell repertoire diversity and clonal expansions in normal and clinical samples. Immunol Today. 1995;16:176–181. doi: 10.1016/0167-5699(95)80117-0. [DOI] [PubMed] [Google Scholar]
- 11.Gueorguieva R, Rosenheck R, Zelterman D. Dirichlet Component Regression and its Applications to Psychiatric Data. Comput Stat Data Anal. 2008;52:5344–5355. doi: 10.1016/j.csda.2008.05.030. [DOI] [PMC free article] [PubMed] [Google Scholar]
- 12.Killian MS, Matud J, Detels R, Giorgi JV, Jamieson BD. MaGiK method of T-Cell receptor repertoire analysis. Clin Diagn Lab Immunol. 2002;9:858–863. doi: 10.1128/CDLI.9.4.858-863.2002. [DOI] [PMC free article] [PubMed] [Google Scholar]
- 13.Marvar PJ, Thabet SR, Guzik TJ, Lob HE, McCann LA, Weyand C, Gordon FJ, Harrison DG. Central and peripheral mechanisms of T-lymphocyte activation and vascular inflammation produced by angiotensin II-induced hypertension. Circ Res. 2010;107:263–270. doi: 10.1161/CIRCRESAHA.110.217299. [DOI] [PMC free article] [PubMed] [Google Scholar]
- 14.Fazilleau N, Cabaniols JP, Lemaitre F, Motta I, Kourilsky P, Kanellopoulos JM. Valpha and Vbeta public repertoires are highly conserved in terminal deoxynucleotidyl transferase-deficient mice. J Immunol. 2005;174:345–355. doi: 10.4049/jimmunol.174.1.345. [DOI] [PubMed] [Google Scholar]
- 15.Gorochov G, Neumann AU, Kereveur A, Parizot C, Li T, Katlama C, Karmochkine M, Raguin G, Autran B, Debre P. Perturbation of CD4+ and CD8+ T-cell repertoires during progression to AIDS and regulation of the CD4+ repertoire during antiviral therapy. Nat Med. 1998;4:215–221. doi: 10.1038/nm0298-215. [DOI] [PubMed] [Google Scholar]
- 16.Acha-Orbea H, Mitchell DJ, Timmermann L, Wraith DC, Tausch GS, Waldor MK, Zamvil SS, McDevitt HO, Steinman L. Limited heterogeneity of T cell receptors from lymphocytes mediating autoimmune encephalomyelitis allows specific immune intervention. Cell. 1988;54:263–273. doi: 10.1016/0092-8674(88)90558-2. [DOI] [PubMed] [Google Scholar]
- 17.Paulsson G, Zhou X, Tornquist E, Hansson GK. Oligoclonal T cell expansions in atherosclerotic lesions of apolipoprotein E-deficient mice. Arteriosclerosis, thrombosis, and vascular biology. 2000;20:10–17. doi: 10.1161/01.atv.20.1.10. [DOI] [PubMed] [Google Scholar]
- 18.Winer S, Chan Y, Paltser G, Truong D, Tsui H, Bahrami J, Dorfman R, Wang Y, Zielenski J, Mastronardi F, Maezawa Y, Drucker DJ, Engleman E, Winer D, Dosch HM. Normalization of obesity-associated insulin resistance through immunotherapy. Nat Med. 2009;15:921–929. doi: 10.1038/nm.2001. [DOI] [PMC free article] [PubMed] [Google Scholar]
- 19.Yang H, Youm YH, Vandanmagsar B, Ravussin A, Gimble JM, Greenway F, Stephens JM, Mynatt RL, Dixit VD. Obesity increases the production of proinflammatory mediators from adipose tissue T cells and compromises TCR repertoire diversity: implications for systemic inflammation and insulin resistance. J Immunol. 2010;185:1836–1845. doi: 10.4049/jimmunol.1000021. [DOI] [PMC free article] [PubMed] [Google Scholar]
- 20.Clemente MJ, Przychodzen B, Jerez A, Dienes BE, Afable MG, Husseinzadeh H, Rajala HL, Wlodarski MW, Mustjoki S, Maciejewski JP. Deep sequencing of the T-cell receptor repertoire in CD8+ T-large granular lymphocyte leukemia identifies signature landscapes. Blood. 2013;122:4077–4085. doi: 10.1182/blood-2013-05-506386. [DOI] [PMC free article] [PubMed] [Google Scholar]
- 21.Marrero I, Hamm DE, Davies JD. High-throughput sequencing of islet-infiltrating memory CD4+ T cells reveals a similar pattern of TCR Vbeta usage in prediabetic and diabetic NOD mice. PLoS One. 2013;8:e76546. doi: 10.1371/journal.pone.0076546. [DOI] [PMC free article] [PubMed] [Google Scholar]
- 22.Kawakami N, Nagerl UV, Odoardi F, Bonhoeffer T, Wekerle H, Flugel A. Live imaging of effector cell trafficking and autoantigen recognition within the unfolding autoimmune encephalomyelitis lesion. J Exp Med. 2005;201:1805–1814. doi: 10.1084/jem.20050011. [DOI] [PMC free article] [PubMed] [Google Scholar]
- 23.Vanderlugt CL, Miller SD. Epitope spreading in immune-mediated diseases: implications for immunotherapy. Nat Rev Immunol. 2002;2:85–95. doi: 10.1038/nri724. [DOI] [PubMed] [Google Scholar]
- 24.Turner SJ, Doherty PC, McCluskey J, Rossjohn J. Structural determinants of T-cell receptor bias in immunity. Nat Rev Immunol. 2006;6:883–894. doi: 10.1038/nri1977. [DOI] [PubMed] [Google Scholar]
- 25.Youn JC, Yu HT, Lim BJ, Koh MJ, Lee J, Chang DY, Choi YS, Lee SH, Kang SM, Jang Y, Yoo OJ, Shin EC, Park S. Immunosenescent CD8+ T Cells and C-X-C Chemokine Receptor Type 3 Chemokines Are Increased in Human Hypertension. Hypertension. 2013;62:126–133. doi: 10.1161/HYPERTENSIONAHA.113.00689. [DOI] [PubMed] [Google Scholar]
- 26.Wu J, Thabet SR, Kirabo A, Trott DW, Saleh MA, Xiao L, Madhur MS, Chen W, Harrison DG. Inflammation and mechanical stretch promote aortic stiffening in hypertension through activation of p38 mitogen-activated protein kinase. Circ Res. 2014;114:616–625. doi: 10.1161/CIRCRESAHA.114.302157. [DOI] [PMC free article] [PubMed] [Google Scholar]
- 27.Bluthmann H, Kisielow P, Uematsu Y, Malissen M, Krimpenfort P, Berns A, von Boehmer H, Steinmetz M. T-cell-specific deletion of T-cell receptor transgenes allows functional rearrangement of endogenous alpha- and beta-genes. Nature. 1988;334:156–159. doi: 10.1038/334156a0. [DOI] [PubMed] [Google Scholar]
- 28.Guyton AC. Abnormal renal function and autoregulation in essential hypertension. Hypertension. 1991;18:III49–53. doi: 10.1161/01.hyp.18.5_suppl.iii49. [DOI] [PubMed] [Google Scholar]
- 29.Feau S, Garcia Z, Arens R, Yagita H, Borst J, Schoenberger SP. The CD4(+) T-cell help signal is transmitted from APC to CD8(+) T-cells via CD27-CD70 interactions. Nat Commun. 2012;3:948. doi: 10.1038/ncomms1948. [DOI] [PMC free article] [PubMed] [Google Scholar]
- 30.Menoret S, Guillonneau C, Bezie S, Caron L, Anegon I, Li XL. Phenotypic and functional characterization of CD8(+) T regulatory cells. Methods Mol Biol. 2011;677:63–83. doi: 10.1007/978-1-60761-869-0_5. [DOI] [PubMed] [Google Scholar]
- 31.Murakami M, Sakamoto A, Bender J, Kappler J, Marrack P. CD25+CD4+ T cells contribute to the control of memory CD8+ T cells. Proc Natl Acad Sci U S A. 2002;99:8832–8837. doi: 10.1073/pnas.132254399. [DOI] [PMC free article] [PubMed] [Google Scholar]
- 32.Shevach EM, McHugh RS, Piccirillo CA, Thornton AM. Control of T-cell activation by CD4+ CD25+ suppressor T cells. Immunol Rev. 2001;182:58–67. doi: 10.1034/j.1600-065x.2001.1820104.x. [DOI] [PubMed] [Google Scholar]
Associated Data
This section collects any data citations, data availability statements, or supplementary materials included in this article.