CHARGE syndrome is a multiple anomaly disorder that presents with a variety of phenotypes, including ocular coloboma, heart defects, choanal atresia, retarded growth and development, genitourinary hypoplasia, and ear abnormalities1. Although 70-90% of CHARGE syndrome cases result from mutations in CHD7, encoding an ATP-dependent chromatin remodeler, the pathways underlying the diverse phenotypes remain poorly understood2. Surprisingly, our studies of a knock-in mutant mouse strain expressing a stabilized and transcriptionally-dead variant of the p53 tumor suppressor protein (p5325,26,53,54)3, along with a wild-type p53 allele, have revealed late-gestational embryonic lethality associated with a host of phenotypes characteristic of CHARGE, including coloboma, inner and outer ear malformations, heart outflow tract defects, and craniofacial defects. We find that the p5325,26,53,54 mutant protein can stabilize and hyperactivate wild-type p53 to inappropriately induce its target genes and trigger cell-cycle arrest or apoptosis during development. Importantly, these phenotypes are only observed with a wild-type p53 allele, as p5325,26,53,54/− embryos are fully viable. We find further that Chd7 can bind to the p53 promoter, thereby negatively regulating p53 expression, and that Chd7 loss in neural crest cells (NCC) or CHARGE patient samples results in p53 activation. Strikingly, we find that p53-heterozygosity partially rescues the phenotypes in Chd7-null embryos, demonstrating that p53 contributes to phenotypes resulting from Chd7 loss. Thus, inappropriate p53 activation during development can promote CHARGE phenotypes, supporting a critical role for p53 in developmental syndromes and providing key new insight into the mechanisms underlying CHARGE syndrome.
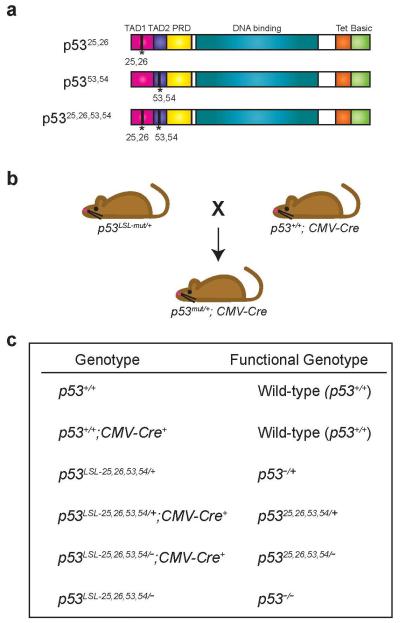
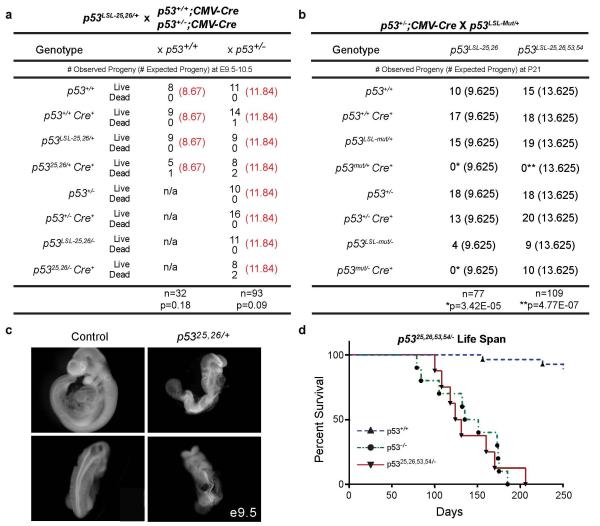
Unrestrained p53 activity induced by loss of the negative regulators Mdm2 or Mdm4 causes early embryonic lethality4. To explore the role of p53 transcriptional activation in promoting developmental failure, we examined embryonic development in knock-in mice carrying mutations in the first or both of p53’s two transcriptional activation domains (p5325,26 and p5325,26,53,54; Fig. 1a, Extended-Data Fig. 1). These mutations both disrupt the p53-Mdm2 interaction – recapitulating loss of Mdm2 regulation – and compromise transactivation3. Expression of p5325,26, which is severely impaired for transactivating most p53 target genes, caused early embryonic lethality (E10.5; Extended-Data Fig. 2a-c)5. Surprisingly, p5325,26,53,54/+ embryos also exhibited embryonic lethality, but between E13.5-15.5 (Extended-Data Table 1-2). Lethality associated with p5325,26,53,54 depended on a wild-type p53 allele, as p5325,26,53,54/− adult mice were viable (Extended-Data Fig. 2b, 2d). This contrasts with p5325,26/− mice, which displayed embryonic lethality, likely due to the residual transactivation potential of p5325,26 on genes like Bax3 (Extended-Data Fig. 2a-b). Our findings both underscore the importance of transactivation for embryonic lethality induced by stabilized p53, as p5325,26,53,54/− mice are viable, and reveal an intriguing genetic interaction between transactivation-dead p5325,26,53,54 and wild-type p53 during development.
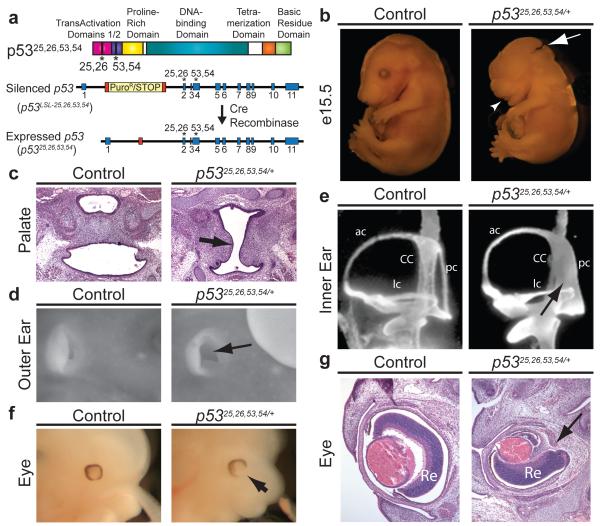
Figure 1. p5325,26,53,54/+ Embryos Exhibit Lethality and Diverse Craniofacial Defects Characteristic of CHARGE Syndrome.
(a) p53 TAD mutant allele with L25Q, W26S, F53Q, F54S mutations. Cre deletes Lox-Stop-Lox (LSL) cassette, inducing p5325,26,53,54 expression. (b) Exencephaly (63%, n=35; arrow) and short lower jaw (74%, n=27; arrowhead) in E15.5 p5325,26,53,54/+ embryo. (c) Cleft palate (arrow) in E15.5 p5325,26,53,54/+ embryo. (n=3). (d) Absent external ear pinna (arrow) of E15.5 p5325,26,53,54/+ embryo. (47%, n=17). (e) Posterior semicircular canal (pc) fused to common crus (CC; arrow) in E13.5 p5325,26,53,54/+ inner ear. ac-anterior canal, lc-lateral canal. (71%, n=12). (f) Coloboma (arrow) in E13.5 p5325,26,53,54/+ embryo. (59%, n=17). (g) Retinal coloboma (Re; arrow) in E15.5 p5325,26,53,54/+ embryo.
Analysis of p5325,26,53,54/+ embryos identified a host of gender-independent developmental phenotypes absent in littermate controls (Fig. 1-2, Extended-Data Fig. 3-4). E13.5 and older p5325,26,53,54/+ embryos commonly displayed exencephaly, as well as craniofacial defects, including square-shaped faces, short lower jaws, cleft lip, and cleft palate (Fig. 1b-c, Extended-Data Fig. 4a-b). Furthermore, p5325,26,53,54/+ embryos displayed defects in external ear formation (Fig. 1d) and a spectrum of inner ear defects, ranging from mild, with the posterior semi-circular canal either truncated or fused to the common crus (Fig. 1e), to highly abnormal, with extreme inner ear bone malformation. We also observed retinal coloboma in p5325,26,53,54/+ embryos (Fig. 1f-g). As a potential contributor to the craniofacial defects, we examined osteogenesis6 and found delayed bone formation in p5325,26,53,54/+ embryos, suggesting growth retardation (Extended-Data Fig. 4c). Notably, this constellation of phenotypes is reminiscent of those in human CHARGE syndrome. In particular, the combined presentation of coloboma and inner ear defects is characteristic of CHARGE and rarely occurs in other conditions7.
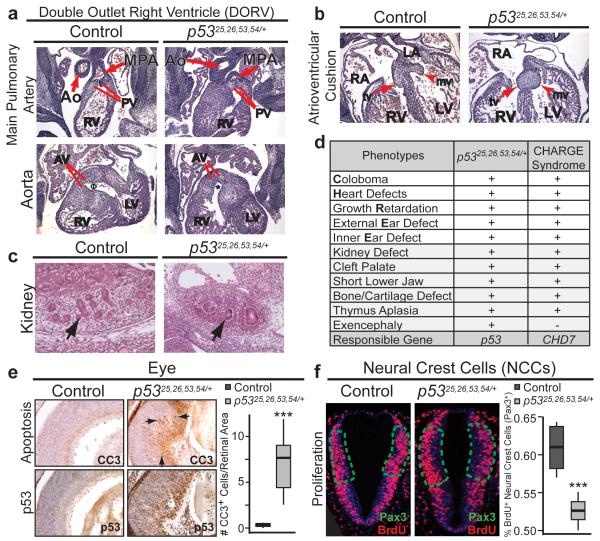
Figure 2. p5325,26,53,54/+ Embryos Exhibit Additional Features of CHARGE Syndrome and p53-Dependent Cellular Responses.
(a) Double outlet right ventricle (DORV) in E13.5 p5325,26,53,54/+ heart (50%, n=6). Top: Main pulmonary artery (MPA) connects via pulmonary valve (PV) to right ventricle (RV) in both control and p5325,26,53,54/+ embryo. Bottom: Aorta (Ao) in control embryo connects to left ventricle (LV) via aortic valve (AV)Φ. Aorta in p5325,26,53,54/+ embryo connects to RV via AV*. (b) Abnormal atrioventricular cushions in E13.5 p5325,26,53,54/+ heart (75%, n=4) fail to elongateinto mature mitral (mv, arrowhead) and tricuspid (tv, arrow) valves. RA: right atrium; LA: left atrium. (c) E13.5 p5325,26,53,54/+ kidneys are smaller (79%), with fewer average glomeruli (13 vs. 3; n=5; arrows), than controls. (d) p5325,26,53,54/+ embryonic phenotypes observed in CHARGE (+present, −absent). (e) Left: Cleaved-caspase 3 (CC3; Top) and p53 (Bottom) immunohistochemistry in E15.5 retinas. Arrows: CC3-positive cells. Right: CC3-positive cells per retinal area. ***p-value=0.007; one-tailed Welsh’s t-test (n=5). (f) BrdU immunofluorescence in E9.5 Pax3+ NCCs (delineated by green-dotted line; Extended-Data Fig. 6c). Right: Percentage BrdU-positive cells per total Pax3+ NCCs ***p-value=0.004 one-tailed Student’s t-test (n=4).
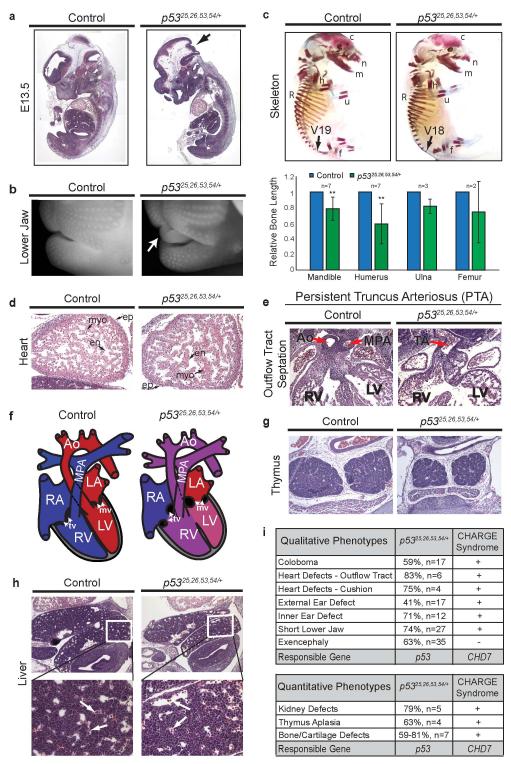
Given this phenotypic overlap with CHARGE, we examined whether p5325,26,53,54/+ embryos display other CHARGE-related characteristics8-10. Hearts in p5325,26,53,54/+ embryos possessed the full complement of cell types (Extended-Data Fig. 4d), but displayed outflow tract defects (Persistent Truncus Arteriosus and Double Outlet Right Ventricle; Fig. 2a, Extended-Data Fig. 4e-f) accompanied by ventricular septation defects (not shown). The atrioventricular cushions also failed to remodel, foreshadowing potential heart valve defects (Fig. 2b, Extended-Data Fig. 4f). Notably, outflow tract and atrioventricular septation defects are highly overrepresented in CHARGE patients compared to individuals with isolated congenital heart disease11. Additionally, kidneys and thymi in p5325,26,53,54/+ embryos were smaller than in controls, and kidneys displayed branching defects (Fig. 2c, Extended-Data Fig. 4g). These phenotypes contrasted with the liver, which exhibited normal architecture and hematopoiesis (Extended-Data Fig. 4h). Evaluation for choanal atresia and external genital defects – features of CHARGE – was precluded by late-gestational embryonic lethality. Importantly, p53-null embryos did not display CHARGE-like phenotypes, suggesting that these phenotypes result from p53 activation (Extended-Data Fig. 5)12-14. Collectively, analysis of p5325,26,53,54/+ embryonic phenotypes revealed a strong similarity to CHARGE patient phenotypes (Fig. 2d, Extended-Data Fig. 4i), including the hallmarks of coloboma, ear malformations, and heart defects. Additionally, we observed exencephaly and late-gestation lethality, neither of which is commonly reported in CHARGE. However, it remains possible that CHARGE fetuses with more severe phenotypes die in utero15,16.
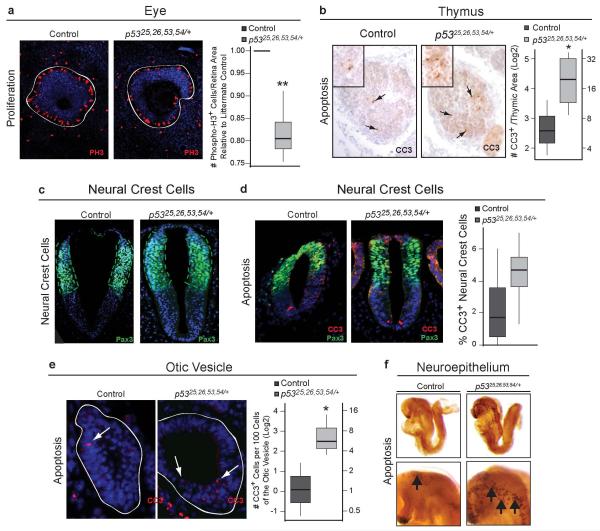
To understand the underlying cellular basis for the p5325,26,53,54/+ embryonic phenotypes, we examined whether p53 apoptotic or cell-cycle arrest responses were induced. Analysis of the retina, which is affected in coloboma, and NCCs, which are responsible for some CHARGE phenotypes, revealed increased apoptosis and decreased proliferation in p5325,26,53,54/+ embryos compared to controls (Fig. 2e-f, Extended-Data Fig. 6a, c-d). Similar results were observed in other tissues affected in CHARGE, including the thymus, neuroepithelium, and otic vesicles (Extended-Data Fig. 6b, 6e-f). Thus, both increased apoptosis and reduced proliferation contribute to p5325,26,53,54/+ embryonic phenotypes.
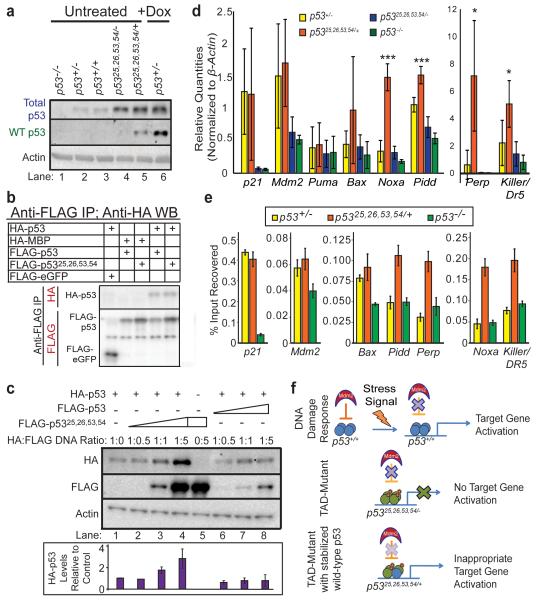
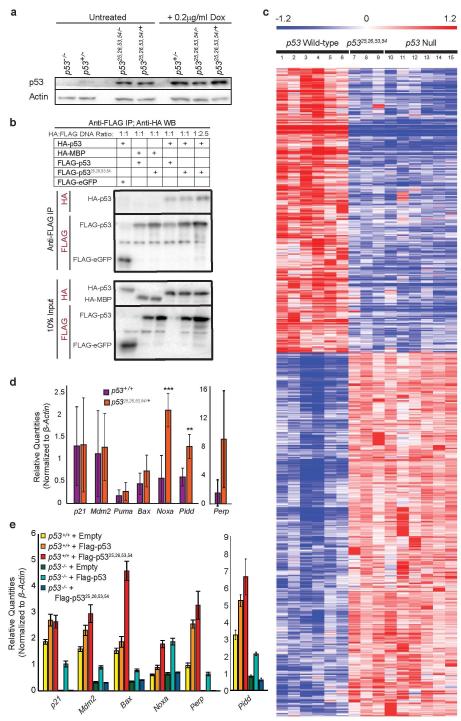
We next investigated the molecular mechanisms through which p5325,26,53,54 triggers CHARGE-associated phenotypes. Mutation of p53 residues 25,26 inhibits Mdm2 interaction, resulting in inappropriate p5325,26,53,54 protein stabilization, as seen in untreated p5325,26,53,54/+ and p5325,26,53,54/− mouse embryo fibroblasts (MEFs) compared to untreated p53+/− MEFs (Fig 3a, Extended-Data Fig. 7a). Using co-transfection/immunoprecipitation, we showed that p5325,26,53,54 interacts with wild-type p53 (Fig. 3b, Extended-Data Fig 7b). Moreover, overexpressing increasing amounts of FLAG-p5325,26,53,54 (lanes 2-4), but not FLAG-p53 (lanes 6-8), caused HA-p53 protein accumulation (Fig. 3c). Similarly, immunoblot analysis with a wild-type p53-specific antibody revealed increased wild-type p53 protein in untreated p5325,26,53,54/+ MEFs (lane 5) relative to untreated p53+/− or p53+/+ MEFs (lanes 2-3; Fig. 3a). To examine the effects of increased wild-type p53, we examined p53 target gene expression in p5325,26,53,54/+ and control MEFs. p5325,26,53,54 alone displayed no transcriptional activity, as seen in genome-wide microarray analyses (Extended-Data Fig. 7c)3 and individual gene qRT-PCR assays comparing p5325,26,53,54/− and p53−/− MEFs (Fig. 3d). In contrast, p5325,26,53,54 combined with wild-type p53 drove elevated expression of select p53 target genes, including Noxa and Pidd, but not p21 and Mdm2, relative to levels in p53+/− and p53+/+ MEFs, suggesting that p5325,26,53,54 activates wild-type p53 to induce expression of specific p53 target genes (Fig. 3d, Extended-Data Fig. 7d). Similarly, overexpression of p5325,26,53,54, but not wild-type p53, in p53+/+ MEFs significantly enhanced expression of select p53 target genes (Extended-Data Fig. 7e). Quantitative-ChIP analyses revealed that this selective target gene activation resulted from increased p53 binding to response elements of particular target genes in p5325,26,53,54/+ MEFs compared to p53+/− MEFs (Fig. 3e). This pattern likely reflects different affinities of p53 binding sites for p53, such that p53 can only bind and activate transcription from lower affinity p53 binding sites, such as those in Noxa and Pidd, when sufficiently stabilized, as in the presence of both p5325,26,53,54 and wild-type p5317. Collectively, these findings suggest that in p5325,26,53,54/+ embryos, p5325,26,53,54 interacts with and stabilizes wild-type p53, likely by compromising Mdm2 interaction, and activates p53 to inappropriately induce target gene expression, cell-cycle arrest/apoptosis, and CHARGE-like phenotypes (Fig. 3f).
Figure 3. p5325,26,53,54 Interacts with and Increases Wild-Type p53 Levels and Activity.
(a) Immunoblot for total p53 (top row) and wild-type (WT) p53 (2nd row) in untreated and doxorubicin (Dox)-treated MEFs. Actin loading control. (b) Anti-FLAG immunoprecipitation from p53−/− MEFs transiently overexpressing HA-p53 and FLAG-p53 or FLAG-p5325,26,53,54. Negative controls: HA-MBP, FLAG-eGFP. *See Extended-Data Figure 7b (c) Immunoblot of p53−/− MEFs transiently overexpressing HA-p53 and increasing amounts of FLAG-p53 or FLAG-p5325,26,53,54. Bottom: Average+/−s.d. HA-p53 protein levels relative to lane 1 and normalized to Actin. (n=3). (d) p53 target gene expression in untreated MEFs. Averages+/−s.d. normalized to β-actin. (n=4) *,***p-values<0.05,<0.005 comparing p5325,26,53,54/+ and p53+/− MEFs by two-tailed Student’s t-test. (e) Representative of duplicate p53 ChIP analyses of p53 target genes in MEFs, relative to input DNA. (f) Proposed model for how p5325,26,53,54 affects p53 activity.
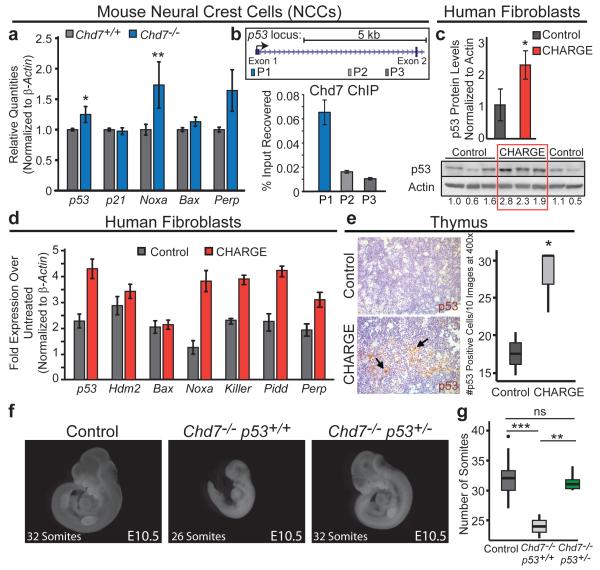
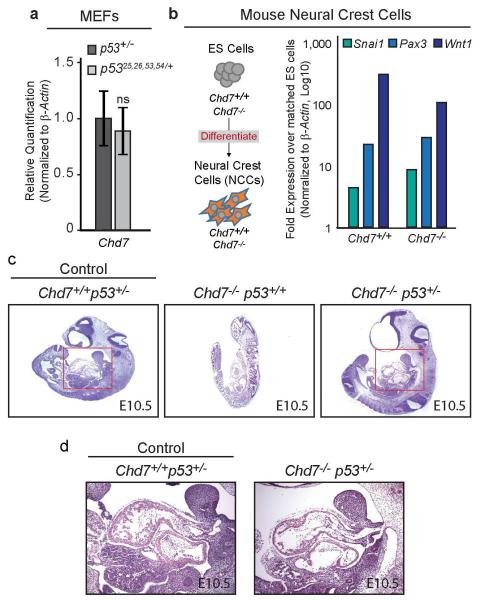
These observations suggested that p53 may respond to Chd7 status and play a role in CHARGE syndrome. Analysis of Chd7 expression in p53+/− and p5325,26,53,54/+ MEFs revealed no significant difference, suggesting that altered Chd7 levels do not explain the CHARGE-like phenotypes in p5325,26,53,54/+ embryos (Extended-Data Fig. 8a). We next assessed whether p53 responds to changes in Chd7 status15,16,18,19. Indeed, p53 and select p53 target genes were induced in Chd7-null NCCs (Fig. 4a, Extended-Data Fig 8b). Interestingly, ChIP analyses showed that Chd7 binds the p53 promoter in NCCs, suggesting that Chd7 negatively regulates p53 expression, providing a mechanism by which Chd7 loss might contribute to a p53 response (Fig. 4b), although not excluding the possibility that Chd7 deficiency could also activate p53 through other mechanisms. To query p53 activation in CHARGE syndrome directly, we analyzed CHD7-mutation-positive CHARGE patient fibroblasts and found increased basal p53 protein levels as well as target gene induction following mild stress, relative to controls (Fig. 4c-d). Similarly, analysis of thymi showed more p53-positive thymocytes in CHD7-mutation-positive CHARGE fetuses than in unaffected fetuses (Fig. 4e). Thus, p53 is activated in Chd7- null NCCs and in human CHARGE patient fibroblasts and tissue. To establish the role of p53 downstream of Chd7 loss, we tested whether Chd7-null phenotypes are rescued by p53-heterozygosity. We found that the characteristic Chd7-null phenotypes of severe developmental delay and generalized hypoplasia at E10.5 are significantly rescued on a p53+/− background. Specifically, heart development and somite number – an indicator of developmental stage – are rescued, while limb, forebrain, and facial morphogenesis are partially rescued (Fig. 4f-g, Extended-Data Fig. 8c-d). Thus, p53-heterozygosity rescues phenotypes caused by Chd7 inactivation, although incompletely, consistent with the existence of both p53-dependent and p53-independent responses downstream of Chd7 loss. Collectively, these findings demonstrate that Chd7 deficiency provokes p53 activation and p53-dependent phenotypes.
Figure 4. p53 is Activated Upon Chd7 Deficiency and Contributes to Chd7-null Phenotypes.
(a) p53 target gene expression in Chd7+/+ and Chd7−/− (whi/whi) NCCs. Averages+/−s.e.m. normalized to β-actin (n=5). *,**p-values<0.05,<0.01, one-tailed Mann-Whitney test. (b) Top: 5′ end of p53 locus. Bottom: Representative of triplicate ChIP analyses of Chd7 binding at p53 promoter (P1) and negative control open-chromatin regions (P2 and P3), relative to input. +/−s.d. of technical triplicates. (c) Bottom: p53 immunoblot of human fibroblasts derived from unaffected and CHARGE patients. (Below: p53 levels after normalization to Actin.) Top: Averages+/−s.d of p53 levels. *p-value=0.015, one-tailed Student’s t-test. (d) p53 target gene expression in low-serum treated human fibroblast cells derived from unaffected and CHARGE patients relative to untreated samples. 5 CHARGE cell lines analyzed in duplicate. Representative cell line pair is shown, +/−s.d. of technical triplicates. (e) Left, p53 immunohistochemistry on thymi from fetuses with CHARGE syndrome and unaffected fetuses. Arrows: p53-positive cells. Right, The number of p53-positive cells per ten fields at 400× magnification, from one section. (f) Comparison to control and Chd7−/−p53+/+ embryos reveals partial rescue of E10.5 Chd7−/−p53+/− embryos. (Chd7−/− p53+/+: n=3; Chd7−/−p53+/−: n=6). (g) Embryo somite number for each genotype. ns=non-significant, **,***p-value=0.0024,0.00032, two-tailed Student’s t-test.
Our p5325,26,53,54/+ mouse strain provides a new model to study features relevant to CHARGE syndrome. Mouse models for CHARGE syndrome have been generated previously through ENU mutagenesis or targeting of the Chd7 locus20,21. While Chd7−/− mutants display embryonic lethality ~E10.5, Chd7+/− mutants are viable, exhibiting defects of the inner ear, heart, external genitalia, and choanae/palate20,21. In the inner ear, Chd7+/− mice display truncated lateral semicircular canals (SCCs) and variably truncated posterior SCCs20,22, whereas p5325,26,53,54/+ embryos primarily exhibit posterior SCC defects or defects in all three SCCs, similar to CHARGE patients, in which all three SCCs are often involved23. Interestingly, Chd7+/− mice are not reported to display the CHARGE hallmarks of coloboma or cardiac outflow tract defects. Thus, the presence of extensive ear defects, heart defects, and coloboma in p5325,26,53,54/+ embryos highlights the utility of our model for recapitulating a broader form of CHARGE, potentially representing a phenotype intermediate in severity between Chd7+/− and Chd7−/− mutants.
Interestingly, the collection of phenotypes in p5325,26,53,54/+ embryos represents one in a spectrum of mouse models whereby varying levels of p53 activity trigger different phenotypes. Unlike Mdm2-deficiency, which results in stabilized, fully active wild-type p53, the combination of wild-type p53 and p5325,26,53,54 in p5325,26,53,54/+ embryos results in modest p53 activation, causing lethality and phenotypes less severe than Mdm2 loss24. The p5325,26,53,54/+ embryonic phenotypes also contrast with those seen in other hyperactive-p53 mouse models, including one where expression of a carboxy-terminal p53 fragment causes premature aging, and another where reduced Mdm2 expression triggers lymphopenia and reduced body weight in adults25-27. In these models, phenotypes manifested without enhanced basal p53 activity or increased p53 stabilization, respectively, potentially explaining the lack of embryonic lethality and the milder phenotypes than in p5325,26,53,54/+ embryos.
Mechanistically, our observation that p53 activation is sufficient to cause CHARGE-like phenotypes in mice suggested that activated p53 could similarly provoke the characteristic defects in human CHARGE. Indeed, p53 expression and activity are increased with Chd7 deficiency, and phenotypes triggered by Chd7 loss are partially rescued by p53-heterozygosity. This contrasts with a study where p53 morpholinos failed to rescue Chd7 deficiency in zebrafish, perhaps reflecting species-specific differences28. p53 may also function independently of CHD7 to induce CHARGE features, a possibility relevant in the ~10-30% of cases where CHD7 is not mutated. p53 could become activated in response to other genetic alterations found in CHARGE or the p53 pathway could itself be mutated in some CHARGE cases. Our sequencing analysis of the p53 coding region in 25 CHD7-mutation-negative CHARGE patients failed to reveal any mutations, potentially because modest p53 activation may be difficult to achieve by point mutation, suggesting that mutations in p53 cis-regulatory regions or pathway components may be more likely. Significantly, p53 may act as a common node for developmental defects not only in CHARGE but also in other developmental syndromes, such as 22q11 deletion syndrome29. Indeed, p53 activation by ribosome dysfunction provokes NCC deficiency and craniofacial defects30. Future studies will reveal precisely how p53 contributes to CHARGE syndrome and potentially the broader spectrum of human craniofacial-cardiac developmental syndromes.
METHODS SECTION
Mouse Breeding and Analysis
Conditional p53 mutant mice were described previously3,5. p53LSL-mut/+ males were crossed to CMV-Cre females and timed pregnancies conducted31. Genotyping analysis was performed using yolk sac DNA. Males were identified using the Y-chromosome-specific Zfy PCR. As reported31, we observed mosaic Cre activity in some embryos, reflected by incomplete or no Lox-Stop-Lox deletion in PCR analysis of yolk sac and in p53 immunohistochemical analysis in embryos. Embryos that showed little to no recombination of the Lox-Stop-Lox allele were kept separate for all analyses. In the text and figure labels, the Cre nomenclature for both control and p5325,26,53,54/+ embryos is excluded for simplicity. The genotypes of p5325,26,53,54/+ mice carrying a CMV-Cre transgene lack the LSL designation because the Lox-Stop-Lox element has been deleted from the genome. Controls in analyses comprise littermate embryos both with and without the CMV-Cre transgene (Extended-Data Figure 3). Mice were maintained on a mixed 129/Sv;C57BL/6J background. Chd7-deficient gene-trapped mice were described previously21. Controls for embryo somite number rescue analysis comprise Chd7+/+p53+/+, Chd7+/+p53+/−, Chd7+/−p53+/+, and Chd7+/−p53+/− embryos. Sample sizes were estimated based on previous work in embryogenesis in order to be able to reach statistically significant conclusions. For example, using a χ2-test we can estimate it would require 24 embryos in order to obtain a significance level of 5% if all homozygous embryos were inviable and from a heterozygous mating where homozygotes should represent 25% of total based on Mendelian ratio. All animal work was done in accordance with the Stanford University APLAC.
Embryo Tissue Analysis
Embryos were examined under a dissecting microscope for the presence of a heartbeat and for other abnormalities, in a blinded fashion, prior to genotyping, and photographs of either fixed or live embryos were taken using the dissecting microscope. Live mice are determined by the presence of a heartbeat. All analyses were performed on embryos of specified ages as determined by the expected stage of tissue and organ development in control embryos. Within age groups, embryos were randomly assigned for analysis of individual tissues. Heart, inner ear, and craniofacial analysis was performed with the assistance of collaborators who were blinded to the genotypes. Histological analysis was performed on hematoxylin and eosin-stained paraffin-embedded sagittal, coronal, or transverse embryo sections using standard protocols. Consecutive 7 μm sections were evaluated for heart and craniofacial analyses. Whole-mount images for craniofacial analysis were created by staining embryos in 70% ethanol with ethidium bromide and imaging with UV light. Whole-mount cleaved-caspase 3 staining was performed as described32 with anti-cleaved-caspase 3 antibody (Cell Signaling #9664) and developed with DAB (Vector Labs). Immunohistochemistry and immunofluorescence were performed as described with anti-cleaved-caspase 3 antibody (Cell Signaling #9664), anti-BrdU (BD Bioscience 347580), anti-p53 (CM5, Vector Labs), anti-Pax3 (Iowa Developmental Studies Hybridoma Bank) and human anti-p53 (Ab1801, Santa Cruz Biotechnology) on paraformaldehyde-fixed, paraffin-embedded tissue and developed with either DAB (Vector Labs) or imaged with confocal microscope. For BrdU staining, embryos were pulsed prior to dissection for 20 minutes with 0.1mg/gram of body weight. Cleaved-Caspase 3 and BrdU positive cells were quantified and normalized to area, number of sections, or total cell number. Bone and cartilage staining was performed as described using Alizarin Red and Alcian Blue to stain bone and cartilage, respectively33. Bone lengths were quantified from measurements on photomicrographs taken at 6.3×. The areas of the kidney and thymus were calculated from measurements on photomicrographs taken at 200X magnification. Inner ear analysis using the paint-fill assay was performed as described; paint-filled ears were imaged in brightfield using a Leica DMRB stereoscope34. All individuals with affected ears that could be scored for both ears exhibited a similar severity of the defect in the two ears. Additionally, while different types of analyses precluded investigation of all phenotypes in particular embryos, these defects commonly occurred in combination: for example, coloboma and inner ear defects occurred together in 57% of p5325,26,53,54/+ embryos examined.
qRT-PCR
For qRT-PCR, MEFs were cultured at subconfluency, RNA was isolated by Trizol extraction and reverse transcribed using MMLV reverse transcriptase (Invitrogen) and random primers, and PCR was performed in triplicate using SYBR green (Qiagen, Bio-Rad) and mouse-specific primers for each gene (Supplemental Methods Table 1a) in a 7900HT Fast Real-Time PCR machine (Applied Biosystems). Results were computed relative to a standard curve made with cDNA pooled from all samples3. Human fibroblasts were cultured at subconfluency in DMEM with 20% serum or 0.1% serum for 24 hour prior to RNA isolation by Trizol extraction and qRT-PCR performed as above using SYBR Green and human-specific primers for each gene (Supplemental Methods Table 1b).
Cell Culture, Western Blot Analysis, and Immunoprecipitation
Mouse embryo fibroblasts (MEFs) were derived from E13.5 embryos. For stable overexpressing MEF lines, wild-type and p53-null MEFs were transduced with pWZL-based retroviruses expressing FLAG-p53+, FLAG-p5325,26,53,54, or empty vector as described5. Mutant p53 constructs were made via site-directed mutagenesis to bear L25Q;W26S and F53Q;F54S mutations found to incapacitate p53’s transactivation capability. In summary, a p53 cDNA, generated from mouse embryonic fibroblast RNA, was amplified and engineered with Asc1 and Pac1 restriction enzyme sites using primers against the second amino acid through the STOP codon. The amplified DNA was subcloned into a pBlueScript construct with the multiple cloning site replaced with Asc1 and Pac1 sites. The p53 cDNA underwent site-directed mutagenesis (TTATGG -> CAATCG and TTTTTT -> CAGTCT) to generate the four mutations. The mutated p53 cDNA was confirmed by sequencing and subcloned into the appropriate expression vectors (pWZL or pcDNA) that contain 3 copies of either the HA or FLAG tag at the N-terminus and Asc1 and Pac1 sites instead of the multiple cloning sites. For Western blot analysis, cells were left untreated, treated with 0.2μg/ml doxorubicin (Dox) for eight hours, or transfected using X-tremeGENE HP (Roche) for 24 hours with pcDNA constructs (FLAG-p53, FLAG-p5325,26,53,54, HA-p53, or empty vector). Cells were collected and lysed using RIPA buffer. Western blots were probed with anti-p53 (1:500 CM5 Vector), anti-wild-type p53 (pAB242, kind gift of David Lane and Borivoj Vojtesek)35, anti-FLAG (1:1000 Sigma F3165), anti-HA (1:1000 Sigma H6908), and anti-Actin (1:30,000 Sigma A2228). Immunoprecipitation was performed on MEFs transfected with pcDNA constructs (FLAG-p53, FLAG-p5325,26,53,54, HA-p53, FLAG-eGFP, or HA-MBP) using M2 anti-FLAG agarose beads (Sigma A2220). Dox-treated p53+/− (Figure 3a, Lane 6) and p5325,26,53,54/− (Figure 3a, Lane 4) MEFs control for wild-type p53-specific antibody activity and specificity, respectively. Cells were lysed using RIPA buffer, lysates were added to anti-FLAG beads to allow binding of FLAG protein, and bound protein was retrieved by addition of sample buffer and centrifugation of beads. 10% input was used for western blot analysis. Human fibroblasts were grown in DMEM with 20% serum and lysed using RIPA buffer or incubated in 0.1% serum for 24 hours prior to collection for RNA. Western blots were probed with anti-p53 (DO-1, Santa Cruz Biotechnology). Differentiation of mouse Chd7+/+ and Chd7−/− (whi/whi) embryonic stem cells (ESCs) into neural crest cells (NCCs) was performed using an adaptation of a previously-described protocol18,19 that was further characterized by Rada-Iglesias et al36. Importantly, loss of Chd7 leads to defects in migratory neural crest cells, without affecting induction of neural crest cells, allowing generation of the cells for this analysis18. Validation of Neural Crest Cell phenotype was performed by assessing gene expression of neural crest cell markers, Wnt1, Snai1, and Pax3 (Supplemental Methods Table 1a).
Chromatin Immunoprecipitation
Analysis of p53 binding was performed on Mouse Embryonic Fibroblasts of different genotypes. 30-40×10^7 cells were collected for Chromatin Immunoprecipitation (ChIP), as previously described, using anti-p53 (CM5, Vector Laboratories)37. In brief, cells were crosslinked following trypsinization with 1% formaldehyde and quenched with glycine. Chromatin was sheared using Bioruptor sonicator (Diagenode), then immunoprecipitated with anti-p53–Dynabeads complex overnight. IP’d DNA was washed, and reverse-crosslinked and isolated using Qiagen PCR clean-up kit. IP’d DNA was analyzed using qPCR using binding site specific primers (Supplemental Methods Table 2) and normalized to input. Analysis of p53 binding site affinities was based on previously reported ChIP-seq data and a p53-binding site algorithm17,37. Analysis of Chd7 binding was performed using anti-Chd7 on neural crest-like cells differentiated from wild-type or Chd7-null (whi/whi) Embryonic Stem Cells using the same protocol as above18.
Human Samples
All human work was conducted under human subjects protocols approved by the Stanford Institutional Review Board (IRB), the University of Michigan UM-IRBMED, and the Ethical Committee of d’Ile de France II (N° 2009-164). Informed consent was obtained from participants in the study. Human fibroblasts were obtained by skin biopsy under local anesthesia from CHARGE patients with CHD7 mutations and unaffected patients. Thymi were obtained from pregnancies terminated for severe malformations, in accordance with French law, after genetic counselling, between 24 and 37 weeks of gestation. Detailed clinicopathological examination allowed the diagnosis of CHARGE syndrome, confirmed by CHD7 molecular analysis that identified a de novo nonsense mutation in each. Age matched control thymi were obtained from fetuses with isolated brain malformation.
TP53 exome sequence was analyzed in a group of 25 CHD7-mutation-negative patients with features of CHARGE syndrome, which were selected in the cohort based on the availability of parental DNA for segregation analysis, in case a variant was found. All TP53 coding exons were analyzed by direct sequencing of PCR products comprising the 10 coding exons and the adjacent intronic junctions of TP53 isoform 2 (exons 2 to 11, reference sequence NM_001126112.2) and the alternatively spliced exon 10 of isoforms 3 and 4 (reference sequences NM_001126114.2 and NM_001126113.2). This analysis failed to reveal any mutations within the coding region (i.e. no sequence changes apart from already known SNPs).
Statistical Analysis
Statistical tests used were the Student’s t-test (equal variance), Welsh’s t-test (unequal variance), Mann-Whitney test (non-parametric test), and Binomial Distribution test. Due to presence of embryos with little or no recombination of the Lox-Stop-Lox allele, Binomial Distribution analysis was used to exclude these embryos and determine statistical significance for the viability of p5325,26,53,54/+ embryos at each embryonic timepoint. Additional statistical analysis, with the assistance of the Stanford Biostatistics Core, was performed to assess viability over multiple embryonic timepoints of CMV-Cre;p5325,26,53,54/+ embryos that were recombined versus not recombined, as scored by PCR analysis (Extended-Data Table 2).
The number of dead p5325,26,53,54/+ embryos, as a proportion of the total (dead plus alive) was also analyzed using logistic regression, with a factor for genotype and a factor for gestational age. Because some of the totals were small, we assessed significance using a permutation test, comparing the observed phenotype (ratio of dead embryos) to a set of 10,000 random permutations of the phenotype (keeping the number of dead and total numbers unchanged at each time point and re-fitting the logistic regression). Note that this analysis assumes the effect of clustering within dams is negligible. The P value for the permutation test was 0.0234: 234 out of 10,000 random permutations showed a greater frequency of death in absolute value than the frequency of death observed for p5325,26,53,54/+ embryos; the P value from logistic regression software was P=0.0003. A model allowing for a continuous effect of gestational age was also fit to explore whether the genotype affected the rate of change in hazard of death: the slopes over time for p5325,26,53,54/+ and controls were significantly different P=0.0245, despite the confidence intervals at each individual time being wide and overlapping.
Extended Data
Extended Data Figure 1. Model for Examining p53-Associated Developmental Phenotypes.
(a) Schematic of p5325,26, p5353,54, and p5325,26,53,54 mutant p53 proteins. TAD: Transactivation Domain 1 or 2, PRD: Proline-Rich Domain, Tet: Tetramerization Domain, Basic: Basic Residue-Rich Domain. (b) p53LSL-mut/+ mice (where mut can denote any of the p53 TAD mutants) were crossed to p53+/+;CMV-Cre mice, which express Cre in the germline, to assess viability and developmental phenotypes of the p53 mutant-expressing progeny. (c) Table summarizing the actual genotypes and ultimate functional genotypes of progeny from crosses of p53LSL-25,26,53,54/+ and p53+/−;CMV-Cre mice, as used throughout the manuscript. While p53LSL-25,26,53,54/+;CMV-Cre is the actual initial genotype, when Cre acts to delete the Lox-Stop-Lox cassette, the genotype will be written as p5325,26,53,54/+ to reflect this recombination. In the text and figure labels, the Cre nomenclature for both control and p5325,26,53,54/+ embryos is excluded for simplicity. Controls for analyses comprise embryos both with and without the CMV-Cre transgene, as summarized in Extended-Data Fig. 3.
Extended Data Figure 2. p5325,26,53,54/− Mice, but not p5325,26/+ or p5325,26/− Mice, are Viable.
(a) Crosses of p53LSL-25,26/+ with p53+/+;CMV-Cre or p53+/−;CMV-Cre mice reveal a decrease in viable pups expressing p5325,26 at E9.5-E10.5. Observed numbers of live and dead pups compared to the expected numbers of live pups are indicated. [Observed (Expected)] The genotypes of p5325,26/+ and p5325,26/− mice carrying a CMV-Cre transgene lack the LSL designation because the Lox-Stop-Lox element has been deleted from the genome. Significance as assessed by Binomial distribution statistical tests on live pups: p=0.18 and 0.09 (b) Crosses of p53LSL-25,26/+ or p53LSL-25,26,53,54/+ with p53+/−;CMV-Cre mice reveal that p5325,26,53,54/− mice, but not p5325,26/− mice, are viable as assessed at postnatal day 21 (P21). Mut denotes either mutant allele. Observed numbers of pups compared to the expected numbers of pups are indicated. [Observed (Expected)] The genotypes of p53mut/+ and p53mut/− mice carrying a CMV-Cre transgene lack the LSL designation because the Lox-Stop-Lox element has been deleted from the genome. Lack of pups is significant at P21 as assessed by Binomial distribution statistical tests on live pups: p5325,26/+ and p5325,26/−: *p<=3.42E-05, p5325,26,53,54/+: **p=4.77E-07 (c) Whole-mount images of a p5325,26/+ embryo (right) at E9.5 displaying developmental delay (top) and neural tube defects, including exencephaly and kinked spine (bottom), compared to littermate control (left). (d) p5325,26,53,54/− mice display a shortened lifespan (median lifespan 128 days, n=8) compared to wild-type mice (median lifespan 774 days) and a similar lifespan to p53−/− mice (median lifespan 143 days), further indicating that the p5325,26,53,54 allele itself behaves like a p53 null allele. p<0.0001 by Mantel-Cox statistical analysis comparing wild-type and p53 25,26,53,54/− mice
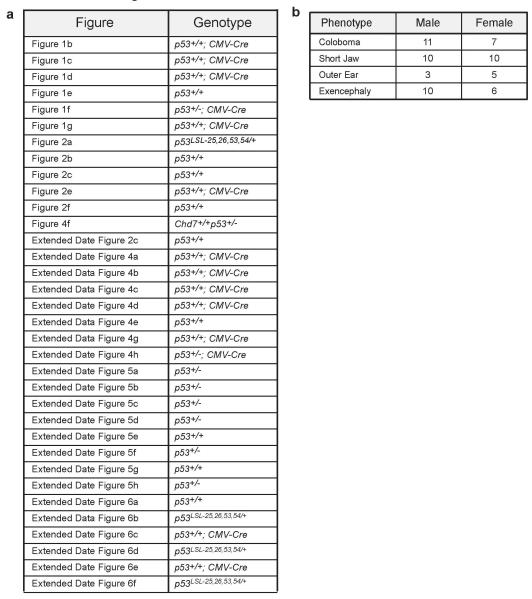
Extended Data Figure 3. Genotypes of Control Embryos in Figures and the Genders Associated with Phenotypes.
(a) Table identifying the genotypes of control embryos shown for each analysis. (b) The table shows the number of male and female p5325,26,53,54/+ embryos observed with the indicated phenotypes, as assessed by Zfy PCR. Phenotypes are well represented in both sexes.
Extended Data Figure 4. p5325,26,53,54/+ Embryos Exhibit Additional Features of CHARGE Syndrome.
(a) H&E-stained sections of E12.5 control (left) and p5325,26,53,54/+ embryos (right). Examination confirmed neural tube closure defects (arrow). (b) Close-up image of UV-illuminated, ethidium bromide-stained E15.5 p5325,26,53,54/+ embryo (right) to highlight short lower jaw phenotype with protruding tongue (arrow) compared to control littermate (left). 74% (n=27) of p5325,26,53,54/+ embryos exhibited short lower jaw. Cleft lip not shown. (c) Top: Alizarin Red (bone) and Alcian Blue (cartilage) whole-mount stained E15.0 p5325,26,53,54/+ embryo (right) showing reduced bone density in the cranium (c) and nasal cavity (n); shorter ulna (u), humerus (h), mandible (m), and femur (f); and reduced bone formation in the ribs (R), where fewer vertebrae are undergoing ossification relative to control littermate (left). Number of vertebrae with bone formation: 19 in control (arrow; V19) versus 18 in p5325,26,53,54/+ embryo (arrow; V18). The severity of bone and cartilage defects is variable, with the most severe defects evident in embryos with exencephaly and severe craniofacial defects. n=7. Bottom: Quantification of bone lengths shown as percent of E14.5-15.0 littermate controls. Bone lengths of the mandible, humerus, ulna, and femur were measured using the ruler function in Adobe Photoshop on images taken at 6.3×. Only litters with detectable bone formation in p5325,26,53,54/+ embryos were included in bone length analyses. Student’s T-test **p=0.008 (mandible), **p=0.005 (humerus). (d) Representative images of H&E-stained sagittal sections of E12.5 control (left) and p5325,26,53,54/+ hearts (right) showing all three cardiac cell types in both genotypes. en: endocardium; ep: epicardium; myo: myocardium (arrows). (e) H&E-stained E12.5 p5325,26,53,54/+ heart exhibiting persistent truncus arteriosus (PTA) (33%, n=6). The cardiac outflow tract in the control embryo (left) is septated into the aorta (Ao) and main pulmonary artery (MPA), whereas the cardiac outflow tract (truncus arteriosus or TA) in the p5325,26,53,54/+ embryo (right) remains unseptated, resulting in PTA. (f) Illustration of control heart (left) and p5325,26,53,54/+ embryo heart (right), highlighting DORV and atrioventricular cushion defects. Both the aorta (Ao) and main pulmonary artery (MPA) flow out from the right ventricle (RV), resulting in mixed oxygenated and deoxygenated blood in systemic circulation when combined with concurrent VSDs (ventricular septal defects). The atrioventricular cushions remain bulbous and fail to elongate into mature valve leaflets (mitral valve: mv; tricuspid valve: tv). Red: oxygenated blood; Blue: deoxygenated blood; Purple/Pink: mixed oxygenated/deoxygenated blood. (g) Representative H&E-stained transverse section of thymus in p5325,26,53,54/+ E15.5 embryo (right) reveals smaller thymus compared to control littermate (left) (63% of control; n=4). (h) Representative H&E analysis of liver sections from E12.5 control (left) and p5325,26,53,54/+ embryos (right) showing normal liver architecture in both genotypes (top). High magnification image (bottom) of the region of the liver outlined by the white box in the top panel shows the presence of nucleated erythrocytes (arrows), indicating proper hematopoiesis. (i) Top: Table summarizing the incidence (%) and sample size (n) for phenotypes assessed qualitatively in p5325,26,53,54/+ embryos. The occurrence of these phenotypes in CHARGE syndrome is also indicated (+ present, − absent). Bottom: Table summarizing phenotypes assessed quantitatively in p5325,26,53,54/+ embryos relative to controls, shown as the percent average size of controls (%), with sample size (n) also indicated. The occurrence of these phenotypes in CHARGE syndrome is also shown (+ present). Detailed description of bone and cartilage defects can be found in Extended-Data Fig. 4c.
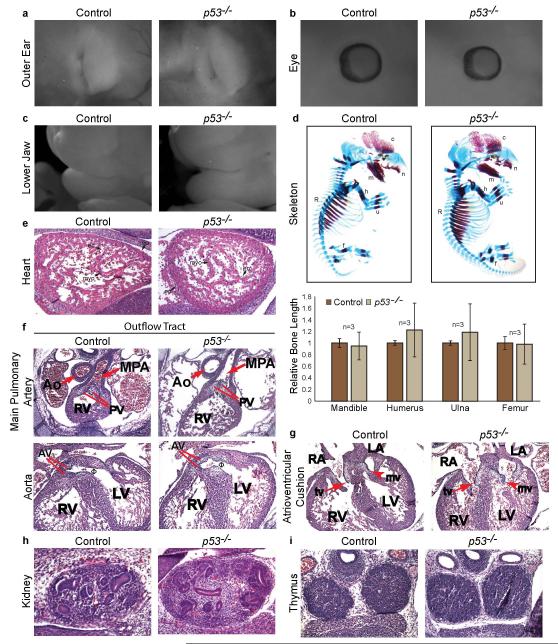
Extended Data Figure 5. p53−/−− Embryos Do Not Exhibit Characteristics of CHARGE Syndrome.
(a) Whole-mount image of the external ear of E15.5 p53−/− embryo (right) and control embryo (left) showing normal ear pinna development. (b) Whole mount image of E13.5 p53−/− embryo (right) and control embryo (left) showing normal retinal development and no evidence of coloboma. (c) Whole-mount image of E15.5 p53−/− embryo (right) and control embryo (left) with normal lower jaw development. (d) Alizarin Red (bone) and Alcian Blue (cartilage) whole-mount stained E14.5 p53−/− embryo (right) showing normal long bone formation of the ulna (u), humerus (h), mandible (m), and femur (f) relative to control littermate (left). Bottom: Quantification of bone lengths shown as percent of E14.5 littermate controls (n=3). (e) Representative images of H&E-stained sagittal sections of E13.5 control (left) and p53−/− hearts (right) showing all three cardiac cell types in both genotypes. en: endocardium; ep: epicardium; myo: myocardium (arrows). (f) Analysis of H&E-stained transverse sections of E13.5 p53−/− and control hearts revealing normal outflow tract development. (Top) The main pulmonary artery (MPA) and aorta (Ao) are fully septated, and the MPA connects to the right ventricle (RV) in p53−/− hearts. (Bottom) The aorta connects to the left ventricle (LV). Φventricular outflow tract that connects the left ventricle and aorta. PV: pulmonary valve, AV: aortic valve (g) Analysis of transverse sections of H&E-stained E13.5 p53−/− hearts (right) reveals normal atrioventricular cushions which have remodeled to form mature, elongated mitral (mv, arrowhead) and tricuspid (tv, arrow) valves similar to control hearts (left). RA: right atrium; LA: left atrium; RV: right ventricle; LV: left ventricle. (h) H&E-stained sagittal section of kidney from p53−/− (right) and control embryos (left) showing normal renal size and development. (i) H&E-stained transverse section of thymi in p53−/− E13.5 embryo (right) reveals similar thymus size compared to control littermate (left).
Extended Data Figure 6. p5325,26,53,54/+ Embryo Tissues Display Increased Apoptosis and Decreased Proliferation.
(a) Left: Immunofluorescence for Phospho-Histone H3 (red) in the retina of E13.5 control and p5325,26,53,54/+ embryos. Right: Quantification of Phospho-Histone H3 positive cells per retina area relative to littermate controls. **p-value=0.006 by one-tailed Welsh’s t-test (n=4). (b) Left: Immunohistochemistry for cleaved-caspase 3 (CC3) in thymi of control (left) and p5325,26,53,54/+ (right) embryos. Inset: close-up image of cleaved-caspase 3 positive region. Right: Quantification of CC3-positive cells per thymic area. *p-value=0.02 by one-tailed Student’s t-test (n=4). (c) Immunofluorescence for Pax3 (green) in neural crest cells of E9.5 control and p5325,26,53,54/+ embryos was used to identify neural crest cells in Figure 2f. (d) Left: Immunofluorescence for cleaved-caspase 3 (CC3, red) and Pax3 (green) in neural crest cells of E9.5 control and p5325,26,53,54/+ embryos. p5325,26,53,54/+ embryos have more apoptotic (red) neural crest cells, as determined by Pax3-positive staining (green), compared to control littermates. Right: Quantification of CC3 positive cells per total neural crest cell number. p-value=0.14 by one-tailed Student’s t-test (n=4). (e) Left: Immunofluorescence for cleaved-caspase 3 (CC3, red) in otic vesicle of E9.5 control and p5325,26,53,54/+ embryos. Right: Quantification of CC3 positive cells per total cell number. *p-value=0.03 by one-tailed Student’s t-test (n=3). (f) Whole-mount cleaved-caspase 3 staining in E8.5 control and p5325,26,53,54/+ embryos reveals enhanced apoptosis in the neuroepithelium of p5325,26,53,54/+ embryos (right) but not in controls (left). Close-up shows magnification of the caudal neuroepithelium (bottom). Arrows indicate cleaved-caspase 3 positive regions.
Extended Data Figure 7. p5325,26,53,54 is Transactivation-Dead but Augments Wild-Type p53 Activity.
(a) Western blot analysis of p53 protein levels in untreated or doxorubicin-treated (0.2 μg/ml Dox) p53−/−, p53+/−, p5325,26,53,54/−, and p5325,26,53,54/+ MEFs. Actin serves as a loading control. (b) Western blot analysis of anti-FLAG immunoprecipitation from p53−/− MEFs transiently overexpressing HA-p53 and FLAG-p53 or FLAG-p5325,26,53,54. HA-MBP and FLAG-eGFP were used as negative controls. Immunoprecipitated protein and 10% input were probed with either anti-HA or anti-FLAG. (μg ratio of HA-p53 to FLAG-p53 or FLAG-p5325,26,53,54 plasmid DNA: 1:1 or 1:2.5). (Supplement to Fig. 3b) (c) Heat map examining the transactivation capacity of p5325,26,53,54 on p53-dependent genes identified by microarray analysis through comparison of six HrasV12;p53 wild-type mouse embryo fibroblast (MEF) lines to six HrasV12;p53−null MEF lines, as previously described3. Three independent HrasV12;p5325,26,53,54/25,26,53,54 MEFs lines were analyzed, and showed that the gene expression profiles were indistinguishable from HrasV12;p53 null cells. Numbered columns indicate independent MEF lines. Blue – repressed genes; Red – induced genes. (d) qRT-PCR analysis of p53 target gene expression in untreated MEFs derived from p53+/+ and p5325,26,53,54/+ E13.5 embryos. Graphs indicate averages from four independent MEF lines, +/−SD, after normalization to β-actin. **,*** denote p-values of <0.01, and <0.005, respectively, by Student’s t-test analysis. (e) qRT-PCR analysis of p53 target gene expression in p53+/+ and p53−/− MEFs stably transduced with empty vector, FLAG-p53, or FLAG-p5325,26,53,54. Representative gene expression from one experiment. +/−SD of technical triplicates after normalization to β-actin.
Extended Data Figure 8. p53 Heterozygosity Partially Rescues Chd7-Null Embryos.
(a) qRT-PCR analysis of Chd7 in untreated MEFs derived from E13.5 p53+/− and p5325,26,53,54/+ embryos. Graphs indicate averages from four independent MEF lines, +/−s.d., after normalization to β-actin. ns=non-significant. (b) Left: Schematic of neural crest cell differentiation. Right: Representative qRT-PCR analysis of neural crest cell markers in neural crest-like cells differentiated from Chd7+/+ and Chd7−/− (whi/whi) mouse embryonic stem cells normalized to β-actin and compared to matched embryonic stem cells. (c) H&E-stained E10.5 Chd7+/+p53+/− (control), Chd7−/−p53+/+, and Chd7−/−p53+/− embryos. The Chd7−/−p53+/+ embryo shown is necrotic as evidenced by cellular autolysis. (d) Close-up image of heart region, denoted by red box in panel c, in E10.5 Chd7+/+p53+/− (control) and Chd7−/−p53+/− embryos.
Extended Data Table 1.
|
p53+/+;CMV-Cre X
p53LSL-X/+ | |||
|---|---|---|---|
| Genotype: | p53 LSL-wt | p53 LSL-53,54 | p53 LSL-25,26,53,54 |
| # Observed Progeny (# Expected
Progeny) at P21 | |||
| p53 +/+ | 18 (15) | 10 (12) | 19 (41.75) |
| p53+/+ Cre+ | 21 (15) | 14 (12) | 68 (41.75) |
| p53 LSL-X/+ | 11 (15) | 9 (12) | 50 (41.75) |
| p53X/+ Cre+ | 10 (15) | 15 (12) | 0* (41.75) |
|
| |||
| n=60 p=0.086 |
n=48 p=0.876 |
n=167 *p=7.65E-18 |
|
Extended Data Table 2.
| p53++;CMV-Cre X p53LSL-25,26,53,54/+ | ||||||
|---|---|---|---|---|---|---|
|
| ||||||
| Genotype: | Embryonic Age: |
|||||
| E12.5 | E15.5 | E13.5 | E14.5 | E18.5 | ||
| # Observed Progeny (# Expected
Progeny) | ||||||
| p53+/+ | Live | 32 (28) | 37 (45) | 21 (20) | 15 (19) | 12 (14) |
| Dead | 1 | 3 | 2 | 0 | 0 | |
| Exencephaly | 0 | 0 | 0 | 0 | 0 | |
| p53+/+Cre+ | Live | 27 (28) | 59 (45) | 20 (20) | 17 (19) | 20 (14) |
| Dead | 4 | 12 | 3 | 1 | 5 | |
| Exencephaly | 0 | 0 | 0 | 1 | 0 | |
| P53LSL-25,26,53,54/+ | Live | 26 (28) | 38 (45) | 18 (20) | 24 (19) | 9 (14) |
| Dead | 3 | 3 | 1 | 0 | 0 | |
| Exencephaly | 0 | 0 | 0 | 0 | 0 | |
| p5325,26,53,54/+ Care+ | Live | 16 (19) | 23* (37) | 7 (14) | 1** (16) | 2* (7) |
| Dead | 3 | 8 | 11 | 6 | 9 | |
| Exencephaly | 14 | 8 | 2 | 1 | 1 | |
|
p53LSL-25,26,53,54/+
Cre+ No or incomplete recombination |
Live | 9 | 8 | 6 | 3 | 7 |
| Dead | 1 | 1 | 1 | 0 | 1 | |
| Exencephaly | 0 | 2 | 0 | 0 | 0 | |
|
| ||||||
| n=122 | n=192 | n=90 | n=67 | n=65 | ||
| p=0.290 | *p=0.019 | p=0.053 | **p=1.24E-05 | *p=0.047 | ||
Supplementary Material
Acknowledgements
We thank S. Spano-Mello, K.T. Bieging, N. Raj, and M. Monje-Deisseroth for reading the manuscript and S.E. Artandi and T. Williams for discussion. We thank H. Chou for immunohistochemistry assistance; E.L. Van Nostrand, P. Lavori, and A. McMillian for statistical analysis; K. Weinberg and D. Min for thymus analyses assistance; M. Shkreli for kidney analyses assistance; B. Liu and J.A. Helms for craniofacial analyses assistance; M. Bowen for Chd7 mouse experiments assistance. We thank S.E. Artandi for plasmids; S.E. Artandi and P. Khavari for control human fibroblast cell lines; D. Lane and B. Vojtesek for wild-type p53-specific antibody (pAB242); P. Scacheri for wild-type and Chd7-null mouse ES cells, T. Denecker and G. Goudefroye for TP53 sequencing in patients. This work was supported by funding from the NSF and NCI (Grant Number 1F31CA167917-01) to JLVN and by funding from the NIH (RO1 GM095555) to J.W., from the American Heart Association (12EIA8960018), March of Dimes Foundation (#6-FY11-260), and the NIH (R01 HL118087, R01 HL121197) to C-P.C., from the NIH (R01 DC009410) to D.M.M., from the ACS, LLS, and NIH (RO1 CA140875) to LDA.
Footnotes
Author Contributions: JLVN designed and carried out experiments, interpreted data, and wrote the manuscript. C.A.B. generated the p5325,26,53,54 mice, designed and carried out experiments, and interpreted data. H.J. performed p53 ChIP analyses. M.M.K. and T.M.J. performed certain mouse analyses. D.F. and J.W. performed NCC differentiation and Chd7 ChIP analyses. C.Y.L., C.J.L., and C.P.C. assisted with heart analyses. D.L.S. and D.M.M. performed inner ear analyses and provided human fibroblasts. H.V. assisted with histological analyses. J.A.B. generated CHARGE and control human fibroblast lines. T.A.B. performed TP53 sequencing analysis in patients and supplied CHARGE thymus samples. L.D.A. designed experiments, interpreted data, and wrote the manuscript.
Competing interests statement: The authors declare that they have no competing financial interests.
References
- 1.Davenport SLH, Hefner MA, Mitchell JA. The spectrum of clinical features in CHARGE syndrome. Clinical Genetics. 1986;29:298–310. doi: 10.1111/j.1399-0004.1986.tb01258.x. doi:10.1111/j.1399-0004.1986.tb01258.x. [DOI] [PubMed] [Google Scholar]
- 2.Jongmans MCJ, et al. CHARGE syndrome: the phenotypic spectrum of mutations in the CHD7 gene. Journal of Medical Genetics. 2006;43:306–314. doi: 10.1136/jmg.2005.036061. doi:10.1136/jmg.2005.036061. [DOI] [PMC free article] [PubMed] [Google Scholar]
- 3.Brady Colleen A., et al. Distinct p53 Transcriptional Programs Dictate Acute DNA-Damage Responses and Tumor Suppression. Cell. 2011;145:571–583. doi: 10.1016/j.cell.2011.03.035. [DOI] [PMC free article] [PubMed] [Google Scholar]
- 4.Marine JC, et al. Keeping p53 in check: essential and synergistic functions of Mdm2 and Mdm4. Cell Death Differ. 2006;13:927–934. doi: 10.1038/sj.cdd.4401912. [DOI] [PubMed] [Google Scholar]
- 5.Johnson TM, Hammond EM, Giaccia A, Attardi LD. The p53QS transactivation-deficient mutant shows stress-specific apoptotic activity and induces embryonic lethality. Nature genetics. 2005;37:145–152. doi: 10.1038/ng1498. doi: http://www.nature.com/ng/journal/v37/n2/suppinfo/ng1498_S1.html. [DOI] [PubMed] [Google Scholar]
- 6.Brock KE, Mathiason MA, Rooney BL, Williams MS. Quantitative analysis of limb anomalies in CHARGE syndrome: Correlation with diagnosis and characteristic CHARGE anomalies. American Journal of Medical Genetics Part A. 2003;123A:111–121. doi: 10.1002/ajmg.a.20526. doi:10.1002/ajmg.a.20526. [DOI] [PubMed] [Google Scholar]
- 7.Zentner GE, Layman WS, Martin DM, Scacheri PC. Molecular and phenotypic aspects of CHD7 mutation in CHARGE syndrome. American Journal of Medical Genetics Part A. 2010;152A:674–686. doi: 10.1002/ajmg.a.33323. doi:10.1002/ajmg.a.33323. [DOI] [PMC free article] [PubMed] [Google Scholar]
- 8.Lalani SR, et al. Spectrum of CHD7 Mutations in 110 Individuals with CHARGE Syndrome and Genotype-Phenotype Correlation. American journal of human genetics. 2006;78:303–314. doi: 10.1086/500273. [DOI] [PMC free article] [PubMed] [Google Scholar]
- 9.Ragan DC, Casale AJ, Rink RC, Cain MP, Weaver DD. Genitourinary Anomalies in the CHARGE Association. The Journal of urology. 1999;161:622–625. [PubMed] [Google Scholar]
- 10.Inoue H, et al. Successful cord blood transplantation for a CHARGE syndrome with CHD7 mutation showing DiGeorge sequence including hypoparathyroidism. Eur J Pediatr. 2010;169:839–844. doi: 10.1007/s00431-009-1126-6. doi:10.1007/s00431-009-1126-6. [DOI] [PubMed] [Google Scholar]
- 11.Corsten-Janssen N, et al. The Cardiac Phenotype in Patients With a CHD7 Mutation. Circulation: Cardiovascular Genetics. 2013;6:248–254. doi: 10.1161/CIRCGENETICS.113.000054. doi:10.1161/circgenetics.113.000054. [DOI] [PubMed] [Google Scholar]
- 12.Rinon A, et al. p53 coordinates cranial neural crest cell growth and epithelial-mesenchymal transition/delamination processes. Development (Cambridge, England) 2011;138:1827–1838. doi: 10.1242/dev.053645. doi:10.1242/dev.053645. [DOI] [PubMed] [Google Scholar]
- 13.Armstrong JF, Kaufman MH, Harrison DJ, Clarke AR. High-frequency developmental abnormalities in p53-deficient mice. Curr Biol. 1995;5:931–936. doi: 10.1016/s0960-9822(95)00183-7. [DOI] [PubMed] [Google Scholar]
- 14.Lengner CJ, et al. Osteoblast differentiation and skeletal development are regulated by Mdm2-p53 signaling. The Journal of Cell Biology. 2006;172:909–921. doi: 10.1083/jcb.200508130. doi:10.1083/jcb.200508130. [DOI] [PMC free article] [PubMed] [Google Scholar]
- 15.Sanlaville D, et al. Phenotypic spectrum of CHARGE syndrome in fetuses with CHD7 truncating mutations correlates with expression during human development. Journal of Medical Genetics. 2006;43:211–317. doi: 10.1136/jmg.2005.036160. doi:10.1136/jmg.2005.036160. [DOI] [PMC free article] [PubMed] [Google Scholar]
- 16.Legendre M, et al. Antenatal spectrum of CHARGE syndrome in 40 fetuses with CHD7 mutations. Journal of Medical Genetics. 2012;49:698–707. doi: 10.1136/jmedgenet-2012-100926. doi:10.1136/jmedgenet-2012-100926. [DOI] [PubMed] [Google Scholar]
- 17.Veprintsev DB, Fersht AR. Algorithm for prediction of tumour suppressor p53 affinity for binding sites in DNA. Nucleic Acids Research. 2008;36:1589–1598. doi: 10.1093/nar/gkm1040. doi:10.1093/nar/gkm1040. [DOI] [PMC free article] [PubMed] [Google Scholar]
- 18.Bajpai R, et al. CHD7 cooperates with PBAF to control multipotent neural crest formation. Nature. 2010;463:958–962. doi: 10.1038/nature08733. doi: http://www.nature.com/nature/journal/v463/n7283/suppinfo/nature08733_S1.html. [DOI] [PMC free article] [PubMed] [Google Scholar]
- 19.Schnetz MP, et al. CHD7 Targets Active Gene Enhancer Elements to Modulate ES Cell-Specific Gene Expression. PLoS Genet. 2010;6:e1001023. doi: 10.1371/journal.pgen.1001023. doi:10.1371/journal.pgen.1001023. [DOI] [PMC free article] [PubMed] [Google Scholar]
- 20.Bosman EA, et al. Multiple mutations in mouse Chd7 provide models for CHARGE syndrome. Human Molecular Genetics. 2005;14:3463–3476. doi: 10.1093/hmg/ddi375. doi:10.1093/hmg/ddi375. [DOI] [PubMed] [Google Scholar]
- 21.Hurd E, et al. Loss of Chd7 function in gene-trapped reporter mice is embryonic lethal and associated with severe defects in multiple developing tissues. Mamm Genome. 2007;18:94–104. doi: 10.1007/s00335-006-0107-6. doi:10.1007/s00335-006-0107-6. [DOI] [PubMed] [Google Scholar]
- 22.Adams ME, et al. Defects in vestibular sensory epithelia and innervation in mice with loss of Chd7 function: Implications for human CHARGE syndrome. The Journal of Comparative Neurology. 2007;504:519–532. doi: 10.1002/cne.21460. doi:10.1002/cne.21460. [DOI] [PubMed] [Google Scholar]
- 23.Morimoto AK, et al. Absent Semicircular Canals in CHARGE Syndrome: Radiologic Spectrum of Findings. American Journal of Neuroradiology. 2006;27:1663–1671. [PMC free article] [PubMed] [Google Scholar]
- 24.de Oca Luna RM, Wagner DS, Lozano G. Rescue of early embryonic lethality in mdm2-deficient mice by deletion of p53. Nature. 1995;378:203–206. doi: 10.1038/378203a0. [DOI] [PubMed] [Google Scholar]
- 25.Mendrysa SM, et al. mdm2 Is critical for inhibition of p53 during lymphopoiesis and the response to ionizing irradiation. Molecular and cellular biology. 2003;23:462–472. doi: 10.1128/MCB.23.2.462-473.2003. [DOI] [PMC free article] [PubMed] [Google Scholar]
- 26.Mendrysa SM, et al. Tumor suppression and normal aging in mice with constitutively high p53 activity. Genes & development. 2006;20:16–21. doi: 10.1101/gad.1378506. doi:10.1101/gad.1378506. [DOI] [PMC free article] [PubMed] [Google Scholar]
- 27.Tyner SD, et al. p53 mutant mice that display early ageing-associated phenotypes. Nature. 2002;415:45–53. doi: 10.1038/415045a. [DOI] [PubMed] [Google Scholar]
- 28.Balow SA, et al. Knockdown of fbxl10/kdm2bb rescues chd7 morphant phenotype in a zebrafish model of CHARGE syndrome. Developmental biology. 2013;382:57–69. doi: 10.1016/j.ydbio.2013.07.026. doi: http://dx.doi.org/10.1016/j.ydbio.2013.07.026. [DOI] [PMC free article] [PubMed] [Google Scholar]
- 29.Corsten-Janssen N, et al. More Clinical Overlap between 22q11.2 Deletion Syndrome and CHARGE Syndrome than Often Anticipated. Molecular Syndromology. 2013;4:235–245. doi: 10.1159/000351127. [DOI] [PMC free article] [PubMed] [Google Scholar]
- 30.Jones NC, et al. Prevention of the neurocristopathy Treacher Collins syndrome through inhibition of p53 function. Nature medicine. 2008;14:125–133. doi: 10.1038/nm1725. doi: http://www.nature.com/nm/journal/v14/n2/suppinfo/nm1725_S1.html. [DOI] [PMC free article] [PubMed] [Google Scholar]
Supplemental References
- 31.Schwenk F, Baron U, Rajewsky K. A cre-transgenic mouse strain for the ubiquitous deletion of loxP-flanked gene segments including deletion in germ cells. Nucleic Acids Research. 1995;23:5080–5081. doi: 10.1093/nar/23.24.5080. doi:10.1093/nar/23.24.5080. [DOI] [PMC free article] [PubMed] [Google Scholar]
- 32.Sato T, Bartunkova S. In: Developmental Biology Protocols Vol. 137 Methods in Molecular Biolog™. Tuan RockyS, Lo CeciliaW., editors. Vol. 23. Humana Press; 2000. pp. 223–233. [Google Scholar]
- 33.Ovchinnikov D. Alcian Blue/Alizarin Red Staining of Cartilage and Bone in Mouse. Cold Spring Harbor Protocols 2009. 2009 doi: 10.1101/pdb.prot5170. pdb.prot5170, doi:10.1101/pdb.prot5170. [DOI] [PubMed] [Google Scholar]
- 34.Hurd EA, Poucher HK, Cheng K, Raphael Y, Martin DM. The ATP-dependent chromatin remodeling enzyme CHD7 regulates pro-neural gene expression and neurogenesis in the inner ear. Development (Cambridge, England) 2010;137:3139–3150. doi: 10.1242/dev.047894. doi:10.1242/dev.047894. [DOI] [PMC free article] [PubMed] [Google Scholar]
- 35.Lane D, et al. Epitope analysis of the murine p53 tumour suppressor protein. Oncogene. 1996;12:2461–2466. [PubMed] [Google Scholar]
- 36.Rada-Iglesias A, et al. Epigenomic Annotation of Enhancers Predicts Transcriptional Regulators of Human Neural Crest. Cell Stem Cell. 2012;11:633–648. doi: 10.1016/j.stem.2012.07.006. doi: http://dx.doi.org/10.1016/j.stem.2012.07.006. [DOI] [PMC free article] [PubMed] [Google Scholar]
- 37.Kenzelmann Broz D, et al. Global genomic profiling reveals an extensive p53-regulated autophagy program contributing to key p53 responses. Genes & development. 2013;27:1016–1031. doi: 10.1101/gad.212282.112. doi:10.1101/gad.212282.112. [DOI] [PMC free article] [PubMed] [Google Scholar]
Associated Data
This section collects any data citations, data availability statements, or supplementary materials included in this article.


